Democrats maintained a large edge among Latinos voting in Tuesday’s midterm elections, but in some states, Republican candidates won more than 40% of the Latino vote, according to a Pew Research Center analysis of National Election Pool exit poll data as reported by NBC News. Though Democrats comfortably won the Latino vote in nearly all states that had key Senate or gubernatorial races (and for which exit poll data is available), Republican candidates won many of those contests, and will take control of the U.S. Senate for the first time since 2007.
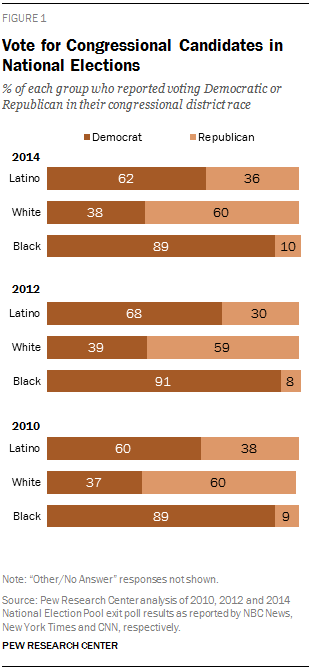
In congressional races nationally, Democrats won the Latino vote by a margin of 62% to 36%. This is comparable to the last midterm cycle four years ago when six-in-ten (60%) Latinos voted for a Democratic candidate, but down from 2012 when Democrats took 68% of the Latino vote.
By comparison, Republicans won the white vote by a nearly as wide a margin — 60% to 38%, essentially unchanged from 2010 and 2012. Among black voters, 89% voted for the Democratic candidate in their local congressional election while 10% supported the Republican. This is unchanged from 2010. In 2012, 91% of black voters supported Democrats and 8% backed Republicans.
The national exit poll shows Latinos made up an estimated 8% of voters this year.1 The share of Hispanics who voted remained unchanged from their estimated share in 2010 and 2006 despite the growing share of eligible voters (U.S. citizens ages 18 or older). This year, 11% of all eligible voters are Hispanic, up from 10.1% in 2010 and 8.6% in 2006 (Lopez, Krogstad, Patten and Gonzalez-Barrera, 2014).
The unchanged Hispanic share of voters suggests that the Hispanic voter turnout rate may not have changed much from 2010, when 31.2% of Hispanic eligible voters cast a vote.2
Meanwhile, the national exit poll reports the estimated black voter share was 10% in 2006, 11% in 2010 and 12% in 2014. And the share of white voters has declined from 79% in 2006 to 77% in 2010 and now to 75%, reflecting growing diversity of the nation’s population and electorate.
Hispanic Vote in Select State Races

In several states where exit polling data for Hispanic voters is available, Democrats generally won the Hispanic vote in Senate and gubernatorial races. But in some states, Republicans did well among Hispanics, securing 40% or more of the vote.
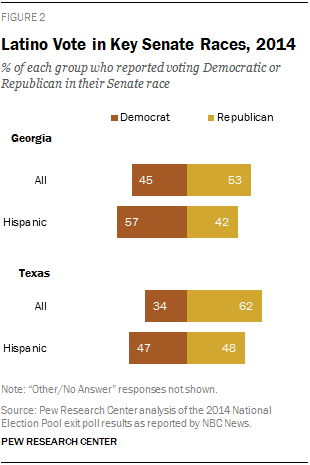
This held true for two Senate races. In Georgia, Democrat Michelle Nunn won 57% of the Latino vote to Republican David Perdue’s 42%. But Perdue won the election. In Texas, the Latino vote was split between incumbent Republican John Cornyn (48%) and Democrat David Alameel (47%), as Cornyn won support from nearly half of Latinos. Exit poll data is not available for the Latino vote in Colorado or North Carolina, two key states in this year’s election.

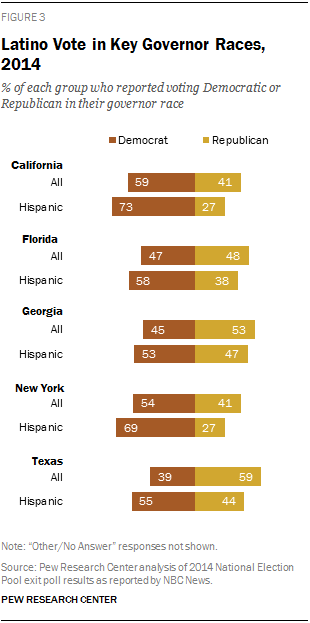
In races for governor, the three states with the largest number of Latino voters had contests — California, Texas, and Florida. In Florida, Gov. Rick Scott won re-election despite losing the Hispanic vote to Democrat Charlie Crist by a margin of 38% to 58%, according to the state exit poll. That’s a marked decline from 2010, when 50% of Hispanics voted for Scott and from 2006, when the Latino vote was split 49%-49% between the two parties.
In the Texas race for governor, Democrat Wendy Davis won the Latino vote 55% to 44% but lost the election to Republican Greg Abbott.
In California’s governor race, a greater share of Hispanics voted Democratic than in the previous two midterm elections. Gov. Jerry Brown (D) won the Hispanic vote by a margin of 73% to 27% in his victory over Republican Neel Kashkari this year. During the previous two elections, the Democratic candidate won 64% (2010) and 56% (2006) of the Hispanic vote.
In two other states with exit poll data for gubernatorial races, Latino voters gave their support to Democratic candidates. In New York, incumbent Democrat Andrew Cuomo defeated Republican Rob Astorino among Latino voters by a margin of 69% to 27%. And in Georgia, Republican Nathan Deal defeated Democrat Jason Carter in the race for governor. But Carter won a greater share of the Latino vote than Deal, by a margin of 53% to 47%, according to the state’s exit poll.
Several Hispanic candidates won elections to statewide offices and Congress this year. Two Hispanic Republicans who won races for governor in 2010—Susana Martinez in New Mexico and Brian Sandoval in Nevada— comfortably won re-election. Martinez won with 57% of the vote, and Sandoval 71% (exit poll data on the Hispanic vote in each state was not available).
This year saw five new Latinos elected to Congress, according to the National Association of Latino Elected and Appointed Officials. In Florida, Republican Carlos Curbelo defeated incumbent Democrat Joe Garcia in the state’s 26th Congressional District. In West Virginia’s 2nd Congressional District, Republican Alex Mooney was elected, while. Ruben Gallego (D) won Arizona’s 7th Congressional District. In California, Democrat Pete Aguilar won in the 31st Congressional District, and Democrat Norma Torres won in the 35th Congressional District (exit poll data on the Hispanic vote was not available for these races).3
Democratic Advantage Somewhat Larger among Latino Women

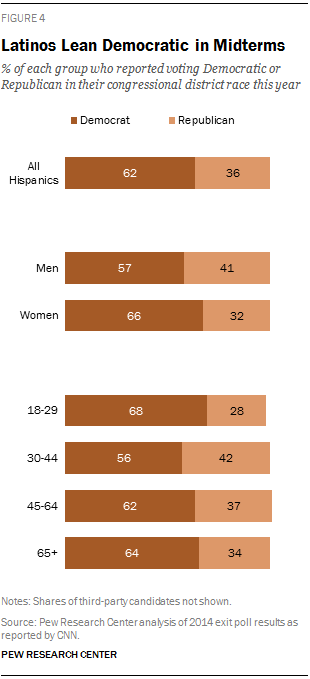
Nationally, Democrats won majorities of the Hispanic vote across many demographic subgroups in congressional races. For example, Hispanic women favored Democrats over Republicans by a margin of 66% to 32%, compared with 57% to 41% among Hispanic men.
There were also differences by age. Democrats beat Republicans 68% to 28% among the youngest Latino voters (ages 18-29). The margin was smaller among those ages 30-44, with Democrats winning 56% of the vote. Democrats won 62% of the Latino vote among those ages 45-64 and 65% of those 65 or older.
Latino Voters Say Economy Top Issue Facing the Country in 2014
Asked about a variety of pressing national priorities, 49% of Latino voters identified the economy as the most important issue facing the country, followed by health care (24%) and illegal immigration (16%). That ranking is similar to that of all U.S. voters, among whom 45% named the economy, 25% heath care and 14% illegal immigration.
The national exit poll also asked voters whether most illegal immigrants working in the U.S. should be offered legal status or be deported. Three-in-four (74%) Latino voters supported offering legal status, while 21% said illegal immigrants should be deported. By comparison, 57% of U.S. voters said illegal immigrants should be able to gain legal status, and 38% said they should be deported.
About This Report
Exit poll results for this report were obtained from NBC News and CNN 2014 election websites on November 6, 2014 and are based on national and state exit poll surveys of voters as conducted by Edison Research for the National Election Pool. In addition to an analysis of the national Latino vote, the Latino vote in five states was examined. These states are California, Florida, Georgia, New York and Texas.
This report was written by Jens Manuel Krogstad and Mark Hugo Lopez. Charts and tables were created by Jens Manuel Krogstad. Number-checking was done by Ana Gonzalez-Barrera and Anna Brown. Copy editing was done by Bruce Drake. Find related reports online at pewresearch.org/pewresearch-org/hispanic.
A Note on Terminology
The terms “Latino” and “Hispanic” are used interchangeably in this report.


