The nation’s Hispanic population has long been characterized by its immigrant roots. But as immigration from Latin America slows, the immigrant share among each of the nation’s Hispanic origin groups is in decline, according to a new Pew Research Center analysis of U.S. Census Bureau data. This report explores data of the 14 largest Hispanic origin groups, unless otherwise noted.

Despite falling immigrant shares across all Latino origin groups, fast Latino population growth has led to continued growth in the number of Latino immigrants (though growth has slowed in recent years). Among all Latinos, there were 14.1 million immigrants in 2000. By 2005, that number reached 16.8 million, and by 2013, there were 19 million Latino immigrants in the U.S. The same pattern is present among all Latino origin groups, though for three—Ecuadorians, Mexicans and Nicaraguans—the number of immigrants has declined since 2010 (for details, see Appendix Table A2).
Accompanying this report are 14 statistical profiles for Mexicans, Puerto Ricans, Salvadorans, Cubans, Dominicans, Guatemalans, Colombians, Spaniards, Hondurans, Ecuadorians, Peruvians, Argentineans, Nicaraguans and Venezuelans describing the demographic, economic and income characteristics, along with tabulations for each group’s U.S.-born and foreign-born populations residing in the 50 states and the District of Columbia (in the case of Puerto Ricans, tabulations for those born in the mainland U.S. and those born on the island are shown). Each origin group’s characteristics are compared with all Hispanics and the U.S. population overall. The reports for the five largest Hispanic origin groups (Mexicans, Puerto Ricans, Cubans, Salvadorans and Dominicans) also include tabulations showing religious affiliation and identity preferences based on public opinion data from the Pew Research Center’s 2013 survey of Hispanic adults
Diverse Origins
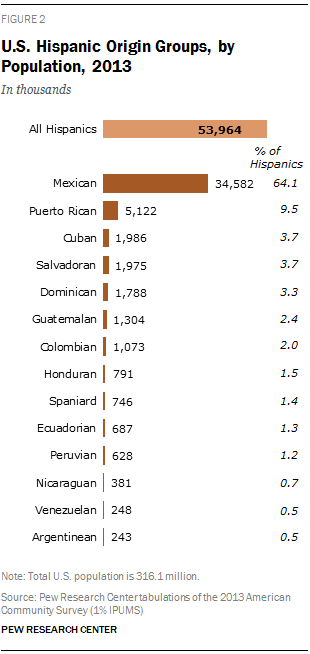
The nation’s Latino population is its largest minority group, numbering more than 53 million, or 17.1% of the U.S. population, in 2013.
It is also diverse in a number of ways. While Mexicans are by far the largest origin group at 34.6 million (making up 64.1% of all U.S. Latinos), the nation’s Latinos trace their roots to every part of Latin America. For example, Puerto Ricans are the second-largest Latino origin group and represent about 9.5% of all U.S. Latinos.1 Beyond these two groups, no other makes up more than 5% of the U.S. Latino population. Cubans and Salvadorans, the two next largest groups, each make up just under 4% of the Latino population, with populations of about 2 million each.
Even though the foreign-born share is declining among each Hispanic origin group, the share that is foreign born varies widely across them. Venezuelans had the highest foreign-born share, at 69% in 2013. They are followed by Peruvians at 65%, Guatemalans at 64% and Hondurans at 63%. Only Mexicans (33%), Spaniards (14%) and Puerto Ricans (2%) have foreign-born shares of less than half of their total population.
The 14 largest Hispanic origin groups differ in other ways, too. Mexicans, for example, have the lowest median age, at 26 in 2013, while Cubans are the oldest with a median age of 40. Hispanics on the whole are younger than the general U.S. population, with median ages of 28 and 37, respectively.
In terms of educational attainment, Venezuelans are the most likely to be college-educated, with half of Venezuelans ages 25 and older having completed a bachelor’s degree or more. By comparison, Salvadorans (8%), Hondurans (9%) and Guatemalans (9%) have the lowest share of adults ages 25 and older with a college degree. The U.S. population overall is twice as likely as Hispanics overall to have earned a bachelor’s degree or more—at 30% and 14%, respectively.
On language use, according to U.S. Census Bureau data, fully 68% of all U.S. Hispanics ages 5 and older speak only English in their homes or speak English “very well”—a new high reflecting the rise in English proficiency among Hispanics (Krogstad, Stepler and Lopez, 2015). Among Hispanic adults, one-quarter indicate they are English-dominant, 38% are Spanish-dominant, and 36% are bilingual (Krogstad and Gonzalez-Barrera, 2015), according to a 2013 Pew Research Center survey of Hispanics.2 Among the five largest Hispanic origin groups, 84% of Puerto Ricans speak only English or are bilingual—a higher share than Mexicans, Dominicans, Cubans or Salvadorans. Meanwhile, just 37% of Salvadoran adults speak either English or are bilingual, among the lowest share of the five largest Hispanic origin groups.
Argentineans have the highest median household income at $63,000, about $20,000 higher than the median household income of all Hispanics ($41,000). Overall, one-quarter of Hispanics live below the poverty line—higher than the 16% poverty rate among the general U.S. population. Guatemalans, Hondurans and Dominicans have the highest share of people living below the poverty line, at 28% each.
Additional comparisons and rankings of the nation’s largest Hispanic origin groups are shown in the appendix of this report. And the interactive graphic accompanying this report compares and ranks these groups on a number of demographic and economic characteristics.
The terms “Latino” and “Hispanic” are used interchangeably in this report.
“U.S. born” refers to those born in the U.S., Puerto Rico or other U.S. territories and those born abroad to at least one parent who was a U.S. citizen.
“Foreign born” refers to people born outside the U.S., Puerto Rico or other U.S. territories to parents neither of whom was a U.S. citizen. It also includes immigrants who are in the U.S. legally and immigrants who are in the U.S. without authorization.
The terms “foreign born” and “immigrant” are used interchangeably.
“Speaking English proficiently” or “English proficiency” refers to those who speak only English at home or those who speak a language other than English at home but indicate they speak English “very well,” the highest response category on a four-point scale of English speaking ability. Those who do not speak English proficiently include those who speak a language other than English at home and indicate they do not speak English or that they speak English “well” or “not very well.” This information is self-reported in U.S. Census Bureau surveys such as the American Community Survey.


