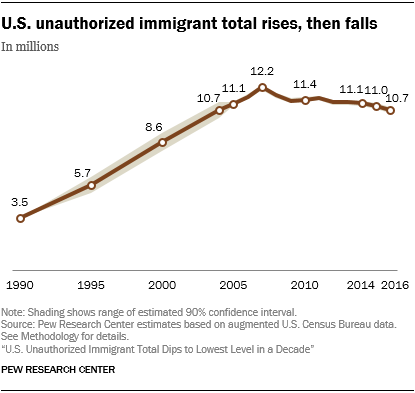
Compared with 2007, when their population was at its peak, unauthorized immigrants make up a smaller share of all U.S. residents (3% vs. 4%) and of all immigrants (24% vs. 30%).
The number of unauthorized immigrants rose sharply in the 1990s and reached 12.2 million in 2007, as the recession began. It declined through the end of the recession in 2009, then stabilized until ticking down in 2015. The 2016 total represents a further decline and is the lowest since 2004, when it was 10.7 million. Still, the total is about triple what it was in 1990 and nearly double the 5.7 million in 1995.
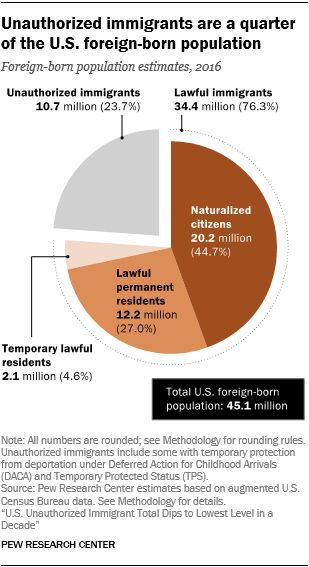
Compared with 2007, unauthorized immigrants are a smaller share of the U.S. foreign-born population, which numbered 45.1 million in 2016. Meanwhile, the share of legal immigrants has risen. Unauthorized immigrants were 24% of the total foreign born in 2016, compared with 30% in 2007. Naturalized citizens accounted for 45%, up from 38% in 2007. Lawful permanent residents – that is, immigrants with green cards who have not become citizens – constituted 27% of the foreign born in 2016, about the same as in 2007, when they were 28%.
Temporary lawful residents – mainly students and temporary workers – were 5% of the foreign-born population in 2016, compared with 4% in 2007.
The lawful immigrant population, numbering 34.4 million in 2016, grew from 28.3 million in 2007, a contrast to the decline in the unauthorized immigrant population. The total U.S.-born population also grew modestly during this period, to 279.8 million in 2016 from 263.3 million in 2007.
Decline in Mexicans fuels overall unauthorized immigrant decrease
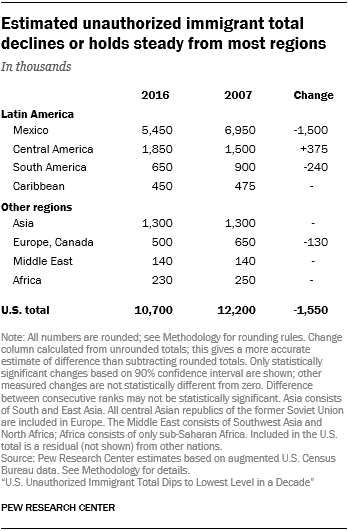
The number of unauthorized immigrants grew from 2007 to 2016 from only one group of nations: Central America. Fueled mainly by immigrants from the Northern Triangle nations of El Salvador, Guatemala and Honduras, the total from Central America rose by 375,000 during that period.
The total unauthorized immigrant population is lower than its peak mainly because of a decrease in the number of unauthorized immigrants from Mexico, the largest country of origin (treated as a region in this report because of its importance).
From 2009 to 2014, according to a Pew Research Center analysis of government data, more Mexicans left the U.S. than arrived. About 1 million Mexicans left the U.S. during this period, and an estimated 870,000 arrived. The decline mainly was due to departures of unauthorized immigrants.
According to Mexican government survey data, most returnees said they left the U.S. of their own accord, and the majority cited family reunification as the main reason for going to Mexico. However, 14% said they came back because they were deported.
According to new additional analysis of the Mexican government statistics on return migrants, the overwhelming majority (72%) were male and most (77%) were in the prime working ages of 15 to 59, which is in accord with the decline in male, working-age unauthorized immigrants in Center estimates. Among return migrants who had lived in the U.S. one or five years earlier but were back in Mexico in 2014, nearly three-quarters were men. People ages 15 to 59 accounted for more than three-quarters of returnees.
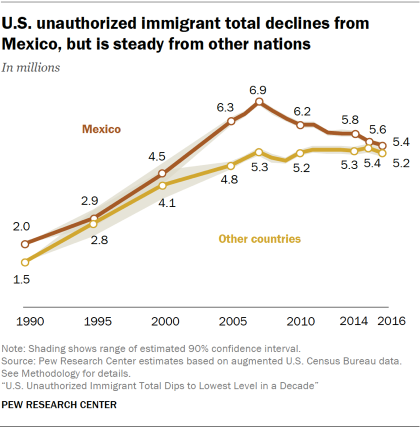
CORRECTION (June 25, 2019): The chart “U.S. unauthorized immigrant total declines from Mexico, but is steady from other nations” has been updated to include the correct number of unauthorized immigrants from countries other than Mexico in 1990 (1.5 million).
Mexicans are a shrinking share of those apprehended at the border
Supporting the Pew Research Center findings about declines in unauthorized immigrants from Mexico are recent trends in Border Patrol apprehensions. Although apprehensions are not a direct measure of unauthorized immigration, they do offer helpful context.
In fiscal 2017, there were about 130,000 apprehensions of Mexicans and 180,000 apprehensions of non-Mexicans at all U.S. borders, mainly the southwest border. Apprehensions of non-Mexicans – about nine-in-ten from El Salvador, Guatemala and Honduras – exceeded those of Mexicans in 2016 and, for the first time, in fiscal 2014.
Apprehensions of Mexicans have declined markedly over the past decade, from more than 800,000 in fiscal 2007 and more than a million in some earlier years. But apprehensions of non-Mexicans have risen, from 68,000 in fiscal 2007.
In Pew Research Center surveys, the share of Mexicans saying they would work and live in the U.S. without authorization has declined. The share of Mexicans who say they would like to move to the U.S. has been somewhat stable since 2009. But among those who do want to move, a majority in 2017 (60%) said they would not be inclined to do so without authorization, a change from previous surveys, where half or fewer said they would not.
Unauthorized immigrant population declines not just from Mexico, but also South America and combined Europe/Canada region
Mexican unauthorized immigrant numbers peaked in 2007 and began to decrease the following year. The total in 2016 – 5.4 million – was 1.5 million lower than at its high point in 2007. Mexicans made up about half the U.S. total unauthorized immigrant population, down from 57% in 2007.
The total also went down over the 2007 to 2016 period for unauthorized immigrants from South America and the combined region of Europe and Canada. The remaining regions (the Caribbean, Asia, Middle East-North Africa, sub-Saharan Africa, and the rest of the world) did not have statistically significant change over that era. Central America was the only region that grew.
The race and ethnicity of unauthorized immigrants generally reflect their national origins. About three-quarters (74%) were Hispanic in 2016. Among non-Hispanics, 12% were Asian, 7% white and 5% black, while the rest were of multiple races or other races.
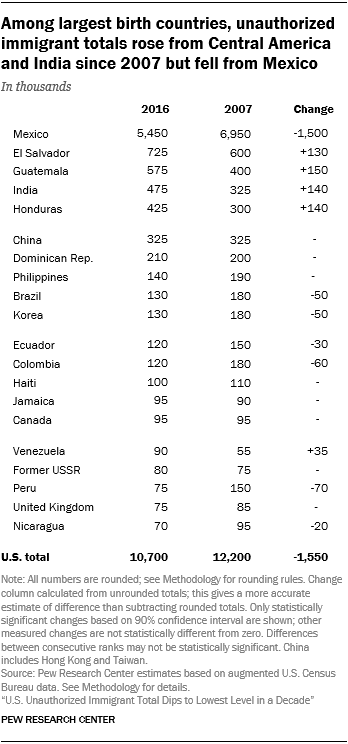
As Mexican numbers decline, those from other large birth nations grow
Among individual nations with the 20 largest unauthorized immigrant populations in the U.S., there were statistically significant increases between 2007 and 2016 from the three Northern Triangle nations, India and Venezuela. Decreases occurred not only from Mexico, but also from Brazil, Colombia, Ecuador, Korea, Nicaragua and Peru.
More recently, from 2015 to 2016, there was a statistically significant change, a decline, in the unauthorized immigrant population from only one region – Asia. Two of the 20 largest birth countries had changes in their U.S. unauthorized immigrant populations from 2015 to 2016: The number from Honduras rose, and the number from Peru decreased.
Other regions or nations may have had changes, but that cannot be stated with certainty because of the margin of error in the data.


