The terms Asian, Asians living in the United States, U.S. Asian population and Asian Americans are used interchangeably throughout this report to refer to U.S. adults who self-identify as Asian, either alone or in combination with other races or Hispanic identity, unless otherwise noted.
The term immigrants, when referring to survey respondents, includes those born outside the 50 U.S. States or the District of Columbia, Puerto Rico or other U.S. territories. When referring to Census Bureau data, this group includes those who were not U.S. citizens at birth – in other words, those born outside the 50 U.S. states or D.C., Puerto Rico, or other U.S. territories to parents who were not U.S. citizens. Immigrant and foreign born are used interchangeably throughout this report.
The term U.S. born refers to people born in the 50 U.S. states, the District of Columbia, Puerto Rico or other U.S. territories.
Ethnicity labels, such as Chinese or Filipino, are used in this report for findings for Asian immigrant ethnic groups, such as Chinese, Filipino, Indian, Korean or Vietnamese. For this report, ethnicity is not nationality or birthplace. For example, Chinese immigrants in this report are those self-identifying as of Chinese ethnicity, rather than necessarily being a current or former citizen of the People’s Republic of China. Ethnic groups in this report include those who self-identify as one Asian ethnicity only, either alone or in combination with a non-Asian race or ethnicity.
Less populous Asian immigrant ethnic groups in this report are those who self-identify with ethnic groups that are not among the five largest Asian immigrant ethnic groups and identify with only one Asian ethnicity. These ethnic origin groups each represent about 3% or less of the Asian immigrant population in the U.S. For example, those who identify as Burmese, Hmong, Japanese or Pakistani among others are included in this category. These groups are not reportable on their own due to small sample sizes, but collectively they are reportable under this category.
Country of origin is used in this report to refer to the places that respondents trace their roots or origin to. This may be influenced by ethnicity, birthplace, nationality, ancestry, or other social, cultural or political factors. This study asks several questions about respondents’ connection to and views of their country of origin. Subsequently, in different sections of this report, country of origin is used interchangeably with home country, country they came from, country where they were born, and country where their family or ancestors are from, depending on how the specific question was asked. For the exact question wording, refer to the topline.
Throughout this report, the phrases Democrats and Democratic leaners and Democrats refer to respondents who identify politically with the Democratic Party or who are independent or identify with some other party but lean toward the Democratic Party. Similarly, the phrases Republicans and Republican leaners and Republicans both refer to respondents who identify politically with the Republican Party or are independent or identify with some other party but lean toward the Republican Party.
Pew Research Center conducted this analysis to understand Asian immigrants’ experiences coming to and living in the United States. This report is part of the Center’s ongoing in-depth analysis of public opinion among Asian Americans.
The data in this report comes from two main sources. The first data source is Pew Research Center’s survey of Asian American adults, conducted from July 5, 2022, to Jan. 27, 2023, in six languages among 7,006 respondents, including 5,036 Asian immigrants. For details, refer to the methodology. For questions used in this analysis, along with responses, refer to the topline.
The second set of data sources are the U.S. Census Bureau’s decennial census data and American Community Surveys (ACS). Demographic analyses of Asian immigrants are based on full-count decennial censuses from 1860, 1870, 1880, 1900, 1910, 1920, 1930 and 1940; the 1% 1950 census; the 5% 1960 census; the 3% 1970 census (1% Form 1 state sample, 1% Form 1 metro sample, and 1% Form 1 neighborhood sample); the 5% 1980 census, 5% 1990 census, and 5% 2000 census; and the 2009, 2014, 2019 and 2022 ACS 5-year samples. Both decennial census data and ACS data were obtained through IPUMS USA.
Analysis of census data for the immigrant or foreign-born population consists of people born outside the United States or its territories who are not U.S. citizens at birth. People born in the following places were defined as part of the U.S.-born population, provided these territories were recognized as U.S. territories at the time of respective surveys: Alaska (1870 and later); Hawaii, Puerto Rico, Guam and American Samoa (1900 and later); Philippines (1900-1940); Panama Canal Zone (1910-1970); U.S. Virgin Islands (1920 and later); Trust Territory of the Pacific (1950-1980); and Northern Mariana Islands (1950 and later).
Pew Research Center is a subsidiary of The Pew Charitable Trusts, its primary funder. The Center’s Asian American portfolio was funded by The Pew Charitable Trusts, with generous support from The Asian American Foundation; Chan Zuckerberg Initiative DAF, an advised fund of the Silicon Valley Community Foundation; the Robert Wood Johnson Foundation; the Henry Luce Foundation; the Doris Duke Foundation; The Wallace H. Coulter Foundation; The Dirk and Charlene Kabcenell Foundation; The Long Family Foundation; Lu-Hebert Fund; Gee Family Foundation; Joseph Cotchett; the Julian Abdey and Sabrina Moyle Charitable Fund; and Nanci Nishimura.
We would also like to thank the Leaders Forum for its thought leadership and valuable assistance in helping make this survey possible.
The strategic communications campaign used to promote the research was made possible with generous support from the Doris Duke Foundation.
Asian Americans are the only major racial or ethnic group in the United States that is majority immigrant. Some 54% of the 24 million Asian Americans living in the U.S. are immigrants; among Asian adults, that share rises to 67%.1
Asian immigrants trace their origins from all parts of Asia and make up a significant portion of the overall U.S. immigrant population: Three of the four largest U.S. immigrant populations are from India (2.8 million), China (2.5 million), and the Philippines (2 million).
The diverse origins and varied experiences of international migration and engagement with the U.S. immigration system make up a key part of many Asian Americans’ lives. Moreover, Asian immigrants’ experiences with immigration are linked to their views on what the federal government’s priorities should be for U.S. immigration policy.
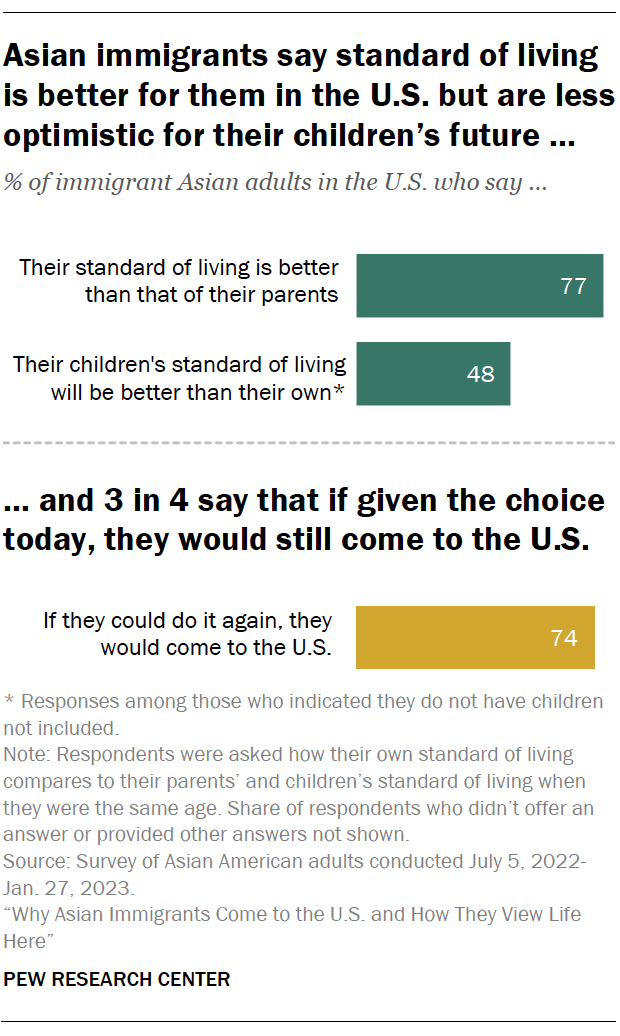
A new analysis of Pew Research Center’s 2022-23 survey of Asian American adults finds that Asian immigrants overall give positive assessments of their lives in America compared with their origin country. A large majority (77%) say their standard of living is better than that of their parents in their home countries. At the same time, Asian immigrants are less optimistic about their children’s standard of living being better than their own, and more than half say the country is generally headed in the wrong direction. Still, most (74%) say they would migrate to the U.S. again if given the choice today.
More than half of Asian immigrants say the nation’s immigration system needs large changes (59%). And when asked about U.S. immigration policy goals, attracting highly skilled immigrants to the U.S. is one of the top priorities (86%).
These findings come from Pew Research Center’s multilingual, nationally representative survey of 7,006 Asian American adults, including 5,036 Asian immigrants, conducted from July 5, 2022, to Jan. 27, 2023.
This report explores the following topics:
- Asian American immigrants’ experiences adjusting to life in the U.S. (Chapter 1)
- Asian American immigrants’ views of quality of life in the U.S. (Chapter 2)
- How Asian Americans see the U.S. immigration system (Chapter 3)
Immigrants from Asia have long been a part the U.S. immigration story. In the 1800s, Asians were brought to the U.S. as indentured laborers amid the emancipation of enslaved African Americans. Hawaii was a major hub for early Asian immigrants – particularly those from Japan, China and the Philippines – who were brought to work on plantations. By the 1840s, many Chinese immigrants had arrived in California as part of the state’s Gold Rush. In later decades, Chinese and Japanese immigrants largely lived on the West Coast, helping to build the nation’s railroads and other infrastructure.
By the late 1800s, the U.S. government’s stance on immigration from Asia had shifted. In 1882, the federal government enacted the Chinese Exclusion Act, which stopped Chinese laborer immigration to the U.S. for decades.
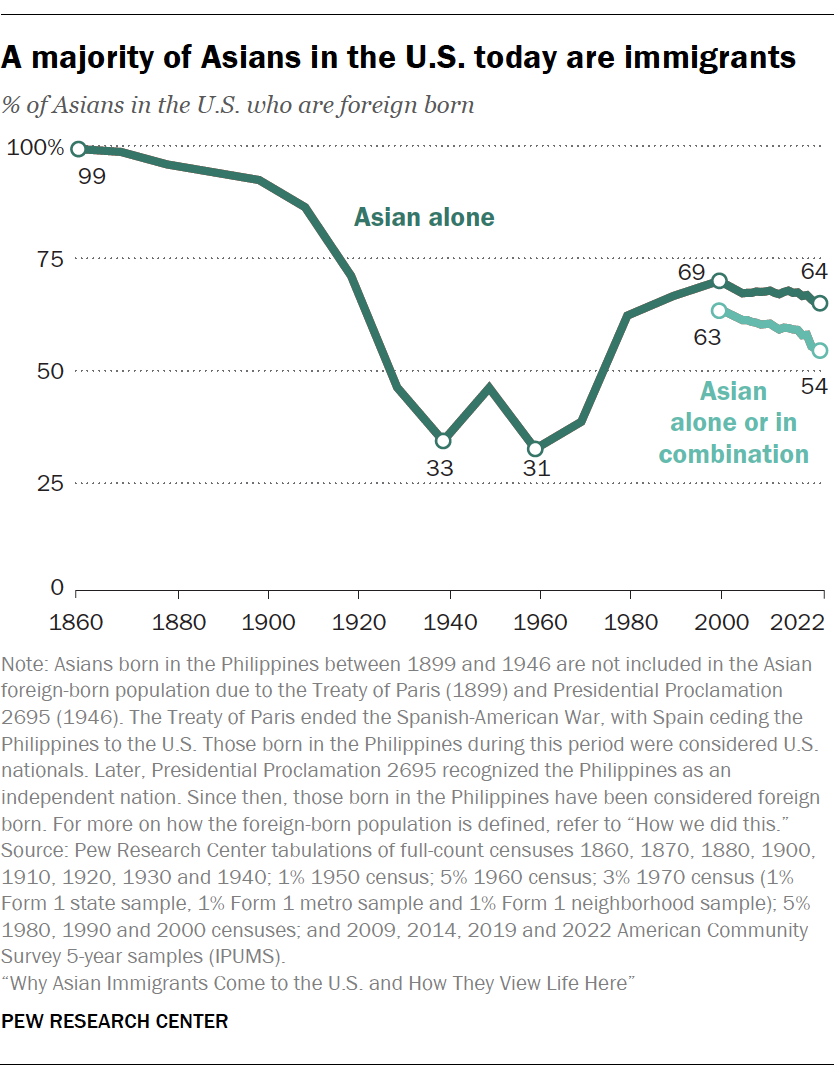
Demographically, immigrants have often made up most of the Asian American population. In 1860, nearly all Asian Americans were immigrants, with most immigrants from China and Japan, according to Center analysis of Census Bureau data.2 That share dropped to 31% by the 1960s as immigration flows to the U.S. slowed from Asia and elsewhere following restrictive immigration laws of the 1910s and onward.
Since 1965, immigration reform eliminated a number of country-based quotas and restrictions. A new wave of Asian immigrants came to the U.S., pushing the share of foreign-born Asians to a peak in 2000. An estimated 19 million immigrants from East and South Asia had arrived in the U.S. since 1965. In the 21st century, as Asian Americans became the nation’s fastest growing racial or ethnic group, immigrants made up a declining share of the population.
Why Asian immigrants come to the U.S.
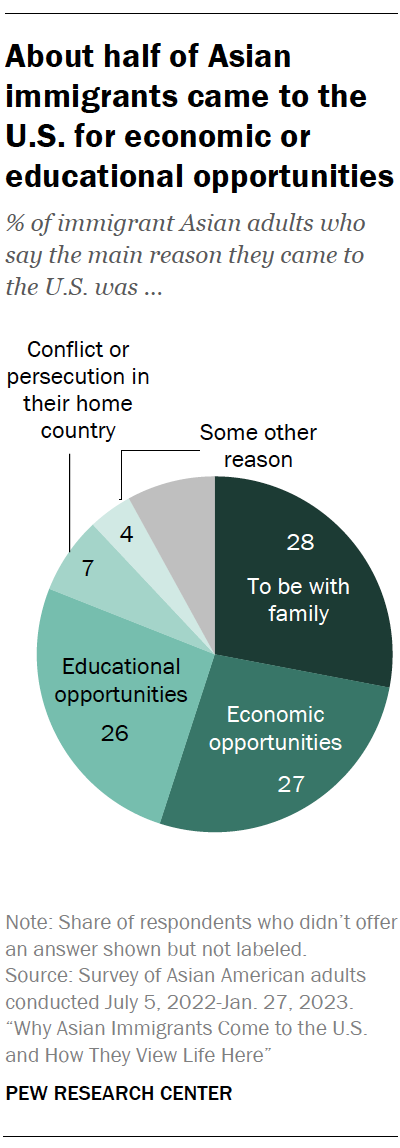
Asian immigrants have followed many pathways in coming to the United States. About a quarter each say they came to the U.S. to be with family (28%) or to seek economic (27%) or educational (26%) opportunities. A smaller share (7%) say they came to escape from conflict or persecution in their origin country.
Reasons for immigrating vary across Asian ethnic groups, reflecting the diverse histories of their origin countries.
- About 40% each of Filipino and Indian immigrants came to the U.S. for economic opportunities – a higher share compared with Korean (26%), Chinese (16%) and Vietnamese (9%) immigrants.
- 32% of Vietnamese immigrants say they came to the U.S. to escape conflict or persecution; by comparison, fewer than 5% of Chinese, Indian, Filipino and Korean immigrants say the same.
Jump to read more about why Asians immigrate to the U.S.
Asian immigrants adjusting to life in the U.S.
Asian immigrants faced many adjustments navigating their new lives in the U.S. Among them are:
Learning to speak English
Nearly all Asian immigrants (91%) say speaking English is important to succeed in the U.S., and roughly two-thirds (64%) say they had learned English before immigrating. Asian immigrants who arrived in the last decade are more likely to say they learned to speak English before arriving than those who came to the U.S. more than 20 years ago (89% vs. 57%).
Receiving financial help
About six-in-ten Asian immigrants (58%) say they received financial assistance in some way after they arrived in the U.S. But whether they received help – and from what sources – varies by their motivation for immigrating:
- 64% of those who immigrated to escape conflict report receiving government financial assistance in their first six months in the country.
- About 10% of Asians who came for other reasons, such as educational, economic or family motives, say the same.
Jump to more details about Asian Americans’ immigration experiences.
Views of the U.S. compared with origin countries
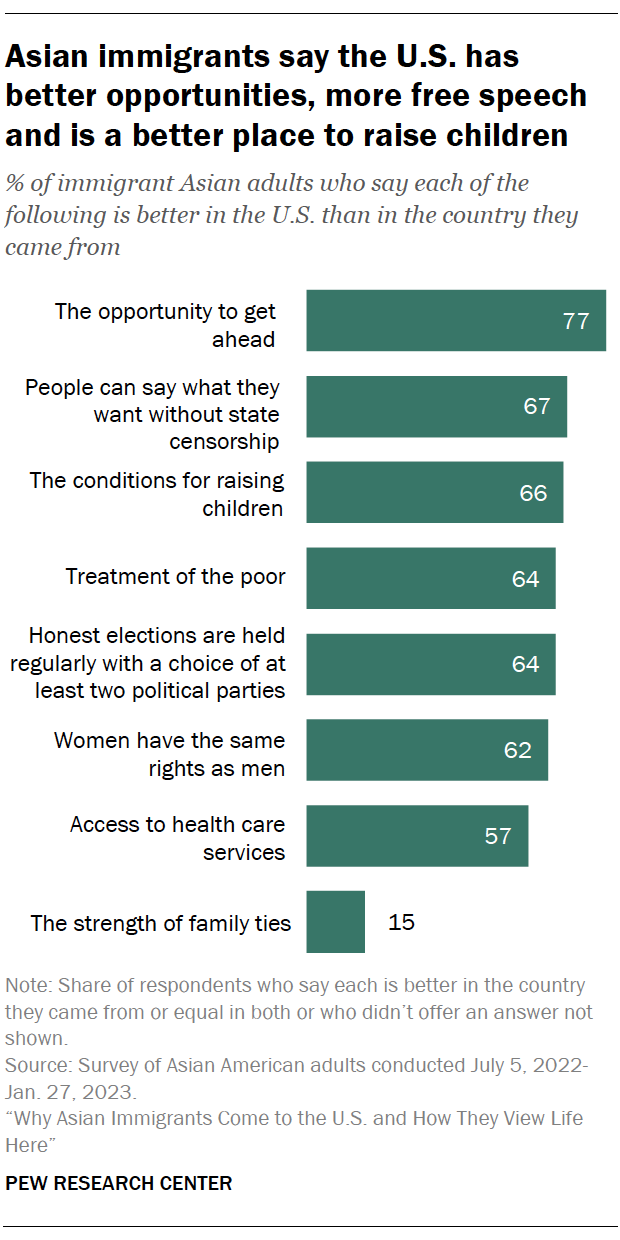
Overall, majorities of Asian immigrants see the U.S. as better than their origin country on nearly all measures asked about in the survey. Some of the qualities seen most positively about the U.S. include:
- 77% see the U.S. as better than their origin country for the opportunity to get ahead.
- 67% say the U.S. is better when it comes to freedom of speech.
- 66% say it is better for raising children.
But the U.S. is not universally seen as better: On the strength of family ties, only 15% of Asian immigrants say the U.S. is better than their origin countries. Instead, 60% say their origin country is better on this measure.
Jump to read more about how Asian immigrants compare the U.S. with their origin countries.
Asian immigrants’ priorities for U.S. immigration policy
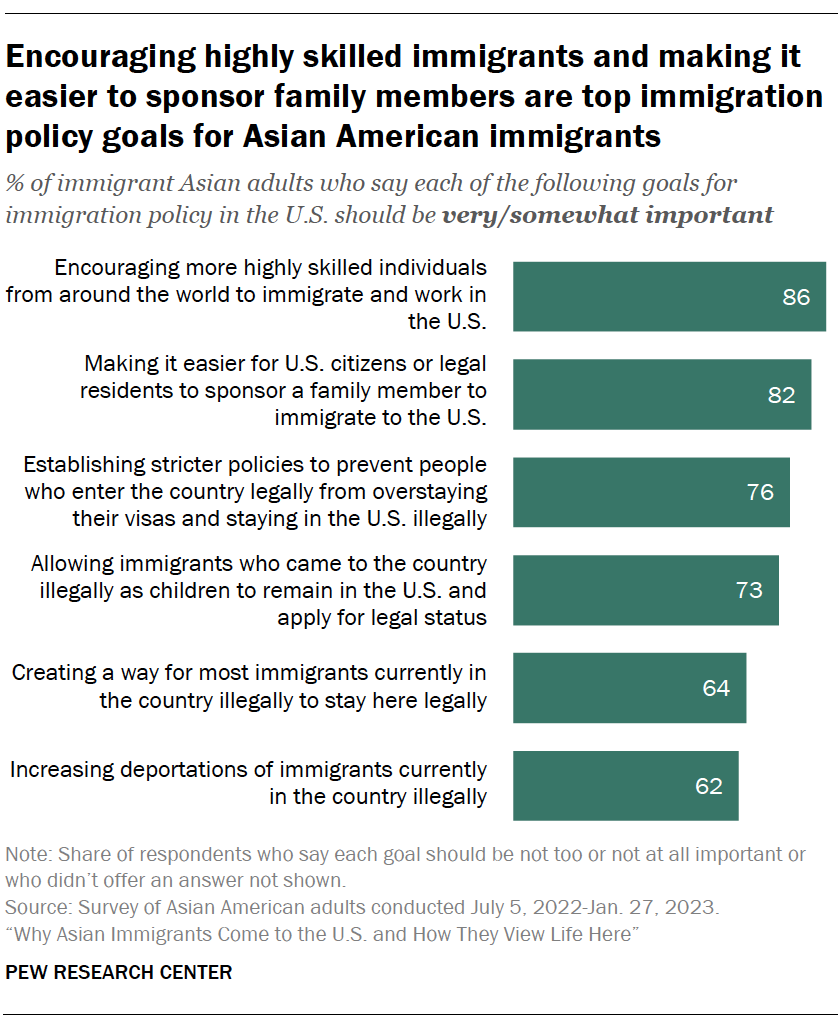
The survey – conducted from July 2022 to January 2023 – asked Asian Americans about their views on U.S. immigration policy goals.
Among Asian immigrants:
- 86% say attracting highly skilled immigrants to the U.S. should be an important goal for immigration policy.
- 82% say it is an important goal to make it easier for U.S. citizens or legal residents to sponsor a family member to immigrate to the U.S.
- 76% say establishing stricter policies to prevent people from overstaying their visas should be an important goal for U.S. policy.
Jump to more details about Asian Americans’ views of the U.S. immigration system.


