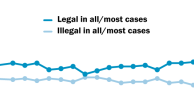
Abortion rises as an election issue for Latinos, with majority saying it should be legal in all or most cases
Pew Research Center conducted this study to understand the nuances of Hispanic political identity, Hispanics’ views about some of the political issues being discussed in the U.S. today, and their interest in the upcoming 2022 midterm elections.
For this analysis, we surveyed 7,647 U.S. adults, including 3,029 Hispanics, from Aug. 1-14, 2022. This includes 1,407 Hispanic adults on Pew Research Center’s American Trends Panel (ATP) and 1,622 Hispanic adults on Ipsos’ KnowledgePanel. Respondents on both panels are recruited through national, random sampling of residential addresses. Recruiting panelists by phone or mail ensures that nearly all U.S. adults have a chance of selection. This gives us confidence that any sample can represent the whole population, or in this case the whole U.S. Hispanic population. (See our “Methods 101” explainer on random sampling for more details.)
To further ensure the survey reflects a balanced cross-section of the nation’s Hispanic adults, the data is weighted to match the U.S. Hispanic adult population by age, gender, education, nativity, Hispanic origin group and other categories. Read more about the ATP’s methodology. Here are the questions used for our survey of Hispanic adults, along with responses, and its methodology.
The terms Hispanic and Latino are used interchangeably in this report.
The term U.S. born refers to people who are U.S. citizens at birth, including people born in the 50 U.S. states, the District of Columbia, Puerto Rico or other U.S. territories, as well as those born elsewhere to at least one parent who is a U.S. citizen.
The term foreign born refers to persons born outside of the United States to parents neither of whom was a U.S. citizen. The terms foreign born and immigrant are used interchangeably in this report.
Second generation refers to people born in the 50 states, the District of Columbia, Puerto Rico or other U.S. territories with at least one first-generation, or immigrant, parent.
Third or higher generation refers to people born in the 50 states, the District of Columbia, Puerto Rico or other U.S. territories with both parents born in the 50 states, the District of Columbia, Puerto Rico or other U.S. territories.
Language dominance is a composite measure based on self-described assessments of speaking and reading abilities. Spanish-dominant people are more proficient in Spanish than in English (i.e., they speak and read Spanish “very well” or “pretty well” but rate their English-speaking and reading ability lower). Bilingual refers to people who are proficient in both English and Spanish. English-dominant people are more proficient in English than in Spanish.
Respondents were asked a question about their voter registration status. In this report, respondents are considered a registered voter if they self-report being absolutely certain they are registered at their current address. Respondents are considered not registered to vote if they report not being registered or express uncertainty about their registration.
Democrat refers to respondents who identify politically with the Democratic Party. Republican refers to respondents who identify politically with the Republican Party. Ind/Other refers to respondents who identify politically as independent or something else.
Democrats and Democratic leaners refers to respondents who identify politically with the Democratic Party or who identify politically as independent or with some other party but lean toward the Democratic Party. Republicans and Republican leaners refers to respondents who identify politically with the Republican Party or who identify politically as independent or with some other party but lean toward the Republican Party.
The terms Republican party and GOP are used interchangeably in this report.
To create the upper-, middle- and lower-income tiers, respondents’ 2020 family incomes were adjusted for differences in purchasing power by geographic region and household size. Respondents were then placed into income tiers: “Middle income” is defined as two-thirds to double the median annual income for the entire survey sample. “Lower income” falls below that range, and “Upper income” lies above it. For more information about how the income tiers were created, read the methodology.
Nearly two years after former President Donald Trump won more Latino votes than he did in 2016, a new Pew Research Center survey of Latino adults finds that most say the Democratic Party cares about Latinos and works hard to earn their vote. Significantly fewer say the same of the Republican Party. At the same time, fewer than half of Latinos say they see a major difference between the parties, despite living in a deeply polarized era amid growing partisan hostility.
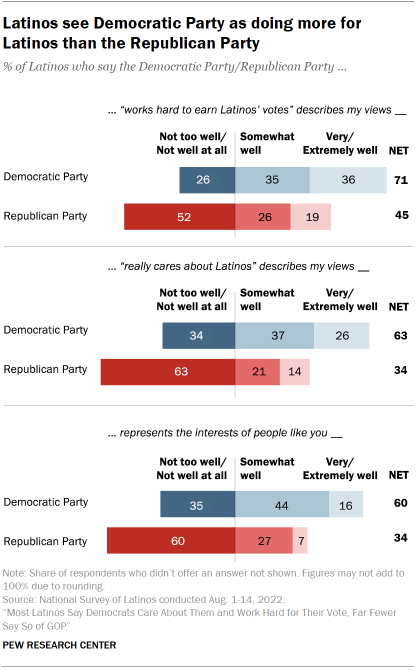
When it comes to the Democratic Party, the survey finds majorities of Latino adults express positive views of it. Some 71% say the Democratic Party works hard for Latinos’ votes, 63% say it “really cares about Latinos,” and 60% say the Democratic Party represents the interests of people like themselves. By contrast, shares of Latinos say the same of the Republican Party on each statement, though a somewhat greater share (45%) say that the GOP “works hard to earn the votes of Latinos.”
While the majority of Latinos have positive views of the Democratic Party, not all do. For example, about a third (34%) say the statement “the Democratic Party really cares about Latinos” does not describe their views well, and a similar share says the same about the statement “the Democratic Party represents the interests of people like you.”
Negative assessments extend to both parties. According to the survey, about one-in-five Latinos (22%) say neither of these statements describe their views well: “The Democratic Party really cares about Latinos” and “The Republican Party really cares about Latinos.”
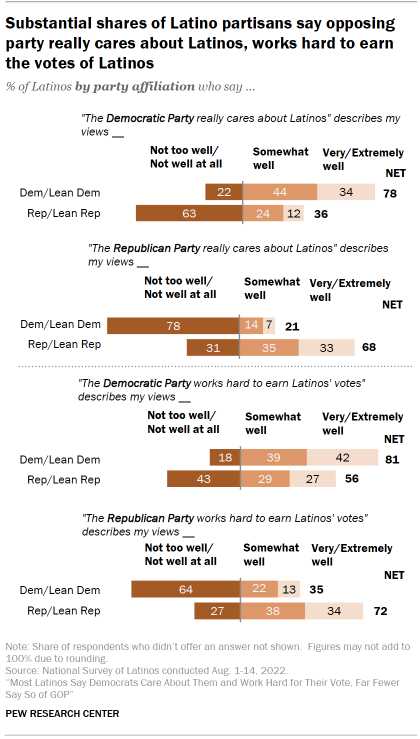
In addition, substantial minorities of Hispanic partisans say they have at least a somewhat favorable view of the opposing party on several measures, though sharp differences exist by party affiliation among Hispanics.
Roughly a third of Latino Republicans and GOP leaners (36%) say “the Democratic Party really cares about Latinos” describes their views at least somewhat well, while 21% of Latino Democrats and Democratic leaners say “the Republican Party really cares about Latinos” describes their views at least somewhat well.
Meanwhile, more than half of Hispanic Republicans and Republican leaners (56%) say “the Democratic Party works hard to earn Latinos’ votes” describes their views at least somewhat well, while about a third of Hispanic Democrats and Democratic leaners (35%) say “the Republican Party works hard to earn Latinos’ votes” describes their views at least somewhat well.
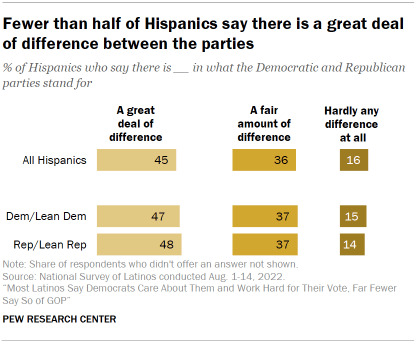
At the same time, about half of Hispanics do not see a great deal of difference between what the Democratic and Republican parties stand for, with 36% saying there is a fair amount of difference and 16% saying there is hardly any difference at all between the parties.
Meanwhile, 45% see a great deal of difference between the parties. About equal shares of Hispanic Democrats and Democratic leaners (47%) and Hispanic Republicans and Republican leaners (48%) say there is a great deal of difference between the parties.
These findings emerge from the 2022 National Survey of Latinos by Pew Research Center. The bilingual, nationally representative survey of 3,029 Latino adults was conducted online from Aug. 1-14, 2022. It explores Latinos’ views about U.S. political parties and key issues leading up to November’s midterm elections.
Latinos’ party affiliation has remained steady since 2019
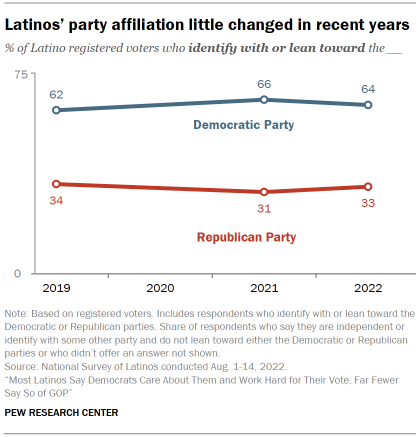
Latino registered voters identify with or lean toward the Democratic Party over the Republican Party by a nearly two-to-one margin (64% vs. 33% in this year’s survey), with Latino party identification shifting little over the past few years.
Even so, Latino registered voters’ future party affiliation remains uncertain. A 2021 Pew Research Center study of Americans’ political views found substantial shares of Latino voters fell into groups with soft ties to the political parties. For example, roughly one-in-ten Latino voters who identified as either a Democrat or Republican held political views that more closely aligned with the opposing party than with their own party.
2022 midterm elections and Latino voters
Latino voters are the nation’s second-largest group of eligible voters (adult U.S. citizens) and are among its fastest-growing voter blocks. In 2022, nearly 35 million Latinos will be eligible to vote, accounting for 14% of the nation’s eligible voters. The views of Latino voters have received widespread news coverage leading up to the 2022 midterm elections.1
Overall, 77% of Latino registered voters are dissatisfied with the way things are going in the country and 54% disapprove of the way Joe Biden is handling his job as president. Meanwhile, just 30% have given “a lot of thought” to this year’s congressional elections, with Latino Republicans and Republican leaners more likely than Latino Democrats and Democratic leaners to say this (36% vs. 27%). Yet equal shares of Latino Democrats and Democratic-leaning registered voters (60%) and Latino Republicans and GOP-leaning registered voters (60%) say it really matters who wins control of Congress.
Abortion rises as an election issue for Latino registered voters
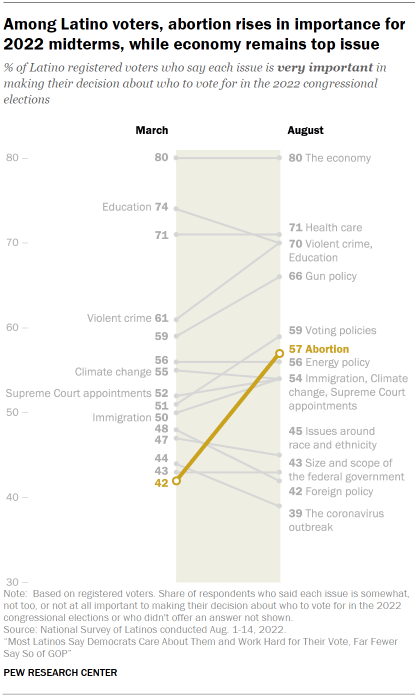
Among Latino registered voters in 2022, 80% say the economy is a very important issue when deciding who to vote for in the upcoming congressional midterm elections, a greater share than any other issue, and unchanged since March. Other top issues include health care (71%), violent crime and education (70% each) and gun policy (66%).
Meanwhile, abortion has risen the most in importance as a voting issue among Hispanics in recent months, a shift that comes after the Supreme Court’s decision to end the federal guarantee of a right to legal abortion in the United States. Nearly six-in-ten Hispanic voters (57%) say the issue is very important, up from 42% in March. This pattern is also seen among all U.S. registered voters, as abortion has risen in importance leading up to the 2022 midterm elections.
On other issues, slightly more than half of Hispanic voters say immigration, climate change and Supreme Court appointments are very important issues for deciding their vote in the 2022 congressional midterm elections.
2022 midterm election preferences of Latinos
The August 2022 survey finds about half of Latino registered voters (53%) say they would vote for or are leaning toward the Democratic candidate for the U.S. House of Representatives in their congressional district, compared with 28% who say they would vote for the Republican candidate. About one-in-five (18%) say they would vote for another candidate or are not sure who they would vote for.2
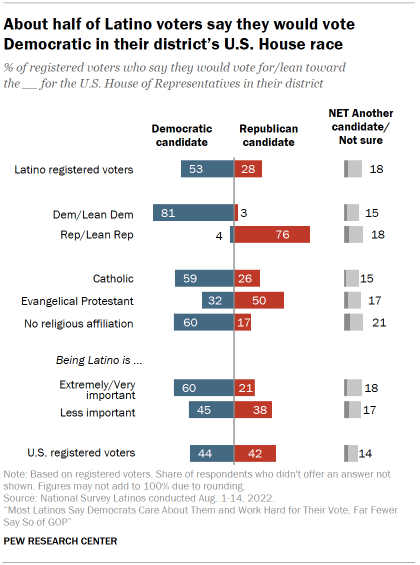
A majority of Hispanic Catholics (59%) and those who are religiously unaffiliated (60%) – those who describe themselves as atheists, agnostics or “nothing in particular” – say they would vote for the Democratic candidate for the U.S. House in their congressional district. By contrast, more Hispanic evangelical Christians say they would vote Republican than Democratic (50% vs. 32%).
The strength of Hispanic identity is also linked to how Hispanic registered voters would vote. Most Hispanics who say being Hispanic is extremely or very important to how they think of themselves (60%) would vote for the Democratic candidate in their local congressional district. Meanwhile, those who say being Hispanic is less important to their identity are more evenly split between voting for the Democratic and Republican candidates in their district’s House race (45% vs. 38%).
Latinos’ views of Biden
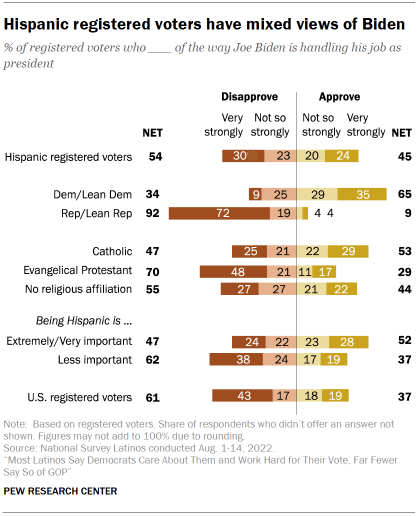
As the midterm elections approach, fewer than half of Latino registered voters (45%) say they approve of the way Biden is handling his job as president, while about half (54%) disapprove. U.S. registered voters overall have a more negative view of Biden (61% disapprove vs. 37% approve), according to the same August survey.3
Biden’s approval rating varies some across demographic subgroups of Hispanic registered voters. Hispanic Democrats hold largely positive views of Biden. Nearly two-thirds of Hispanic Democrats and Democratic leaners (65%) approve of the president’s job performance, but a substantial minority (34%) disapprove. By contrast, nearly all Hispanic Republicans and Republican leaners (92%) disapprove of Biden.
Among Latino registered voters, only 29% of evangelical Christians approve of Biden’s job performance, while a greater share of Latino Catholics (53%) and those with no religious affiliation (44%) say the same.
A greater share of Hispanic voters who say being Hispanic is important to how they think of themselves approve of Biden’s job performance than do Hispanics who say being Hispanic is less important to their identity (52% vs. 37%).
Latinos’ views of Trump’s future
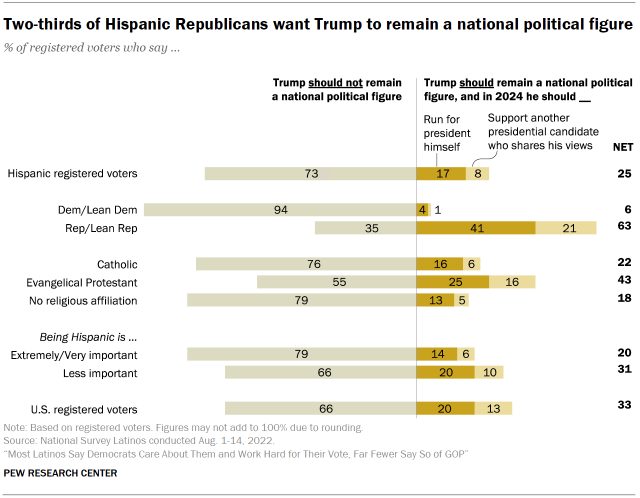
A clear majority of Hispanic registered voters (73%) say they would not like to see Trump remain a national political figure, including nearly all Latino Democrats and Democratic leaners (94%). By contrast, 63% of Hispanic Republicans and GOP leaners say they would like to see Trump remain a national political figure, including about four-in-ten (41%) who say he should run for president in 2024.
Among Latino registered voters, evangelicals (43%) are more likely than Catholics (22%) and those with no religious affiliation (18%) to say Trump should remain a national political figure. And a quarter of Latino evangelical registered voters say Trump should run for president in 2024.
Latinos’ views on racial discrimination
Since George Floyd’s killing in May 2020, the nation has gone through a sharp and deep discussion about race and equality, police funding and racial discrimination. And while racial discrimination is experienced by many Latinos directly – sometimes from non-Latinos, sometimes from other Latinos – views about how Americans identify and see racial discrimination are somewhat varied.
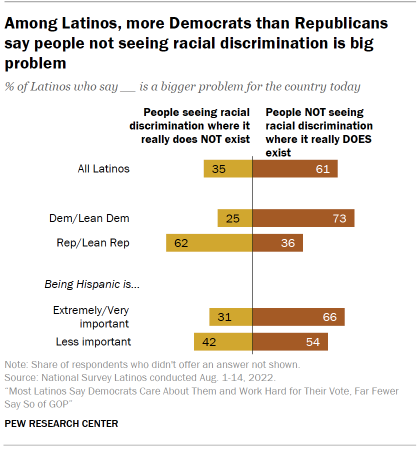
According to the new Center survey, most Latinos say people not seeing racial discrimination where it really does exist is a significant problem. A majority (61%) say it is a bigger problem for the country than people seeing racial discrimination where it really does not exist.4
Nearly three-quarters of Latino Democrats and Democratic leaners (73%) say people not seeing racial discrimination where it really does exist is a bigger problem. By contrast, about six-in-ten Republicans and Republican leaners (62%) say it is a bigger problem that people see racial discrimination where it really does not exist.
Meanwhile, two-thirds of Hispanics who say being Hispanic is important to how they think of themselves (66%) say people not seeing racial discrimination where it really does exist is a significant problem, a greater share than among Hispanics who say being Hispanic is less important to how the think of themselves (54%).
Latinos’ views on abortion, gun policy and LGBTQ rights
The survey finds that Latinos are divided along party lines on key social issues in ways similar to the U.S. public, though the views of Latinos are sometimes less polarized on key issues.
The Supreme Court has made major decisions on cases in recent months that resulted in restricted access to legal abortions and expanded rights to carry guns in public, the latter coming after high-profile mass shootings in Texas and New York.
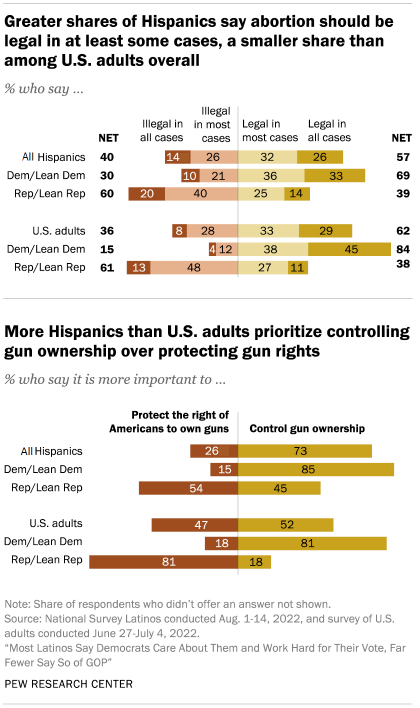
A majority of Hispanics (57%) say abortion should be legal in at least some cases, including 69% of Democrats and Democratic leaners who say the same. By contrast, 39% of Hispanic Republicans and GOP leaners say abortion should be legal in all or most cases.
Hispanics’ views on abortion differ from U.S. adults overall, particularly when comparing the views of Latinos and U.S. adults of the same party. Compared with Hispanics, a slightly greater share of U.S. adults (62%) say abortion should be legal in at least some cases. And a greater share of Democrats and Democratic leaners overall (84%) than Hispanic Democrats and Democratic leaners (69%) say abortion should generally be legal. Hispanic Republicans’ views on this issue are nearly identical to views among all Republicans and Republican leaners, 60% of whom say abortion should be illegal in all or most cases.
On gun policy, about seven-in-ten Hispanics (73%) say it is more important to control gun ownership; 26% say it’s more important to protect the right of Americans to own guns. Hispanic Democrats and Democratic leaners are about twice as likely as Hispanic Republicans and Republican leaners to prioritize controlling gun ownership over protecting the rights to own guns (85% vs. 45%).5
Compared with Hispanics, a smaller share of U.S. adults overall (52%) say it is more important to control gun ownership than to protect gun ownership rights. Hispanic Republicans and GOP leaners are considerably more likely than Republicans overall to say this (45% vs. 18%). Among Democrats and Democratic leaners, similar shares of Hispanics (85%) and U.S. adults overall (81%) say controlling gun ownership should be the priority.
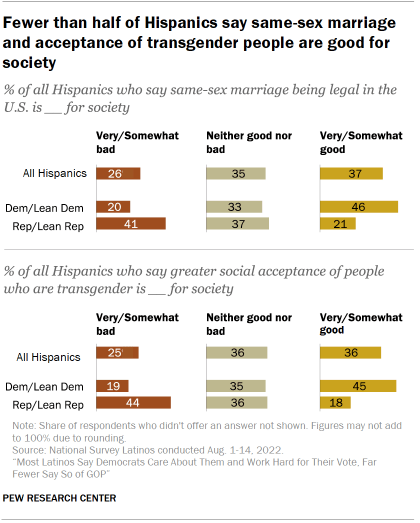
More than a third of Latinos (37%) say same-sex marriage being legal is good for society, while a similar share say it is neither good nor bad for society. Latino Democrats and Democratic leaners are more likely than Latino Republicans and Republican leaners to say same-sex marriage being legal is a good thing for society (46% vs. 21%). Hispanic Republicans are more likely than Hispanic Democrats to say it is a bad thing (41% vs. 20%). Meanwhile, about a third of Latinos from both parties say same-sex marriage is neither a good nor bad thing.6
Latinos’ views of greater social acceptance of transgender people follows a similar pattern: 36% of Latinos say it is somewhat or very good for society, including 45% of Democrats and Democratic leaners and 18% of Republicans and GOP leaners. About a third of Latinos from both parties say it is neither a good nor bad thing.
Hispanics’ views of socialism and capitalism
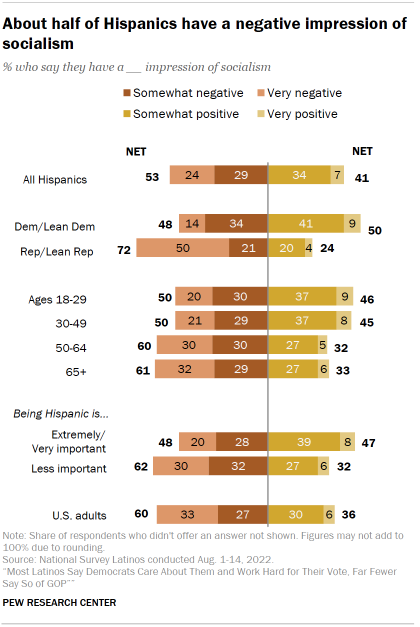
Some parts of the national Latino population have recent immigrant connections to countries that have socialist or communist governments (such as Cuba and Venezuela) or have had them (such as Chile and Nicaragua). In metropolitan areas such as Miami, political candidates’ views on socialism often became a prominent campaign issue in 2020. For those with a positive view of socialism, the word can take on a broader meaning and include U.S. government programs or democratic socialist governments such Denmark or Finland.
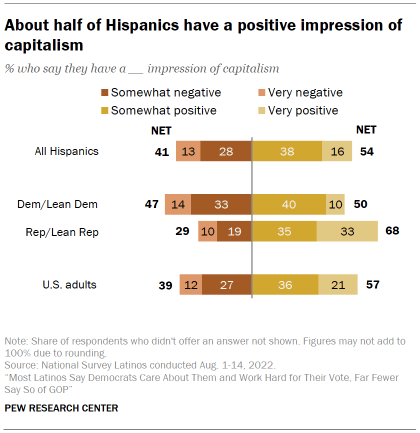
According to the new Center survey, a larger share of Hispanics have a negative than positive impression of socialism (53% vs. 41%). By contrast, Hispanics have a more positive than negative view of capitalism (54% vs. 41%).
When it comes to socialism, Hispanic Democrats and Democratic leaners are split on how they view socialism (48% negative vs. 50% positive). Meanwhile, Hispanic Republicans and Republican leaners have a more negative impression of socialism, with nearly three-quarters (72%) viewing socialism negatively.
Latinos ages 18 to 29 are more evenly divided in their views of socialism (46% positive vs. 50% negative), a pattern seen among all U.S. young people. While Latinos ages 30 to 49 are similarly divided, a majority of those ages 50 to 64 and those 65 or older say they see socialism negatively.
Hispanics who say being Hispanic is extremely or very important to how they think of themselves are evenly split in their views of socialism (47% positive and 48% negative). Hispanics who say being Hispanic is less important to how they think of themselves have a more negative view (62%).
By contrast, about two-thirds of Hispanic Republicans and Republican leaners (68%) have a positive view of capitalism, a greater share than among Hispanic Democrats and Democratic leaners (50%).
Hispanic adults and the U.S. public overall generally have similar views of capitalism. Majorities of Hispanics (54%) and U.S. adults (57%) have a positive impression of capitalism.
Latinos’ views of America’s standing in the world
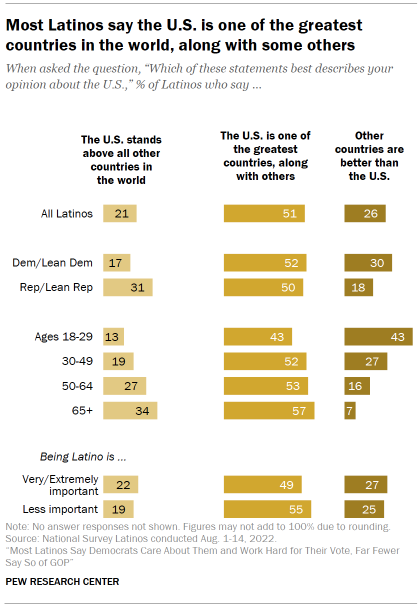
The vast majority of Hispanics say the U.S. is either one of the best countries the world (51%) or that the U.S. stands above all other countries in the world (21%). About a quarter of Hispanics (26%) say there are other countries that are better than the U.S. Hispanics have mostly similar views to U.S. adults overall on how America compares to other nations.
Latino Democrats and Democratic leaners are more likely than Latino Republicans and GOP leaners to say there are other countries that are better than the U.S. (30% vs. 18%). Meanwhile, a larger share of Latino Republicans than Latino Democrats say the U.S. stands above all other countries in the world (31% vs. 17%). Despite these differences, about half of both Latino Republicans (50%) and Latino Democrats (52%) choose the middle ground, saying that the U.S. is one of the greatest countries in the world along with some others.
About four-in-ten Hispanics ages 18 to 29 (43%) say other countries are better than the U.S., a greater share than among those ages 30 to 49 (27%), 50 to 64 (16%) and those ages 65 or older (7%). A similar pattern by age exists among all U.S. adults.


