Previous research has shown clear differences in the religious identity, beliefs and practices of people from different demographic groups. Young adults tend to be less religiously affiliated than older people. Women tend to be more religiously affiliated than men. There are far more Catholics among Latinos than among people from other racial and ethnic backgrounds. Unmarried people are much more likely than those who are married to be unaffiliated with a religion. And the Western region of the U.S. is home to many more unaffiliated people than are other geographic regions.
The 2014 Religious Landscape Study finds that all of these demographic differences remain visible in the U.S. today. Older people still identify with religious groups at a higher rate than younger people. Women still are more religiously affiliated than men. And married people are far more likely than single people to identify with a religion.
But the new study also finds that the major shifts underway in American religion are occurring across a wide variety of demographic groups. Whether they are nearing retirement or just entering adulthood, married or single, living in the West or the Bible Belt, Americans in virtually all demographic groups are significantly less likely to describe themselves as Christians and more likely to identify as religious “nones,” compared with seven years ago.
This chapter takes a detailed look at the religious composition of demographic groups in the U.S., highlighting the differences that continue to exist among people from various backgrounds, as well as the similar changes that are afoot among many demographic groups. The previous chapter assesses the same data from the opposite direction, examining the demographic composition of religious groups.
Religious Composition by Generational Cohort
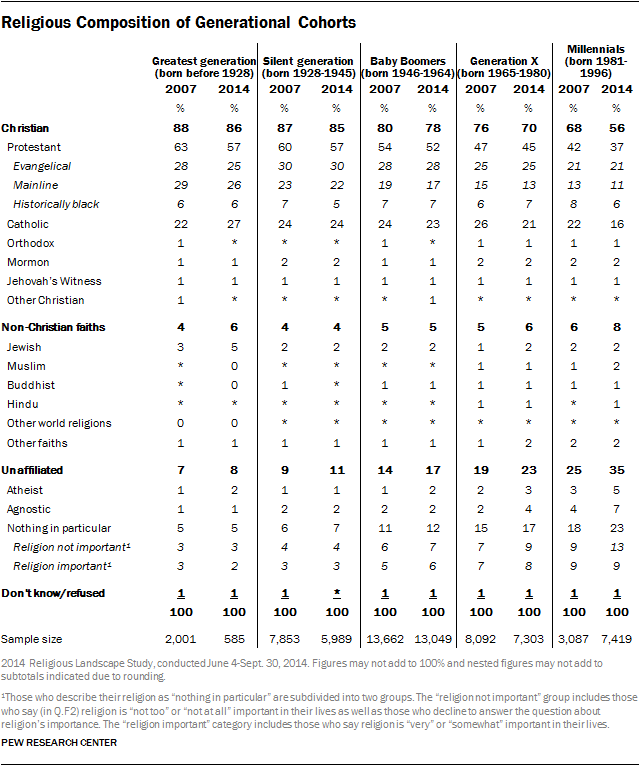
More than a third of adults in the Millennial generation (35%) now say they have no religion, up 10 points from 2007. Millennials have become more unaffiliated, both because large numbers of younger Millennials are entering adulthood with high levels of religious disaffiliation – 36% of those currently ages 18-24 are unaffiliated – and because older Millennials increasingly identify as religious “nones.” Roughly a third (34%) of older Millennials (now ages 25-33) identify as unaffiliated, up from 25% among this same cohort in 2007 (when they were 18-26). Just 56% of Millennial adults identify themselves as Christians, including 21% who identify with evangelical Protestantism, 16% with Catholicism and 11% with mainline Protestantism. By comparison, people in older generations are far more likely than Millennials to describe themselves as Christians and less likely to identify as religious “nones.”
But even older generations are growing less Christian over time. The share of people in Generation X who describe themselves as Christians, for instance, has dropped from 76% in 2007 to 70% today, while the unaffiliated share of Generation X has grown from 19% to 23%. The share of Christians among Baby Boomers and the Silent generation also ticked down slightly but noticeably in recent years, while the share of “nones” in these cohorts grew slightly.
Religious Composition of Racial and Ethnic Groups
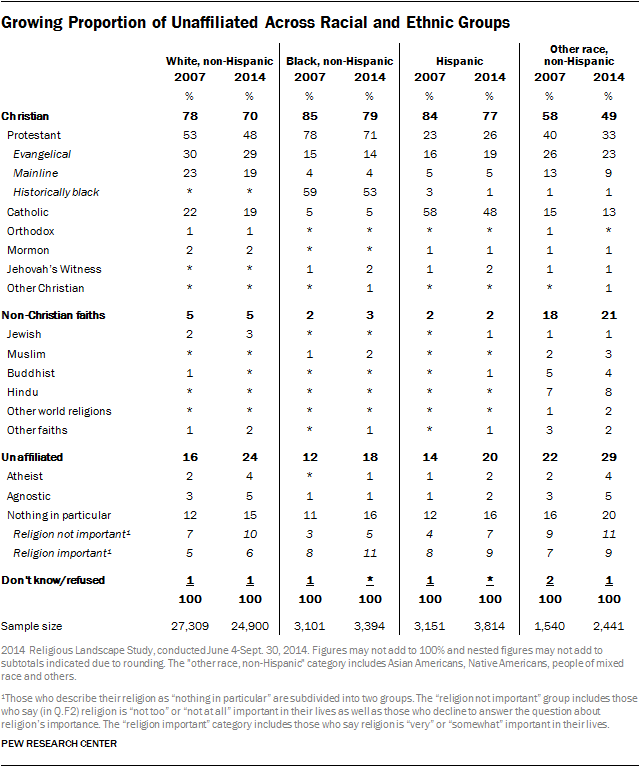
The unaffiliated have grown and Christians have declined as a share of all racial and ethnic groups. Whites, however, continue to be more likely than both blacks and Hispanics to say they have no religion (24% among whites compared with 20% among Hispanics and 18% among blacks).
Blacks stand out for their high levels of identification with Protestantism (71%), especially with denominations in the historically black Protestant tradition (53%). Hispanics continue to identify with Catholicism in larger numbers than other racial and ethnic groups. However, the Catholic share of the Hispanic population has declined dramatically in recent years, from 58% in the 2007 Religious Landscape Study to 48% today.
Among people from other racial and ethnic backgrounds (e.g., those who are Asian, Native American or mixed race, but not Hispanic), fully one-in-five (21%) identify with non-Christian faiths, including 8% who describe themselves as Hindus, 4% as Buddhists and 3% as Muslims.
Religious Composition of Immigrants
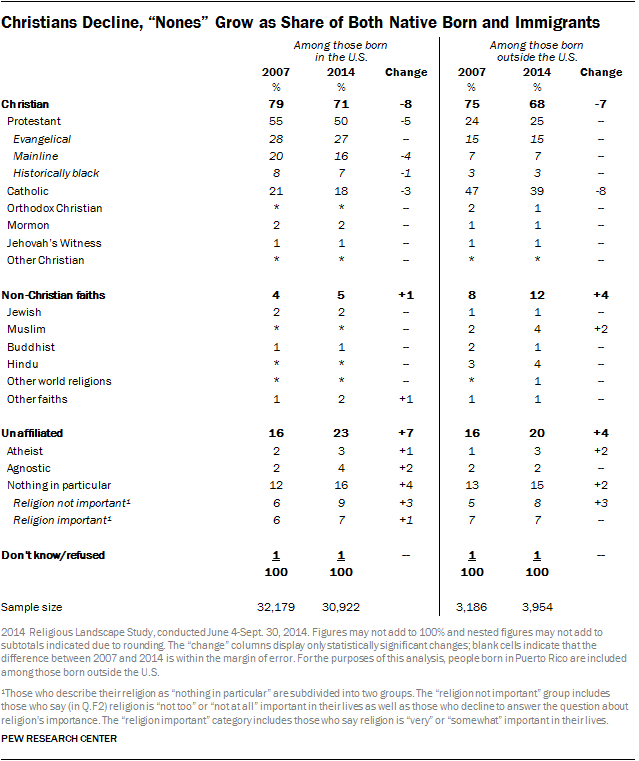
Roughly seven-in-ten U.S.-born adults identify themselves as Christians (71%), as do 68% of immigrants. The Christian share of each group, however, has slipped in recent years (by eight percentage points among the native born and seven points among immigrants), while the unaffiliated share has grown.
Among the native born, most Christians (50% of all native-born adults) continue to identify with Protestantism; most Christian immigrants (39% of all of those born outside the U.S.) identify as Catholics.
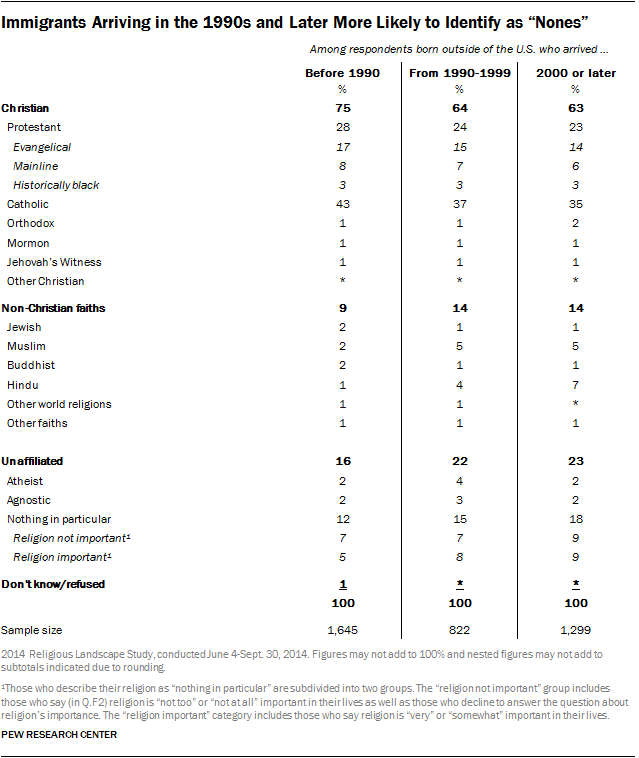
Compared with immigrants who have been in the United States for decades (i.e., since before 1990), immigrants who have arrived more recently are somewhat less likely to be Christian and more likely to identify with non-Christian faiths or with no religion. Three-quarters of immigrants who arrived in the U.S. before 1990 identify with Christianity, compared with 64% of those who arrived in the 1990s and 63% of those who arrived since 2000. More than one-in-five immigrants who came to the U.S. in 1990 or later are unaffiliated, and 14% identify with non-Christian faiths such as Islam or Hinduism.
Religious Composition by Educational Attainment
The share of Christians has declined since 2007 among both college graduates (by nine percentage points) and those with less than a college degree (by eight points), while the unaffiliated share has grown among both groups (by seven points among college graduates and six points among those with less education).
Roughly a quarter of college graduates describe themselves as religious “nones,” as do 22% of those with less than a college education. College graduates, however, are nearly twice as likely as those with less education to identity as atheist or agnostic (11% vs. 6%). College graduates also are significantly more likely than those with less education to identify with non-Christian faiths such as Judaism or Hinduism (11% vs. 4%).

Religious Composition by Income Level
Compared with 2007, there are smaller shares of self-identified Christians and more religious “nones” among Americans in every household income bracket, from those earning less than $30,000 per year to those earning $100,000 or more. As of 2014, the religiously unaffiliated make up a fifth or more of each income bracket, from 22% of those making less than $30,000 each year to 26% of those earning $100,000 or more annually. Compared with those at the low end of the income scale, those at the very top (i.e., people with household incomes of at least $100,000) are somewhat less likely to describe themselves as Christians and more likely to identify with non-Christian faiths or to be unaffiliated.

Religious Composition by Gender
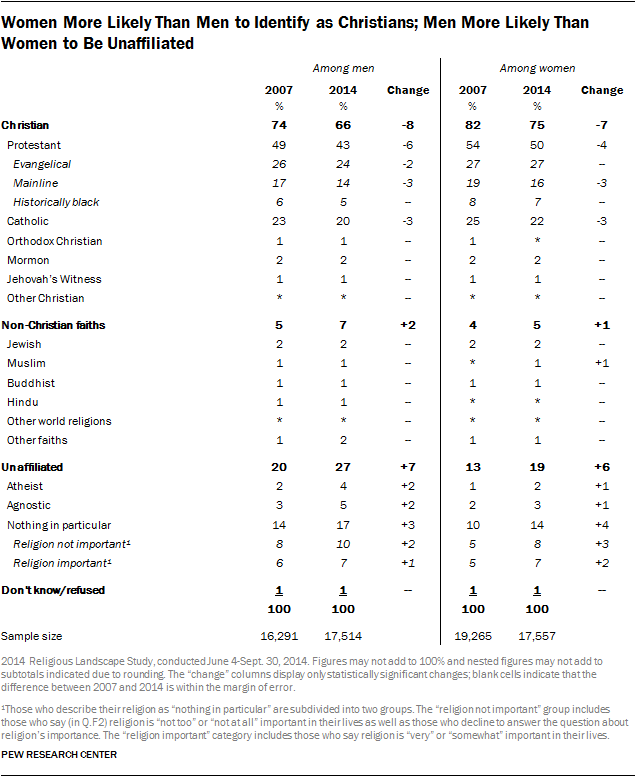
Women are far more likely than men to identify with Christian groups (75% vs. 66%). Men, by contrast, are more likely than women to describe themselves as religious “nones” (27% vs. 19%).
But both men and women have become less Christian and more unaffiliated since 2007, by roughly equal amounts. The share of men who identify with Christianity has shrunk by eight percentage points since 2007, and the share of self-identified Christians among women has declined by seven points. Meanwhile, the share of “nones” is up seven points among men and six points among women.
Religious Composition by Marital Status
Scholars have long recognized that religion and marriage are linked in important ways, with married people tending to be more religiously active than unmarried people. Princeton University sociologist Robert Wuthnow, for instance, has charted an overall decline in church attendance since the 1970s and attributes it to broader social trends like the postponement of marriage and parenthood by many young adults.23 And the rise of the religious “nones” in recent decades has coincided with a decline in marriage rates, with recent census data showing that the marriage rate in the U.S. now stands at a record low.
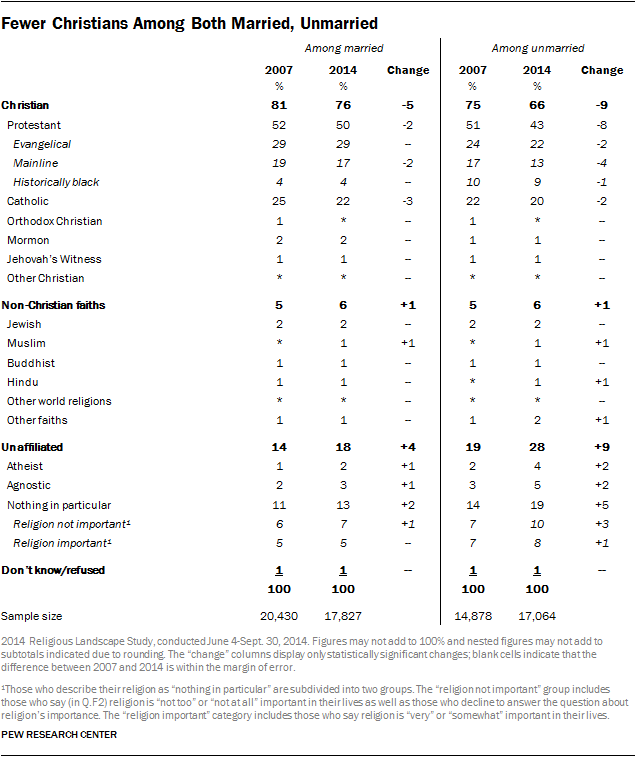
The 2014 Religious Landscape Study finds that unmarried people are far more likely than those who are married to be unaffiliated. It also shows, however, that both groups – those who are married and those who are not – have grown less religiously affiliated in recent years, though married people have done so more slowly. Among married adults, 18% now describe themselves as religious “nones,” up four points since 2007. More than a quarter of unmarried adults (28%) have no religious affiliation, up nine points in recent years.
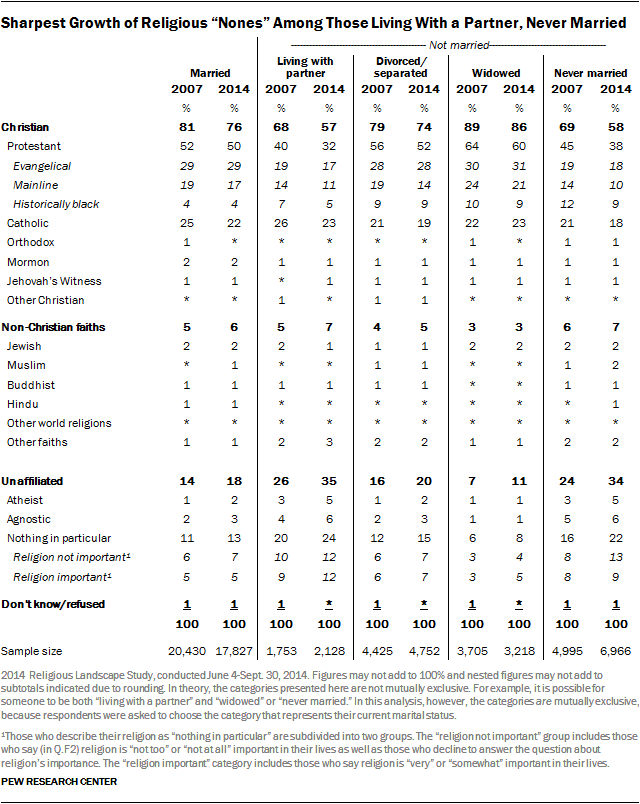
Within the broader category of unmarried U.S. adults, the growth of the religiously unaffiliated is especially evident among those who are living with a partner (26% were unaffiliated in 2007, compared with 35% today) and those who say they have never been married (24% vs. 34%). Both of these groups consist mostly of young people. Those who are divorced or separated and those who are widowed, two groups that consist mainly of older adults, have seen more modest increases in their shares of religious “nones.”24
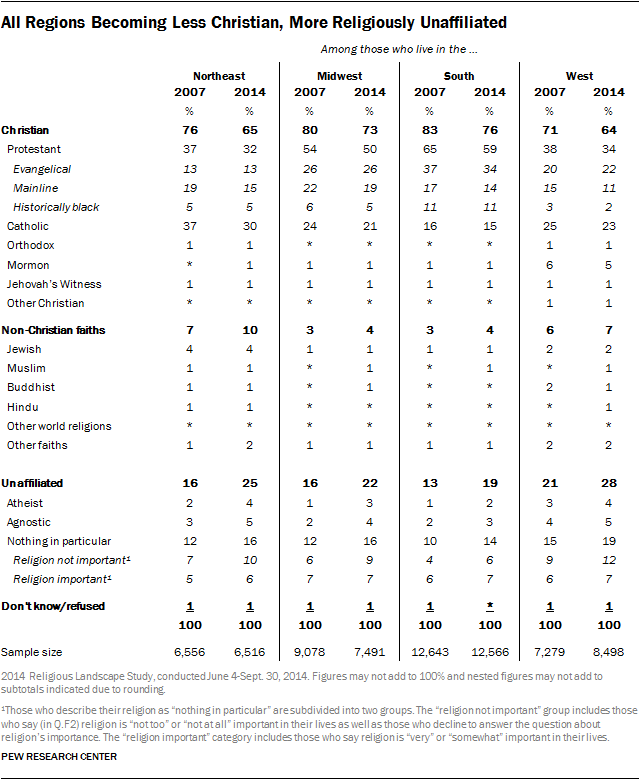
Religious Composition of Geographic Regions
As in 2007, the South continues to be the most heavily Christian region of the country; three-quarters of Southerners describe themselves as Christians, including 34% who identify with evangelical denominations. The Northeast is home to a greater share of Catholics than any other region (30%). And the West continues to have the largest share of people who are unaffiliated with any religion (28%).
Those three geographic regions, as well as the Midwest, all have experienced a decline in the share of Christians and a rise in the religiously unaffiliated since 2007. Perhaps the most dramatic changes have taken place in the Northeast, where the share of Christians overall is down 11 points (from 76% in 2007 to 65% today) and the share of Catholics is down seven points, from 37% to 30%. In the West, the unaffiliated now constitute the single largest tradition; 28% of those residing in the West are religiously unaffiliated, compared with 23% who are Catholics, 22% who are evangelical Protestants and 11% who identify with mainline Protestant denominations. Even the South has seen a six-point increase in the share of residents who are unaffiliated, from 13% in 2007 to 19% in 2014.
The Religious Landscape Study was designed to paint a religious portrait not just of the four major geographic regions, but also of every state and of the country’s largest metropolitan areas. Estimates of the composition of states and metro areas are available in the detailed tables in Appendix D as well as in the Religious Landscape Study interactive tool.
Religious Composition by Sexual Orientation
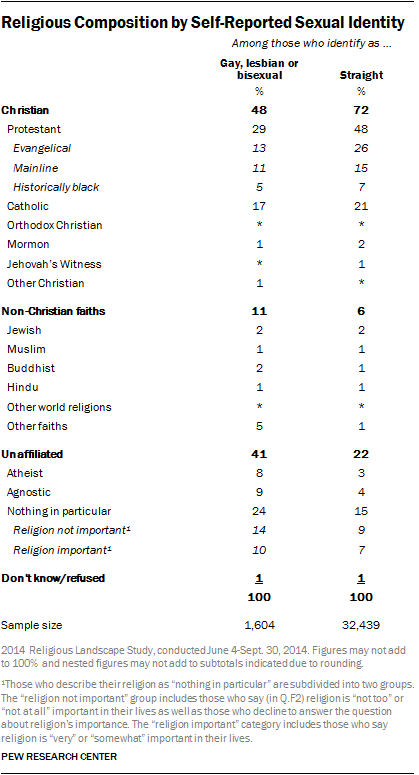
Among respondents who identify themselves as gay, lesbian or bisexual, fully 41% are religiously unaffiliated, and fewer than half (48%) describe themselves as Christians. Non-Christian faiths also are represented in the gay community at higher rates than among the general public, with 11% of gay, lesbian and bisexual respondents identifying with faiths other than Christianity.
These findings are broadly similar to results from the Pew Research Center’s 2013 survey of LGBT Americans. Different survey modes (the 2013 study was a self-administered survey whereas the 2014 Religious Landscape Study is an interviewer-administered survey) and questions used to identify gay, lesbian or bisexual respondents may explain small differences between the two surveys’ findings.
