For this report, we surveyed 4,718 U.S. adults who identify as Jewish, including 3,836 Jews by religion and 882 Jews of no religion. The survey was administered online and by mail by Westat, from Nov. 19, 2019, to June 3, 2020. Respondents were drawn from a national, stratified random sampling of residential mailing addresses, which included addresses from all 50 states and the District of Columbia. No lists of common Jewish names, membership rolls of Jewish organizations or other indicators of Jewishness were used to draw the initial sample.
We first sent letters to the sampled addresses asking an adult (18 or older) living in the household to take a short screening survey (“the screener”) either online or on a printed paper form, which they mailed back to us. The screener collected demographic characteristics and determined eligibility. In households with more than one adult resident, we selected the respondent randomly by some simple method, such as asking the person who most recently celebrated a birthday to fill out the screener.
A total of 68,398 people across the country completed the screener. Respondents who indicated in the screener that they are Jewish were asked to take a longer survey. Three criteria were used to determine eligibility for the extended survey: (1) if the responding adult said their current religion is Jewish; (2) if the responding adult did not identify their religion as Jewish but said that, aside from religion, they consider themselves to be Jewish in any way, such as ethnically, culturally or because of their family background; (3) if the responding adult did not identify with the first two criteria but said they were raised in the Jewish tradition or had a Jewish parent. All adults who reported any of these criteria were given the extended survey to complete.
However, this report focuses on the answers given in the extended survey by those who said their present religion is Jewish (Jews by religion), plus those who said they presently have no religion (they identify religiously as atheist, agnostic or nothing in particular) but who consider themselves Jewish aside from religion and have at least one Jewish parent or were raised Jewish (Jews of no religion). Together, these two groups comprise the net Jewish population, also referred to as U.S. Jews or Jewish Americans throughout the report.
In addition to the 4,718 respondents who were categorized as Jewish in these two ways, we also interviewed an additional 1,163 respondents who were determined to be eligible for the survey, but who ultimately were not categorized as Jewish for the purposes of this report. Some of these respondents indicated they have a Jewish parent or were raised Jewish but said they currently have a different religion (many are Christian) or do not consider themselves Jewish today in any way, either by religion or aside from religion. Others indicated that they do not have a Jewish parent, were not raised Jewish and do not identify with the Jewish religion, yet they do consider themselves Jewish in some way, such as because they are married to a Jewish person or are Christian and link Jesus with Judaism.
Both the full sample of all initial respondents (including those who were screened out as ineligible for the extended survey) and the sample of respondents to the extended survey were weighted to align with demographic benchmarks for the U.S. adult population from the Census Bureau as well as a set of modeled estimates for the religious and demographic composition of eligible adults within the larger U.S. adult population.
For more information, see the Methodology. The Methodology also contains detailed information on margins of sampling error and other potential sources of bias. Statistical significance is measured in this report at a 95% confidence level using standard tests and taking into account the effects of a complex sampling design. The questions used in this analysis can be found here.
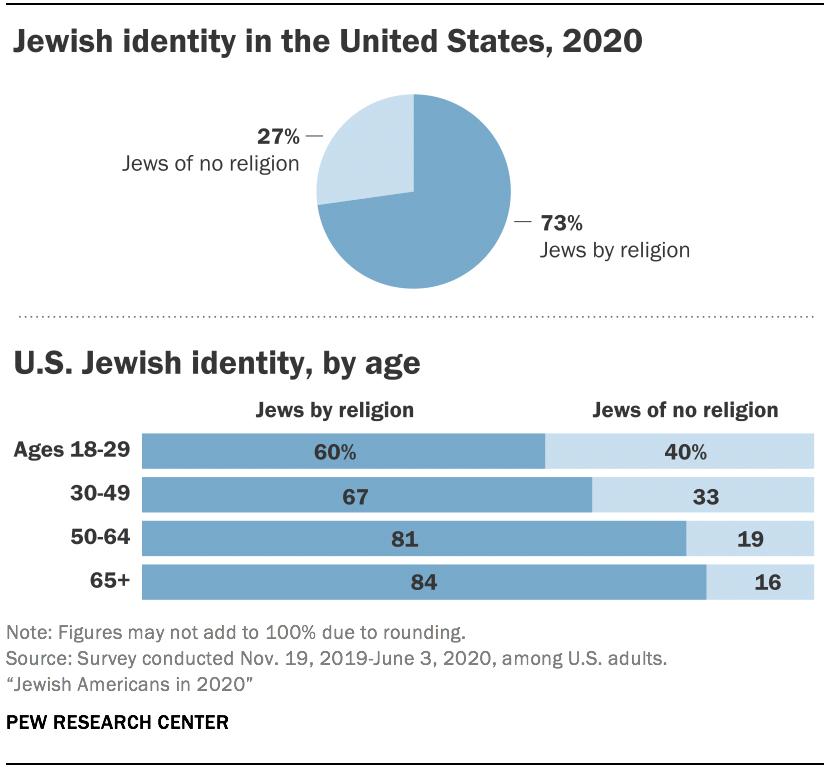
What does it mean to be Jewish in America? A new Pew Research Center survey finds that many Jewish Americans participate, at least occasionally, both in some traditional religious practices – like going to a synagogue or fasting on Yom Kippur – and in some Jewish cultural activities, like making potato latkes, watching Israeli movies or reading Jewish news online. Among young Jewish adults, however, two sharply divergent expressions of Jewishness appear to be gaining ground – one involving religion deeply enmeshed in every aspect of life, and the other involving little or no religion at all.
Overall, about a quarter of U.S. Jewish adults (27%) do not identify with the Jewish religion: They consider themselves to be Jewish ethnically, culturally or by family background and have a Jewish parent or were raised Jewish, but they answer a question about their current religion by describing themselves as atheist, agnostic or “nothing in particular” rather than as Jewish. Among Jewish adults under 30, four-in-ten describe themselves this way.
At the same time, younger Jewish adults are much more likely than older Jews to identify as Orthodox. Among Jews ages 18 to 29, 17% self-identify as Orthodox, compared with just 3% of Jews 65 and older. And fully one-in-ten U.S. Jewish adults under the age of 30 are Haredim, or ultra-Orthodox (11%), compared with 1% of Jews 65 and older.
Meanwhile, the two branches of Judaism that long predominated in the U.S. have less of a hold on young Jews than on their elders. Roughly four-in-ten Jewish adults under 30 identify with either Reform (29%) or Conservative Judaism (8%), compared with seven-in-ten Jews ages 65 and older.
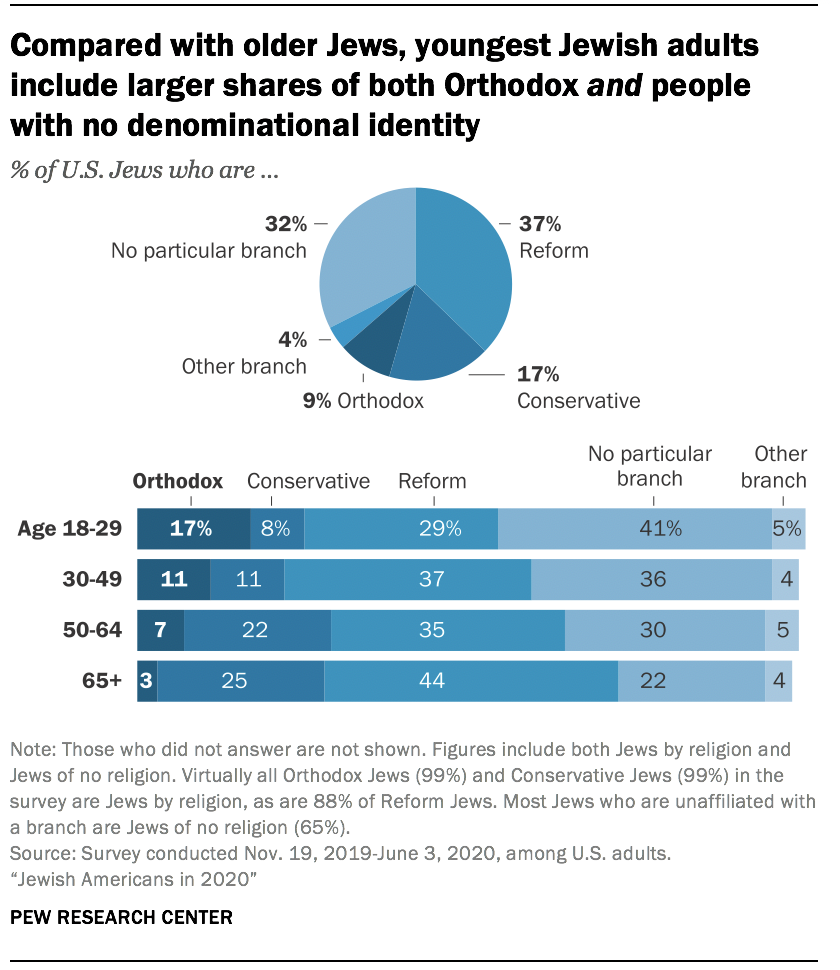
In other words, the youngest U.S. Jews count among their ranks both a relatively large share of traditionally observant, Orthodox Jews and an even larger group of people who see themselves as Jewish for cultural, ethnic or family reasons but do not identify with Judaism – as a religion – at all. Many people in both groups participate, at least sometimes, in the same cultural activities, such as cooking traditional Jewish foods, visiting Jewish historical sites and listening to Jewish or Israeli music. Yet the survey finds that most people in the latter group (Jews of no religion) feel they have not much or nothing at all in common with the former group (Orthodox Jews).
There were some signs of this divergence in Pew Research Center’s previous survey of Jewish Americans, conducted in 2013. But it is especially evident in the 2020 survey, conducted during a polarizing election campaign.
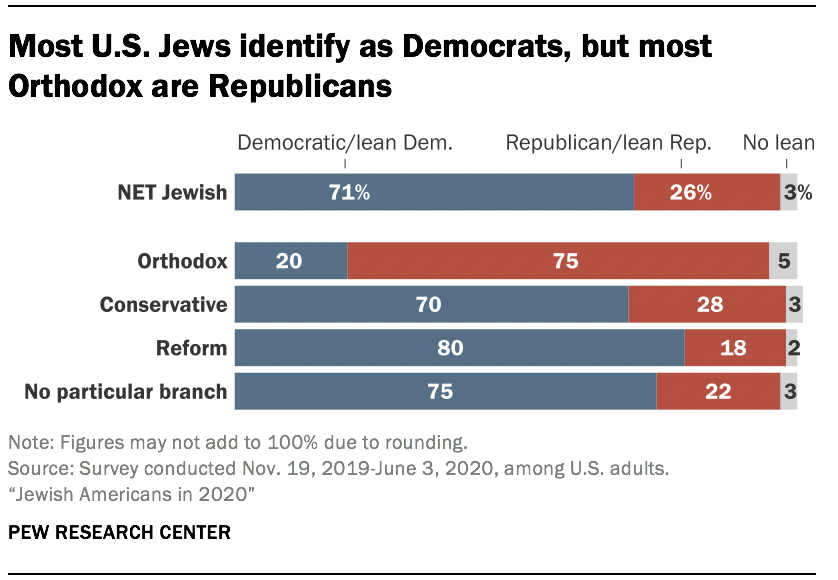
Politically, U.S. Jews on the whole tilt strongly liberal and tend to support the Democratic Party. When the new survey was fielded, from late fall 2019 through late spring 2020, 71% said they were Democrats or leaned Democratic. Among Jews of no religion, roughly three-quarters were Democrats or leaned that way. But Orthodox Jews have been trending in the opposite direction, becoming as solidly Republican as non-Orthodox Jews are solidly Democratic. In the run-up to the 2020 presidential election, 75% of Orthodox Jews said they were Republicans or leaned Republican, compared with 57% in 2013. And 86% of Orthodox Jews rated then-President Donald Trump’s handling of policy toward Israel as “excellent” or “good,” while a majority of all U.S. Jews described it as “only fair” or “poor.”
While these generational shifts toward both Orthodoxy and secular Jewishness have the potential, in time, to reshape American Jewry, the new survey paints a portrait of Jewish Americans in 2020 that is not dramatically different from 2013. Counting all Jewish adults – young and old, combined – the percentages who identify as Orthodox, Conservative and Reform are little changed. The size of the adult Jewish population is also remarkably stable in percentage terms, while rising in absolute numbers, roughly in line with the total U.S. population.
Pew Research Center estimates that as of 2020, 2.4% of U.S. adults are Jewish, including 1.7% who identify with the Jewish religion and 0.6% who are Jews of no religion. By comparison, the 2013 estimate for “net Jews” was 2.2%, including 1.8% who were Jews by religion and 0.5% who were Jews of no religion. (These figures are rounded to one decimal. Given the expected range of precision for two surveys of this size and complexity, it is safer to say that the adult Jewish population has roughly kept pace with change in the U.S. population than to focus on small differences in the 2013 and 2020 incidence rates.)
In absolute numbers, the 2020 Jewish population estimate is approximately 7.5 million, including 5.8 million adults and 1.8 million children (rounded to the closest 100,000). The 2013 estimate was 6.7 million, including 5.3 million adults and 1.3 million children. The precision of these population estimates should not be exaggerated; they are derived from a sample of the U.S. public that is very large compared with most surveys (more than 68,000 interviews) but are still subject to sampling error and other practical difficulties that produce uncertainty. Furthermore, the size of the Jewish population greatly depends on one’s definition of who counts as Jewish. For more details on the 2020 population estimates, including alternative definitions of Jewishness, see Chapter 1.
The new survey continues to find that Jewish Americans, on average, are older, have higher levels of education, earn higher incomes, and are more geographically concentrated in the Northeast than Americans overall. There is also evidence that the U.S. Jewish population is becoming more racially and ethnically diverse. Overall, 92% of Jewish adults identify as White (non-Hispanic), and 8% identify with all other categories combined. But among Jews ages 18 to 29, that figure rises to 15%. Already, 17% of U.S. Jews surveyed live in households in which at least one child or adult is Black, Hispanic, Asian, some other (non-White) race or ethnicity, or multiracial.1
Although in many ways the U.S. Jewish population is flourishing, concerns about anti-Semitism have risen among American Jews. Three-quarters say there is more anti-Semitism in the United States than there was five years ago, and just over half (53%) say that “as a Jewish person in the United States” they feel less safe than they did five years ago. Jews who wear distinctively religious attire, such as a kippa or head covering, are particularly likely to say they feel less safe. But the impact on behavior seems to be limited: Even among those who feel less safe, just one-in-ten – or 5% of all U.S. Jews – report that they have stayed away from a Jewish event or observance as a result.
These are among the key findings of Pew Research Center’s new survey of U.S. Jews, conducted from Nov. 19, 2019, to June 3, 2020, among 4,718 Jews across the country who were identified through 68,398 completed screening interviews conducted by mail and online.
Comparisons between the new survey and the 2013 survey of Jewish Americans are complicated by a host of methodological differences. At the time the 2013 study was conducted, it used the best available methods for selecting a random, representative sample of Jews across the United States: dialing randomly generated telephone numbers and having live interviewers (real people, not recorded voices) ask a series of screening questions to identify respondents who consider themselves Jewish. By 2020, however, response rates to telephone surveys had declined so precipitously that random-digit dialing by telephone was no longer the best way to conduct a large, nationwide survey of a small subgroup of the U.S. public.
Instead, we sent letters to randomly selected residential addresses across the country, asking the recipients to go online to take a short screening survey. We also provided the option to fill out the survey on a paper form and return it by mail, so as not to limit the survey only to people who have access to the internet and are comfortable using it. These methods obtained a response rate (17%) similar to the 2013 survey’s (16%) and much higher than what telephone surveys now typically obtain (approximately 5%).
But, because of the differences between the ways the two surveys were conducted, this report is cautious about making direct comparisons of results on individual questions. For more information on how the new survey was conducted, see the Methodology. For guidance on whether 2020 survey questions can be compared with similar questions in the 2013 survey, see Appendix B.
Because the 2020 Pew Research Center survey of U.S. Jews was conducted by mail and online, the results on many questions are not directly comparable with the Center’s 2013 survey, which was conducted by telephone.
Years of research on survey methods shows that people tend to answer some questions differently when they are responding to a live interviewer on a telephone than when they are providing written answers in privacy, either online or on paper. Social scientists believe the differences are caused by a variety of factors, often including an unconscious tendency to give socially desirable answers when talking to another person.
However, not all survey questions are subject to this “social desirability bias.” To examine the impact of the methodological differences between the 2013 and 2020 surveys, Pew Research Center conducted an experiment with a separate group of 2,290 Jewish respondents, randomly assigning some to be interviewed by phone and others to answer the same questions online.
This experiment was not part of the actual survey; none of the experiment’s participants are counted as respondents in the main survey. But we have used the findings to help assess whether differences between the 2013 and 2020 results on particular questions represent real changes in the views of Jewish Americans over that seven-year period or, on the contrary, may just reflect the different “modes” (live interviewer vs. self-administered) in which the two surveys were conducted.
The mode experiment indicates that several questions about Jewish religious observance are subject to substantial social desirability bias in telephone polls. For example, the share of respondents who say they attend synagogue services at least monthly was 11 percentage points higher among those speaking with a live interviewer by telephone than among those responding on the web or by mail, in line with a pattern among Americans as a whole. The experiment also found differences in the way respondents answered questions about the importance of “being Jewish” and of religion in their lives. In addition, social desirability bias seems to affect the way U.S. Jews answer some questions about Israel, including how emotionally attached they feel toward the Jewish state.
Moreover, these “mode effects” are not the only potentially important difference between the two studies. They also used different strategies to sample Jews. It’s possible that the 2020 web/mail survey may not have been as effective as the 2013 phone survey at reaching segments of the Jewish population who are uncomfortable with going online or lack access to the Internet, while the new survey might have been more effective at reaching tech-savvy groups like young people. Even though all eligible respondents had an opportunity to complete the 2020 survey questionnaire on paper and return it in a postage-paid envelope, this might not have overcome the initial reluctance of some people – such as older Orthodox adults – to participate online. Whether this is actually the case or not is very difficult to determine, but it should be acknowledged as a possibility.
Bearing all these methodological differences in mind, Pew Research Center generally advises against comparing specific numbers or percentage-point estimates from the 2013 and 2020 surveys and assuming that any differences represent real change over a seven-year period.
A few exceptions are noted, where relevant, in this report. For example, there appears to be little or no difference in the way Jewish Americans describe their institutional branch or stream of Judaism (e.g., Orthodox, Conservative, Reform, etc.) when speaking on the telephone versus answering online or by mail.
For more information on the mode experiment, see Appendix B.
Branches of American Judaism
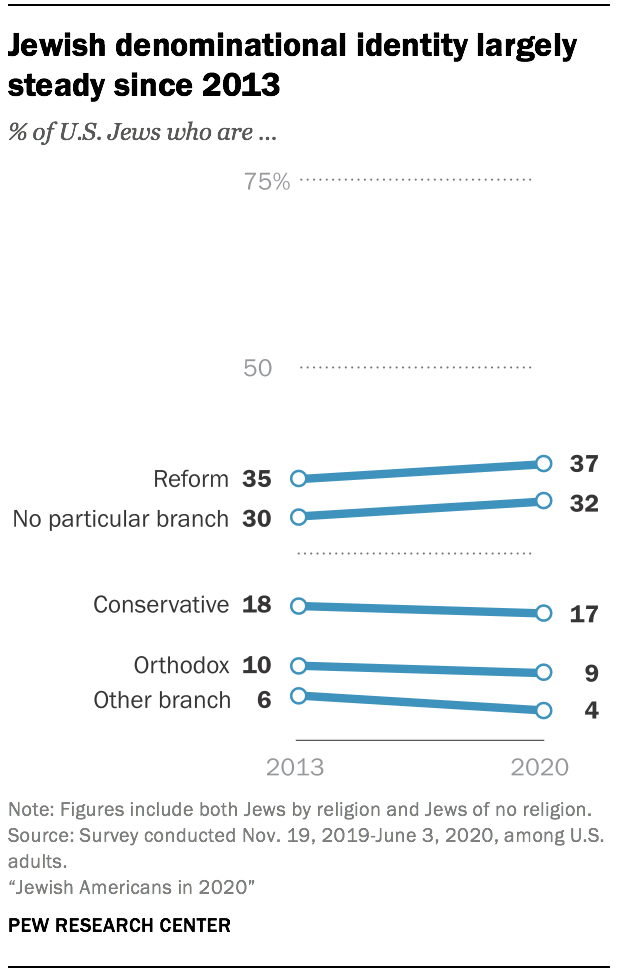
The 2020 survey finds that slightly over half of all U.S. Jews (54%) belong to the two long-dominant branches of American Judaism: 37% identify as Reform and 17% as Conservative. Those figures are essentially unchanged from 2013, when a total of 54% identified with either the Reform movement (35%) or Conservative Judaism (18%).2
The share of all Jewish adults who describe themselves as Orthodox is also about the same in 2020 (9%) as it was in 2013 (10%). Other branches, such as the Reconstructionist movement and Humanistic Judaism, total about 4%, very similar to in 2013 (6%). And the share of Jewish adults who do not identify with any particular stream or institutional branch of Judaism is now 32%, roughly on par with the 2013 survey (30%).
In broad strokes, the characteristics of these groups also are similar in 2020 to what they were in 2013. On average, the Orthodox are the most traditionally observant and emotionally attached to Israel; they tend to be politically conservative, with large families, very low rates of religious intermarriage and a young median age (35 years).3
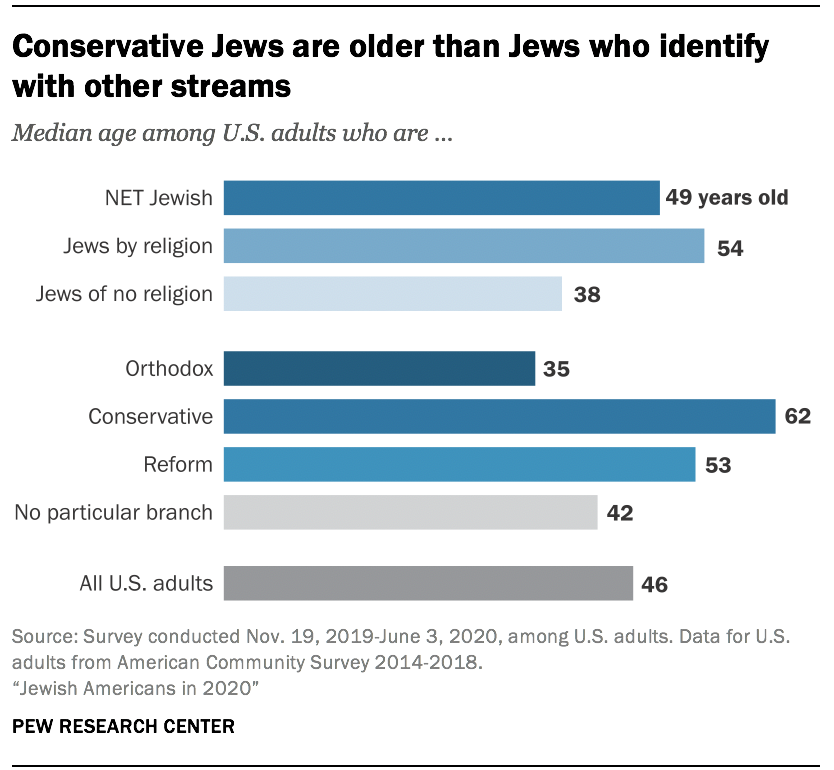
Conservative and Reform Jews tend to be less religiously observant in traditional ways, like keeping kosher and regularly attending religious services, but many in these groups participate in Jewish cultural activities, and most are at least somewhat attached to Israel. Demographically, they have high levels of education, small families, higher rates of intermarriage than the Orthodox and an older age profile (median age of 62 for Conservative, 53 for Reform).
There is a fair amount of overlap – though it is far from complete – between the 32% of Jewish adults who do not consider themselves members of any branch or denomination of American Judaism and the 27% who are categorized as “Jews of no religion.”4 Survey respondents who say their religion is Jewish are categorized as “Jews by religion” no matter what their branch identity or levels of observance. Those who describe their religion as atheist, agnostic or nothing in particular but who have a Jewish parent or were raised Jewish and say that aside from religion they consider themselves Jewish in some way – such as ethnically, culturally or because of their family background – are also fully included in the Jewish population throughout this report. Survey researchers call them Jews of “no religion” because they do not identify with Judaism or any other religion.5
As in 2013, Jews of no religion stand out in 2020 for low levels of religious participation – particularly synagogue membership and attendance – together with comparatively weak attachments to Israel, feelings of belonging to the Jewish people and engagement in communal Jewish life. They tend to be politically liberal and highly educated, with relatively high rates of intermarriage and a low median age (38 years).
One way to illustrate the divergence between Jews at opposite ends of the religious spectrum is to widen the lens and look at religion in the United States more broadly. Orthodox Jews are among the most highly religious groups in U.S. society in terms of the share who say religion is very important in their lives (86%) – along with Black Protestants (78%) and White evangelicals (76%). Jews of no religion are among the country’s least religious subgroups – even more inclined than unaffiliated U.S. adults (sometimes called “nones”) to say that religion is “not too important” or “not at all important” to them (91% vs. 82%).6
This 2020 Pew Research Center survey takes the same basic approach to defining Jewishness among U.S. adults and uses the same categories that the Center’s 2013 survey did.
As the earlier report explained, “Who is a Jew?” is an ancient question with no single, timeless answer. It is clear from questions in the survey itself that some Jews view Jewishness mainly as a matter of religion, while others see it as a matter of culture, ancestry or some combination of all three traits. Consequently, we sought to cast a wide net, using a screening questionnaire (“the screener”) to determine if respondents consider themselves Jewish in any of those ways.
In 2013, one of the screening questions asked:
Aside from religion, do you consider yourself Jewish or partially Jewish?
On the recommendation of a panel of academic advisers, researchers modified that question in 2020 to say:
Aside from religion, do you consider yourself to be Jewish in any way (for example, ethnically, culturally or because of your family’s background)?
Questions about the respondent’s spouse and other household members were modified similarly.
Respondents were deemed eligible to take the full, longer survey if they indicated any of the following: (a) their religion is Jewish; or (b) aside from religion, they consider themselves Jewish in any way; or (c) they had a Jewish parent or were raised Jewish.
For the purposes of analysis in this report, however, the definition of Jewishness is narrower. The main categories are:
Jews by religion – people who say their religion is Jewish and who do not profess any other religion
Jews of no religion – people who describe themselves (religiously) as atheist, agnostic or nothing in particular, but who have a Jewish parent or were raised Jewish, and who still consider themselves Jewish in any way (such as ethnically, culturally or because of their family background)
These two groups together comprise the total or “net” Jewish population – also referred to as U.S. Jews or Jewish Americans throughout this report.
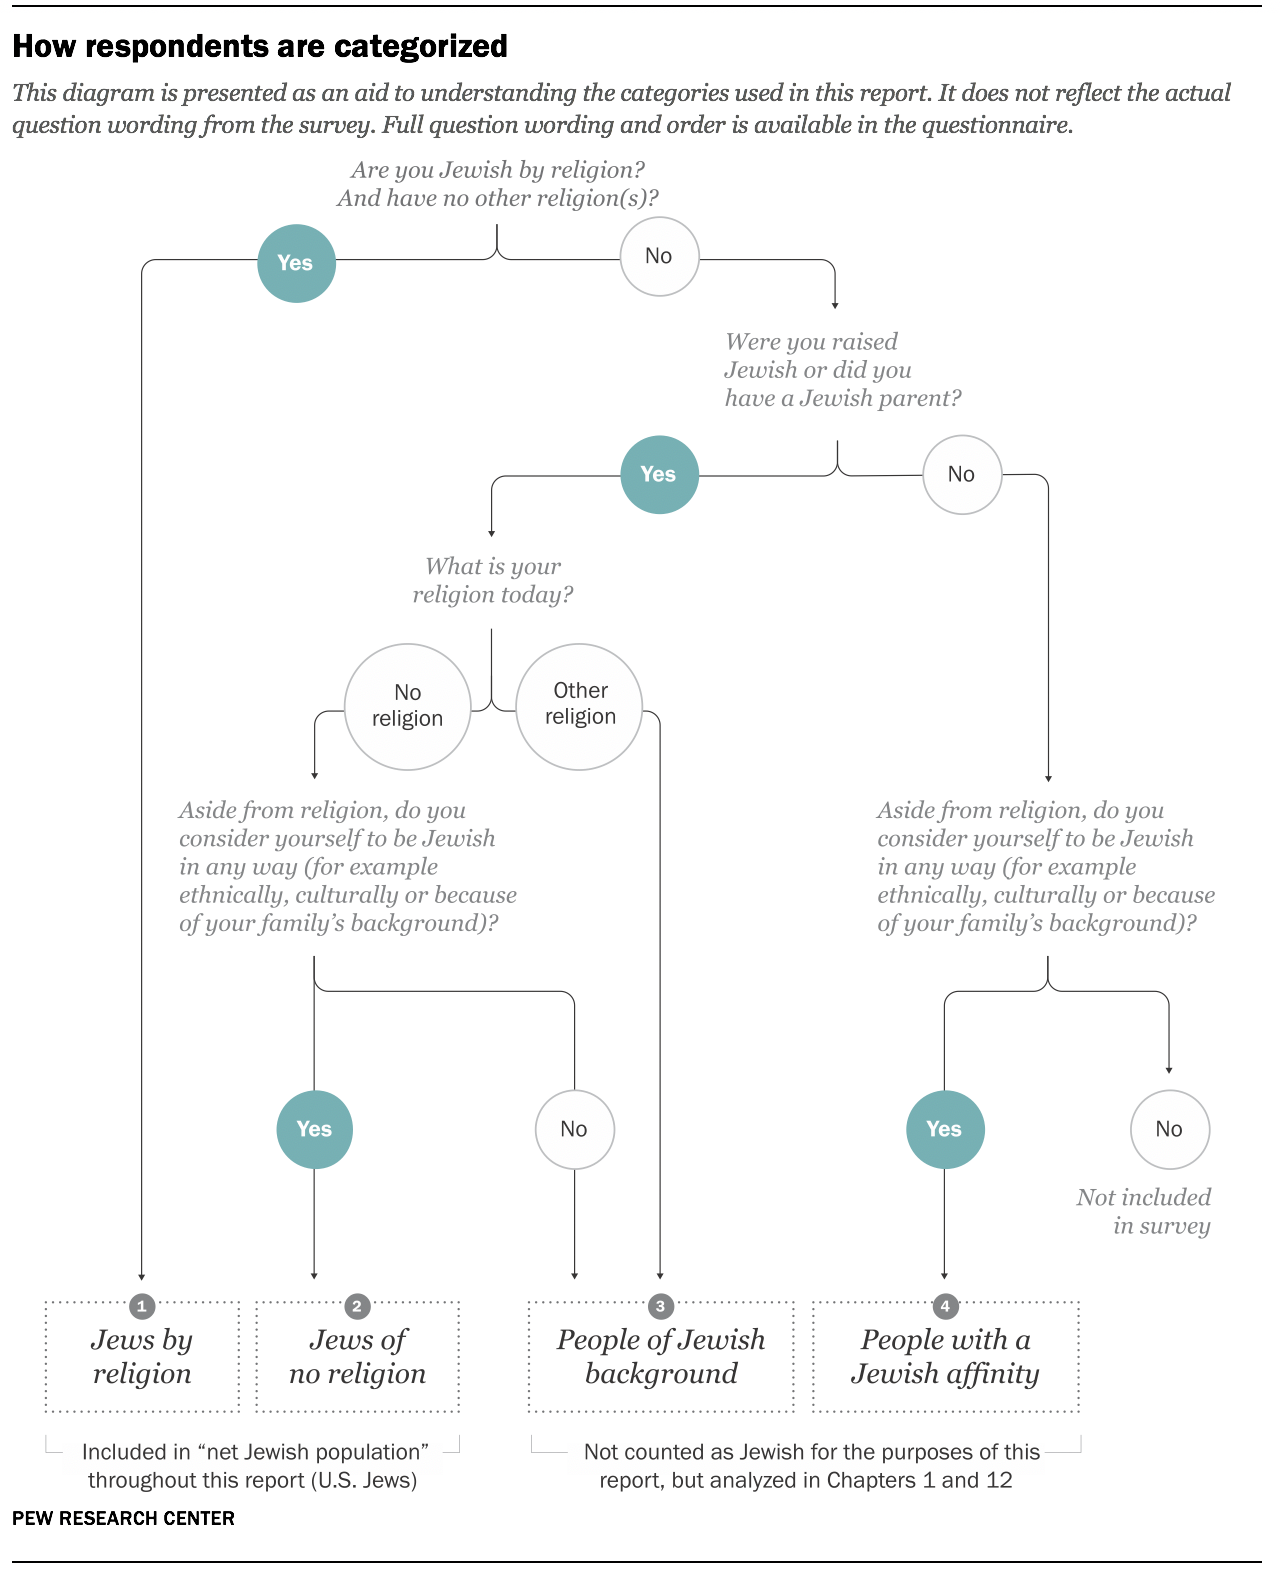
As in 2013, respondents who say they are Jewish and any other religion (such as Christian) are not included in the net Jewish category. Nor are respondents who indicate they have a Jewish parent or were raised Jewish but who say they do not consider themselves Jewish today in any way.
For more information on the 2020 survey sample, see the box “How we did this” and the Methodology.
Sources of unity and division
While there are some signs of religious divergence and political polarization among U.S. Jews, the survey also finds large areas of consensus. For instance, more than eight-in-ten U.S. Jews say that they feel at least some sense of belonging to the Jewish people, and three-quarters say that “being Jewish” is either very or somewhat important to them.
As in 2013, the 2020 survey asked Jewish Americans whether a list of causes and activities are “essential,” “important but not essential” or “not important” to what being Jewish means to them. Because of methodological differences in the way the survey was conducted and the addition of one item to the list, the results from 2020 on particular items may not be directly comparable to 2013, but the broad pattern of responses is similar in many ways.7
Seven-in-ten or more U.S. Jews say that remembering the Holocaust (76%) and leading a moral and ethical life (72%) are essential to their Jewish identity. About half or more also say that working for justice and equality in society (59%), being intellectually curious (56%) and continuing family traditions (51%) are essential. Far fewer consider eating traditional Jewish foods (20%) and observing Jewish law (15%) to be essential elements of what being Jewish means to them, personally. However, the observance of halakha – Jewish law – is particularly important to Orthodox Jews, 83% of whom deem it essential.
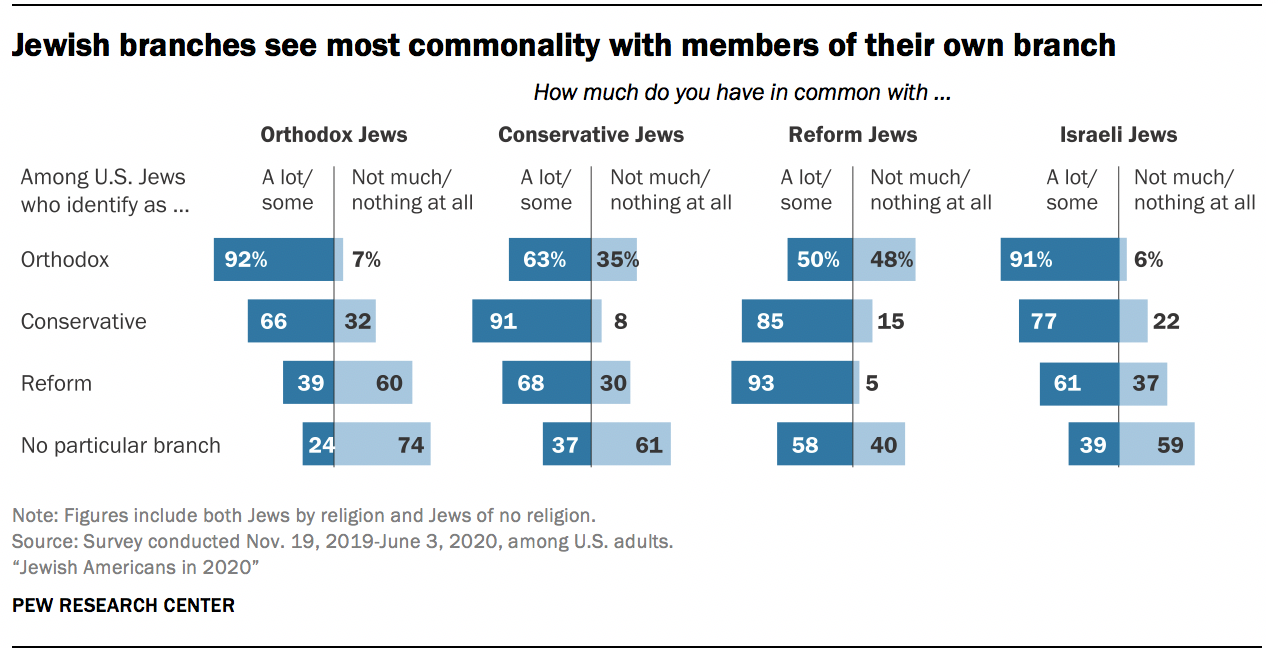
Views on halakha are just one of many stark differences in beliefs and behaviors between Orthodox Jews and Jewish Americans who identify with other branches of Judaism (or with no particular branch) that are evident in the survey, and that may affect how these groups perceive each other. For example, about half of Orthodox Jews in the U.S. say they have “not much” (23%) or “nothing at all” (26%) in common with Jews in the Reform movement; just 9% feel they have “a lot” in common with Reform Jews.
Reform Jews generally reciprocate those feelings: Six-in-ten say they have not much (39%) or nothing at all (21%) in common with the Orthodox, while 30% of Reform Jews say they have some things in common, and 9% say they have a lot in common with Orthodox Jews.
In fact, both Conservative and Reform Jews are more likely to say they have “a lot” or “some” in common with Jews in Israel (77% and 61%, respectively) than to say they have commonalities with Orthodox Jews in the United States. And Orthodox Jews are far more likely to say they have “a lot” or “some” in common with Israeli Jews (91%) than to say the same about their Conservative and Reform counterparts in the U.S.
U.S. Jews less religious than U.S. adults overall, but some Jewish trends reflect broader American context
When it comes to religion, U.S. Jews are in many ways distinctive from the wider U.S. public – and not just in their engagement with specifically Jewish beliefs and practices.
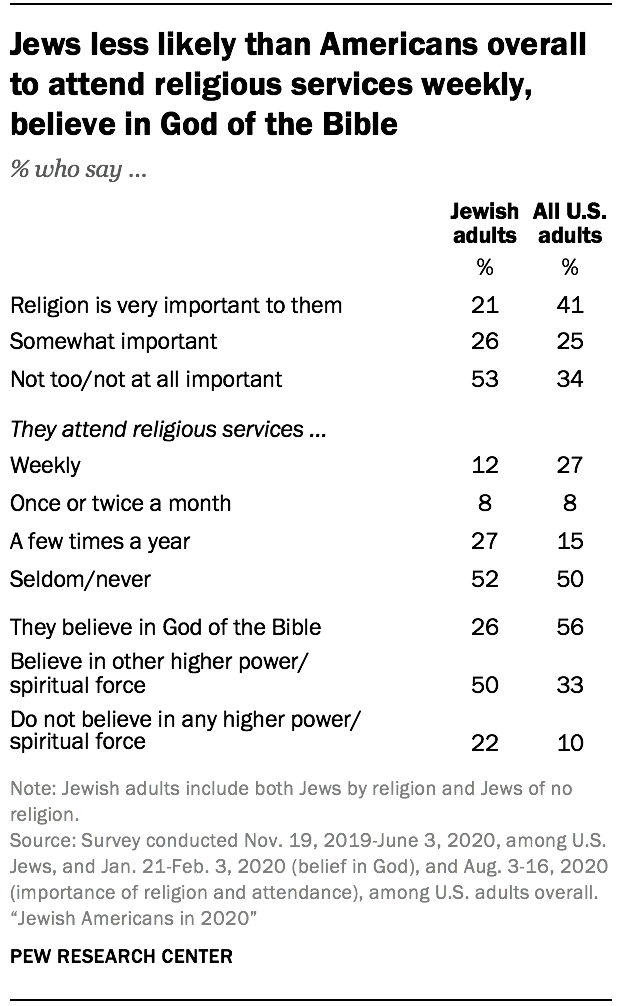
In general, Jews are far less religious than American adults as a whole, at least by conventional measures of religious observance in Pew Research Center surveys. For example, one-in-five Jews (21%) say religion is very important in their lives, compared with 41% of U.S. adults overall. And 12% of Jewish Americans say they attend religious services weekly or more often, versus 27% of the general public.
There are even bigger gaps when it comes to belief in God. A majority of all U.S. adults say they believe in God “as described in the Bible” (56%), compared with about a quarter of Jews (26%). Jewish Americans are more inclined to believe in some other kind of higher power – or no higher power at all.
At the same time, however, the trends playing out among American Jews are similar to many patterns in the broader population. The most obvious of these is growing religious disaffiliation: The percentage of U.S. Jews who do not claim any religion (27%) – i.e., who identify as atheist, agnostic or “nothing in particular,” religiously – is virtually identical to the percentage of U.S. adults overall in these categories (28%).
In addition, intermarriage is not just a Jewish phenomenon. Religious intermarriage also appears to be on the rise in the U.S. adult population more broadly. The same is true for rising levels of racial and ethnic diversity, which is happening in most U.S. religious groups as the country’s population as a whole becomes more diverse. Finally, the fact that Orthodox Jews tend to have more children aligns with a general pattern in which highly religious Americans have higher fertility rates than non-religious ones.
Why Jews go, or don’t go, to religious services
Left unanswered by the 2013 study was why many Jewish Americans, particularly in younger cohorts, rarely attend synagogue, and in what ways, if any, they connect with Judaism or other Jews.
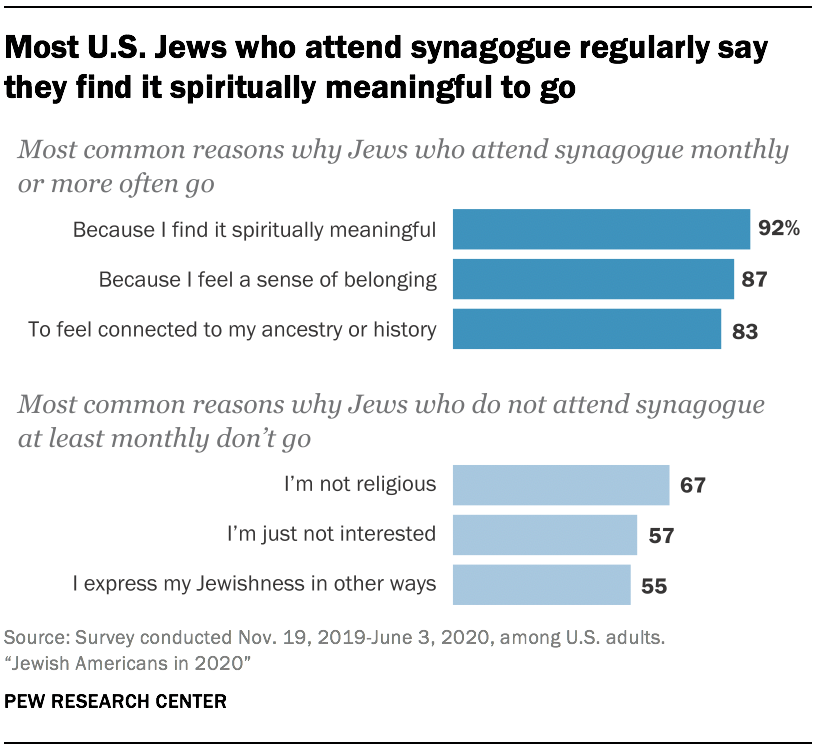
The 2020 survey includes some new questions designed to help explore those issues. To begin with, Jews who say they attend services at a synagogue, temple, minyan or havurah at least once a month – 20% of Jewish adults – were asked what draws them to religious services. Those who attend services a few times a year or less were asked what keeps them away; this group makes up nearly eight-in-ten U.S. Jews (79%).
Of nine possible reasons for attending Jewish services offered in the survey, the most commonly chosen is “Because I find it spiritually meaningful.” Nine-in-ten regular attenders say this is a reason they go to services (92%), followed closely by “Because I feel a sense of belonging” (87%) and “To feel connected to my ancestry or history” (83%). About two-thirds (65%) say they feel a religious obligation, and Orthodox Jews are especially likely to give this reason (87%). Fewer Jewish congregants say they go to religious services to please a spouse or family member (42%) or because they would feel guilty if they did not participate (22%).
Of 11 possible reasons for not attending religious services, the top choice is “I’m not religious.” Two-thirds of infrequent attenders say this is a reason they do not go to services more often. Other common explanations are “I’m just not interested” (57%) and “I express my Jewishness in other ways” (55%). Fewer say “I don’t know enough to participate” (23%), “I feel pressured to do more or give more” (11%), “I don’t feel welcome” (7%), “I fear for my security” (6%) or “People treat me like I don’t really belong” (4%).
The degree to which finances are a barrier seems to vary by age. Although some Jewish leaders believe that synagogue membership fees are keeping away young people, younger Jewish adults (under age 30) are somewhat less likely than those who are older to say they don’t attend religious services because “it costs too much” (10% vs. 19%). For perspective on this question from in-depth interviews with congregational rabbis, see the sidebar, “Most U.S. Jews don’t go to synagogue, so rabbis and a host of new organizations are trying to innovate” in Chapter 3.
For more analysis of these questions, see Chapter 3.
Cultural engagement
In addition to traditional forms of religious observance, such as attending a synagogue, many Jewish Americans say they engage in cultural Jewish activities such as enjoying Jewish foods, visiting Jewish historical sites and reading Jewish literature.
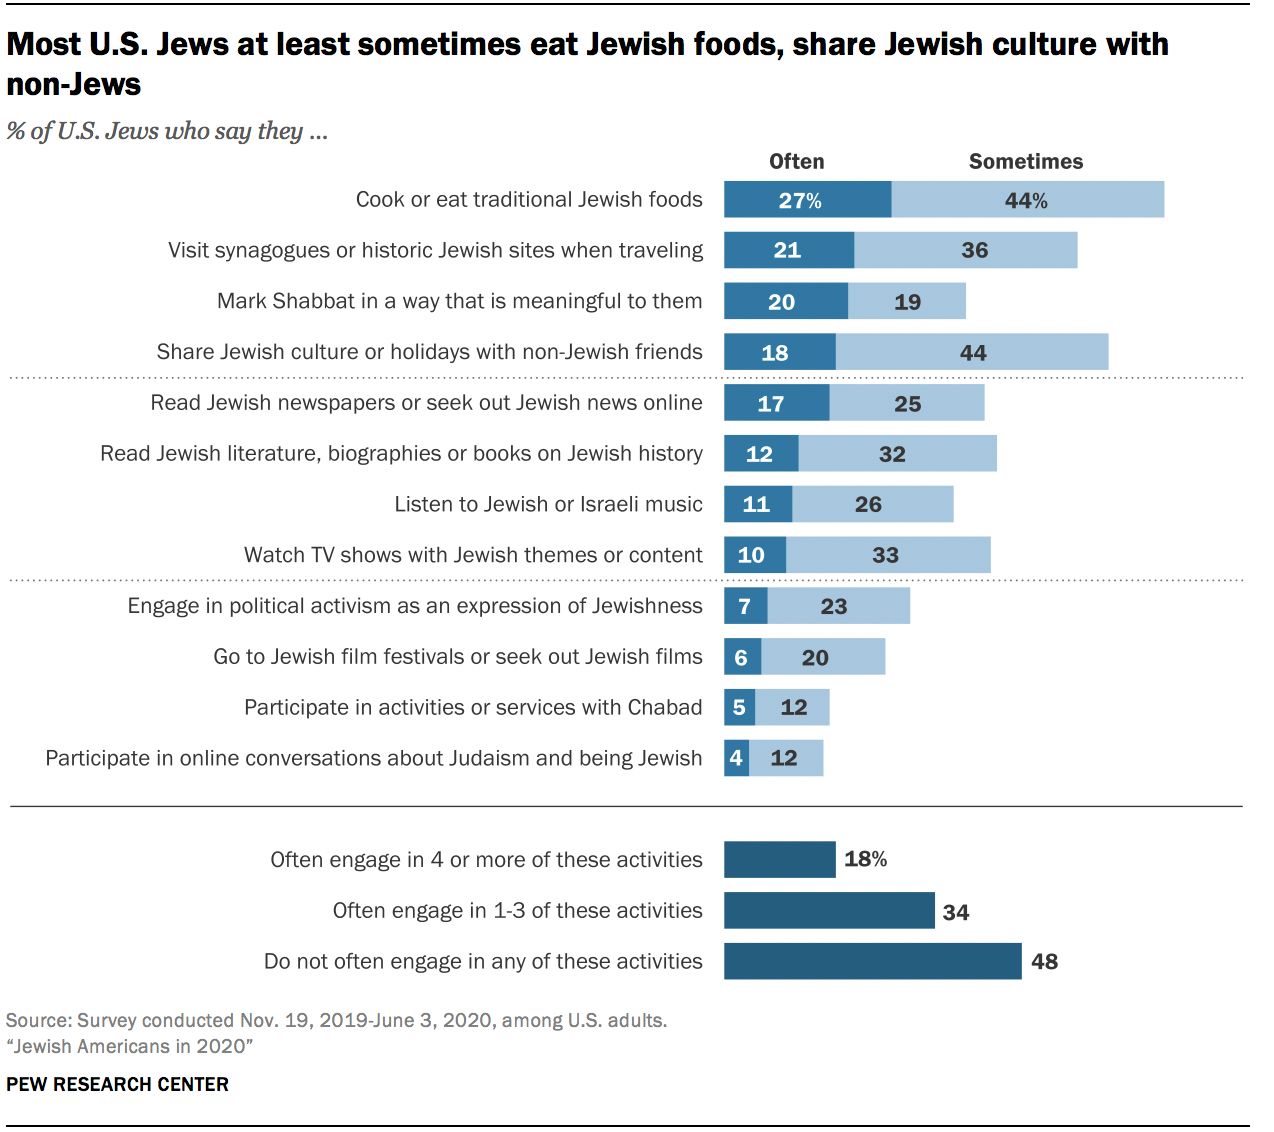
Young Jewish adults report engaging in many of these activities at rates roughly equal to older U.S. Jews. Among Jews ages 18 to 29, for example, 70% say they often or sometimes cook or eat traditional Jewish foods, identical to the percentage of Jews 65 and older who do the same. And 37% of the youngest Jewish adults say they at least sometimes mark Shabbat in a way that makes it meaningful to them (though not necessarily in a way that follows Jewish law, such as abstaining from work), as do 35% of Jews who are 65 and older.
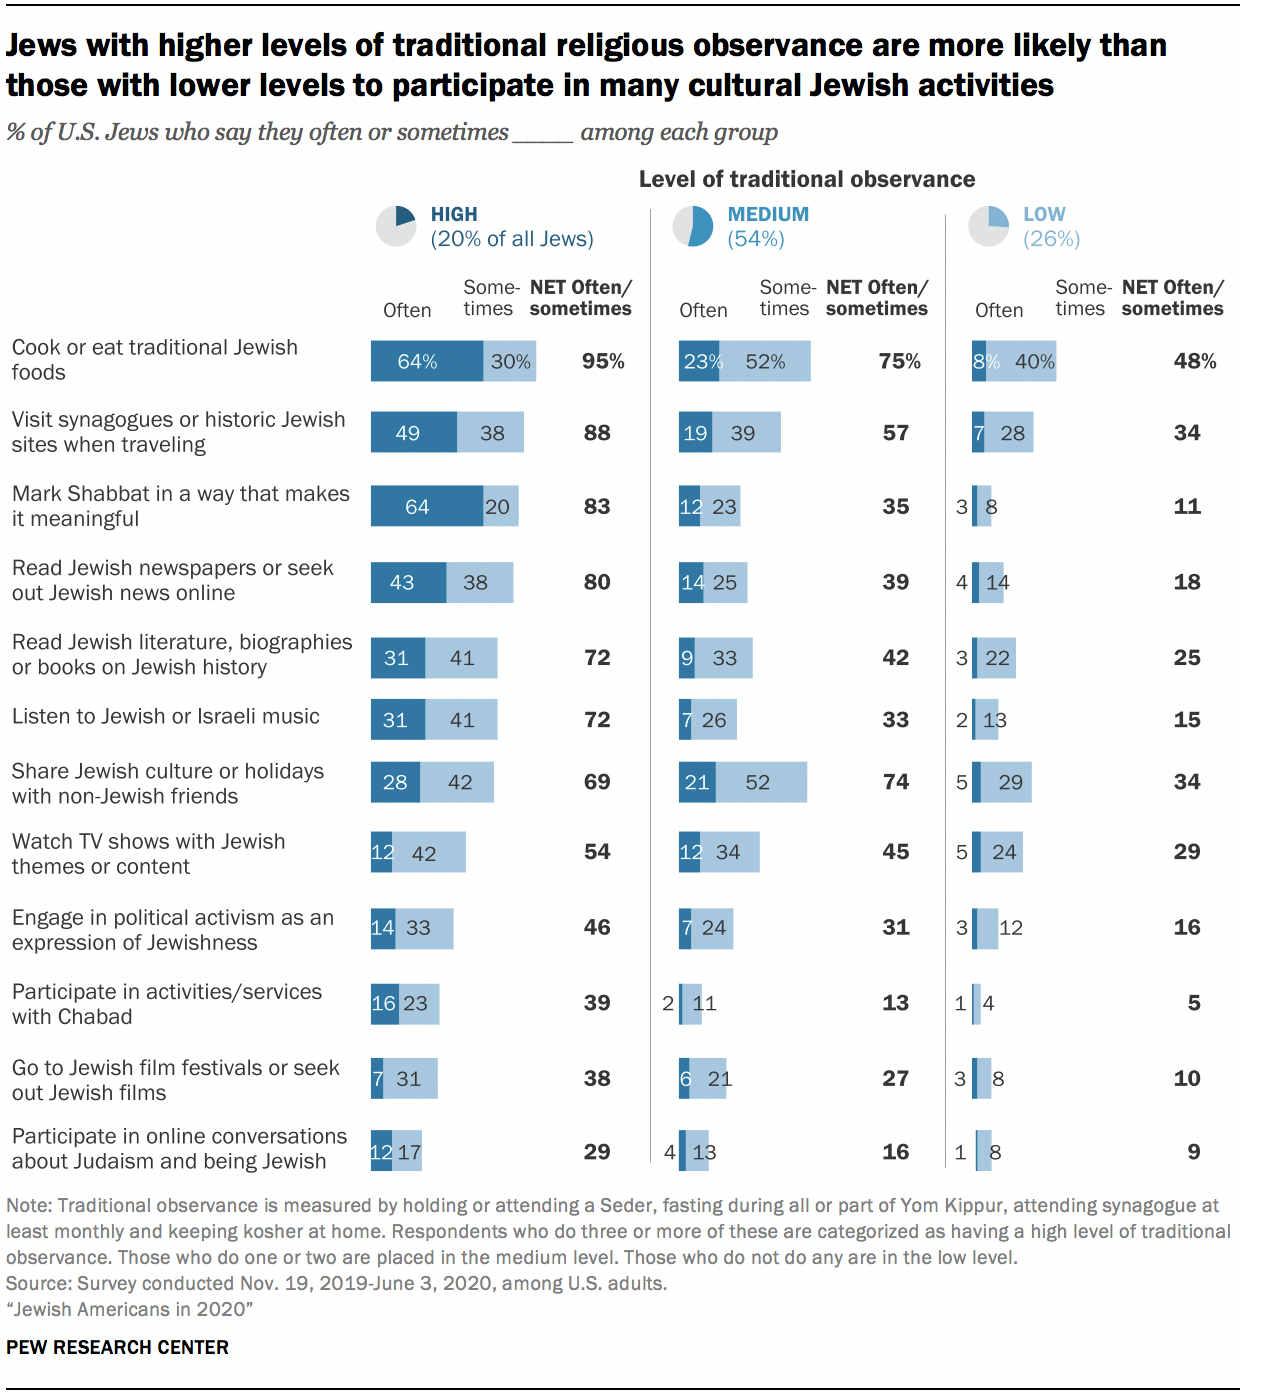
Overall, however, it’s not the case that Jewish cultural activities or individualized, do-it-yourself religious observances are directly substituting for synagogue attendance and other traditional forms of Jewish observance. More often, they are complementing traditional religious participation. Statistical analysis indicates that people who are highly observant by traditional measures – on a scale combining synagogue attendance, keeping kosher, fasting on Yom Kippur and participating in a Passover Seder – also tend to report the highest participation rates in the 12 cultural Jewish activities mentioned in the survey, such as reading Jewish publications, listening to Jewish music and going to Jewish film festivals.8
Those who are low on the scale of traditional religious observance, meanwhile, tend to be much less active in the vibrant array of cultural activities available to U.S. Jews in the 21st century. In fact, no more than about one-in-ten low-observance Jews say they often do any of the dozen things mentioned in the survey.
For example, among highly observant Jews, 31% say they often listen to Jewish or Israeli music, compared with 7% of those with a medium level of traditional observance and just 2% of those who are low on the observance scale. There are similar patterns on other questions: 64% of highly observant Jews often cook or eat traditional Jewish foods, eight times the share of low-observance Jews who say the same (8%).
At the same time, the survey finds that many Jews who answered a different question by saying they don’t go to religious services because they “express [their] Jewishness in other ways” do engage in cultural activities, at least on occasion. About three-quarters report that they sometimes or often enjoy Jewish foods (77%) and share Jewish culture or holidays with non-Jewish friends (74%), while many also visit historic Jewish sites when traveling (55%) and read Jewish literature (47%).
See Chapter 3 for more analysis of these questions.
Most U.S. Jews perceive a rise in anti-Semitism
In the wake of a series of murderous attacks on Jewish Americans – at the Tree of Life synagogue in Pittsburgh in October 2018; Chabad of Poway synagogue in Poway, California, in April 2019; and a kosher grocery store in Jersey City, New Jersey, in December 2019 – the 2020 survey posed many more questions about anti-Semitism than the 2013 survey did.
More than nine-in-ten U.S. Jews say there is at least “some” anti-Semitism in the United States, including 45% who say there is “a lot” of anti-Semitism. Just 6% say there is not much anti-Semitism, and close to zero (fewer than 1%) say there is none at all.
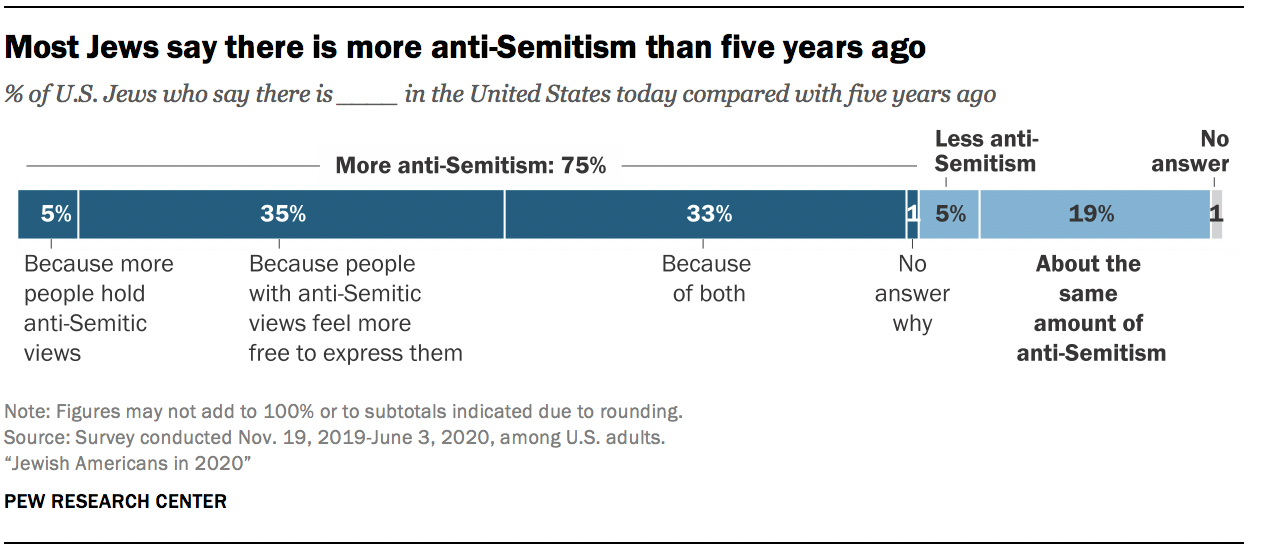
Moreover, three-quarters (75%) say there is more anti-Semitism in the United States than there was five years ago. Just 5% say there is less, and 19% perceive little or no change, saying there is about the same amount of anti-Semitism as there was five years ago.
Among those who perceive an increase in anti-Semitism over the last five years, relatively few (5% of all U.S. Jews) think it has occurred solely “because there are now more people who hold anti-Semitic views.” The vast majority say that anti-Semitism has increased in the United States either because people who hold anti-Semitic views “now feel more free to express them” (35%) or that both things have happened: The number of anti-Semites has grown andpeople now feel more free to express anti-Semitic views (33%).
The survey also sought to assess, in broad terms, the psychological impact of anti-Semitism on Jewish Americans and its possible chilling effect on Jewish community activities.
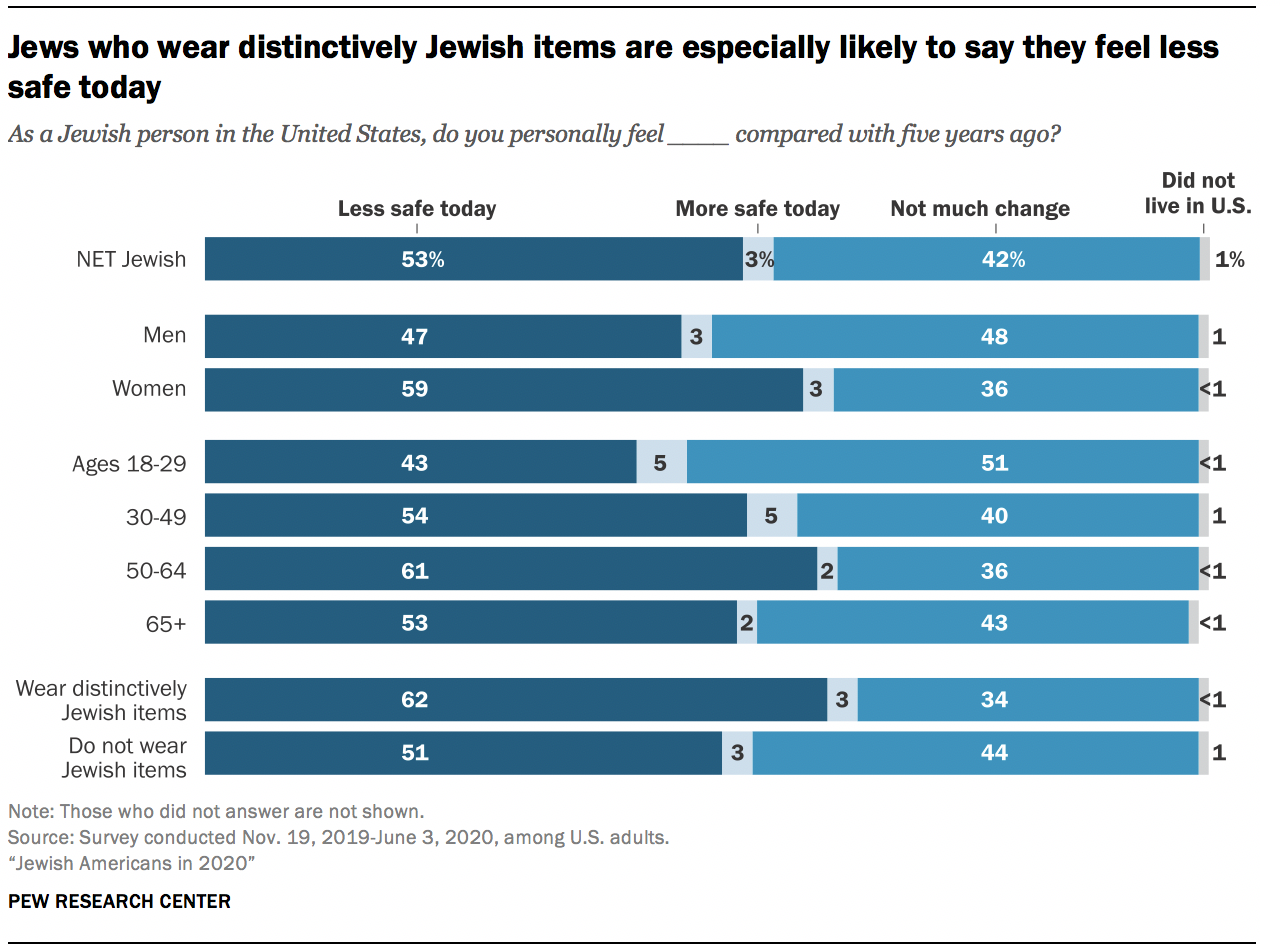
Slightly more than half of Jews surveyed (53%) say that, as a Jewish person in the United States, they personally feel less safe today than they did five years ago. Just 3% feel more safe, while 42% don’t sense much change. (An additional 1% say they did not live in the U.S. five years ago.) Jews who usually wear something in public that is recognizably Jewish (such as a kippa or head covering) are especially likely to feel less safe, as are Jewish women.
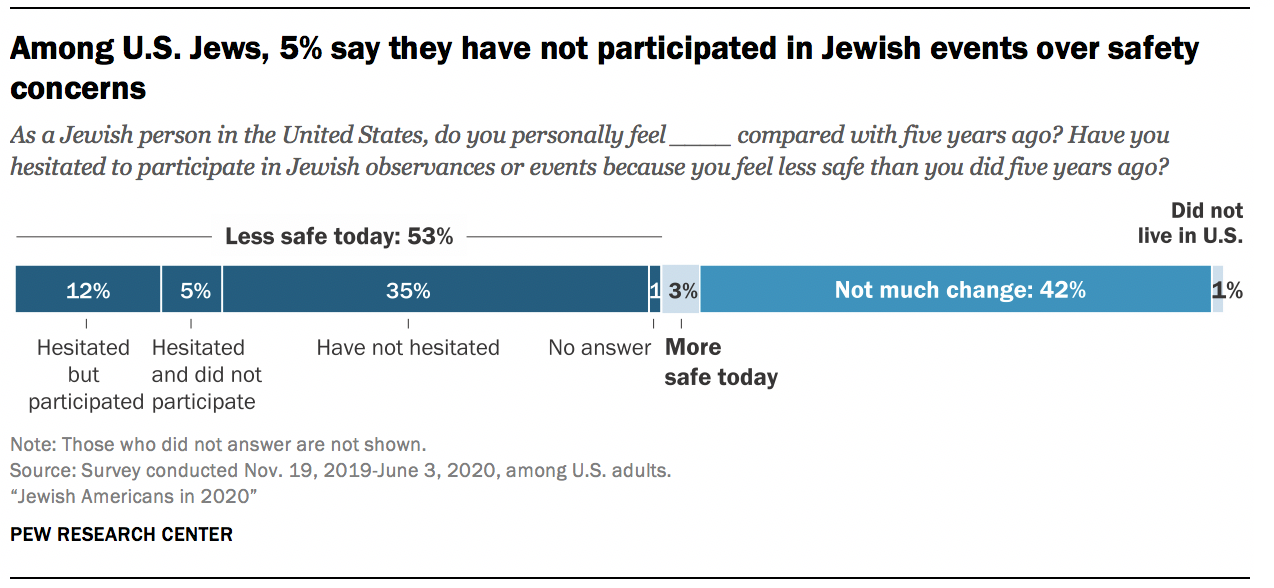
Those who say they feel less safe now were asked a follow-up question: Have you hesitated to participate in Jewish observances or events because you feel less safe than you did five years ago?
Two-thirds of those who feel less safe (or 35% of all Jewish adults) say they have not hesitated to participate in Jewish activities because of safety concerns. About one-quarter of those who feel less safe (12% of all U.S. Jewish adults) say they have hesitated but still participated in Jewish observances or events. And about one-in-ten Jews who say they feel less safe (5% of all U.S. Jewish adults) say they hesitated and chose not to participate in Jewish observances or events because of safety concerns.
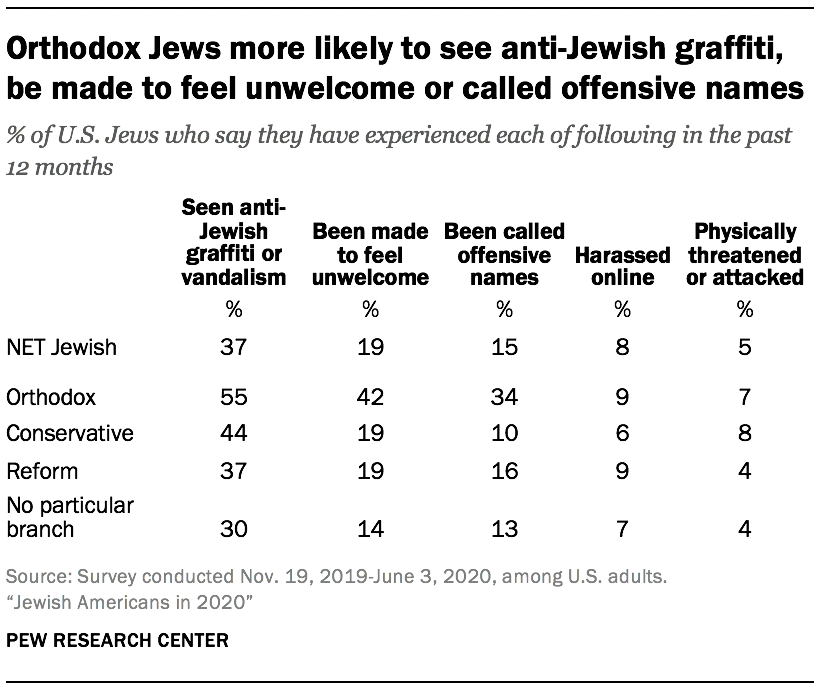
Jewish Americans report that they experience some forms of anti-Semitism much more often than other forms. For example, 37% say they have seen anti-Jewish graffiti or vandalism in their local community in the past 12 months, while 19% say they have been made to feel unwelcome because they are Jewish and 15% say they have been called offensive names. Fewer say that in the 12 months prior to taking the survey they have been harassed online (8%) or physically attacked (5%) because they are Jewish.
While reports of physical attacks are rare across the board, many of the other experiences of anti-Semitism are more common among younger Jews and Orthodox Jews (who often wear recognizably Jewish attire in public). For example, one-quarter of Jewish adults under the age of 30 say that in the past year they have been called offensive names because they are Jewish, compared with 10% of Jews ages 50 and older. And 55% of Orthodox Jews say they have seen anti-Jewish graffiti in their local community in the past year, compared with 37% of Reform Jews; this may be, at least in part, because Orthodox Jews are more likely to live in heavily Jewish neighborhoods.
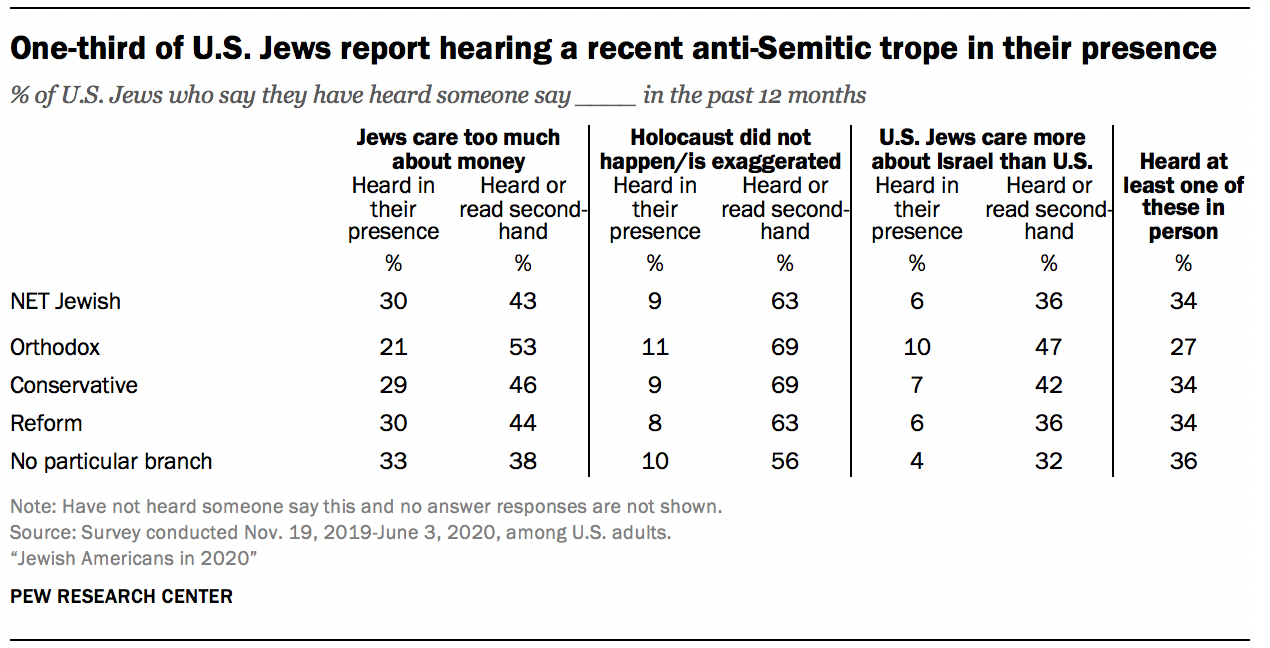
Most Jewish Americans also have been exposed in the past year to anti-Semitic tropes or stereotypes – though most report these as secondhand experiences, such as something they have seen on social media or read about in news stories. For example, about three-quarters of Jewish adults have heard someone claim that “Jews care too much about money,” including three-in-ten (30%) who say this was said in their presence in the past year and an additional 43% who say they have heard or read about this claim secondhand.
Similarly, 71% of U.S. Jews say they have heard or read about someone claiming in the past year that “the Holocaust did not happen or its severity has been exaggerated.” But most of these experiences have been secondhand (63%) rather than something said in their presence (9%). A smaller share of U.S. Jews have heard someone say that “American Jews care more about Israel than about the United States,” including 36% who have heard or read about this secondhand and 6% who have heard it directly in the last year.
Despite these experiences with anti-Semitism, Jewish Americans tend to say that there is as much – or more – discrimination in U.S. society against several other groups (including Muslim, Black, Hispanic, and gay or lesbian Americans) as there is against Jews. This was true in the 2013 survey and remains the case in 2020.9
For more analysis of questions on discrimination and anti-Semitism, see Chapter 6.
Partisanship shapes views on Trump
Surveyed roughly five to 12 months before the 2020 presidential election, U.S. Jews expressed generally negative views of then-President Donald Trump: 73% of all Jewish adults (and 96% of Jews who are Democrats or lean Democratic) disapproved of his performance in office, while 27% gave him positive approval ratings (including 88% of Jews who are Republicans or lean Republican).
Jews were especially scornful of Trump’s handling of environmental and immigration issues: Eight-in-ten Jewish adults said he had done a “poor” or “only fair” job on the environment, and three-quarters said the same about his handling of immigration.
Most U.S. Jews perceived Trump as friendly toward Israel. About six-in-ten overall (63%) said this, including 55% of Jews who are Democrats or lean Democratic as well as 85% of those who are Republicans or lean Republican.
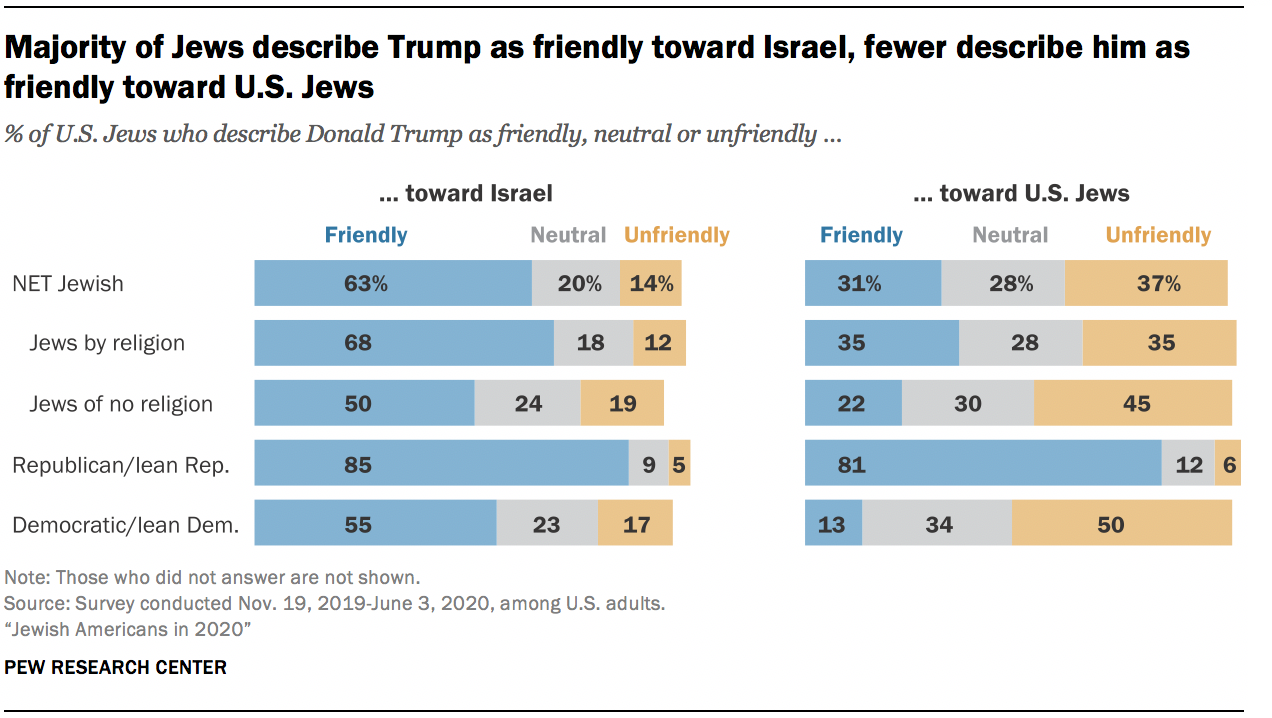
But there was less consensus among Jewish Americans over whether Trump was friendly toward Jews in the United States. About three-in-ten said he was friendly (31%), while 28% said he was neutral and 37% said he was unfriendlytoward U.S. Jews. These perceptions, however, were highly partisan: While a large majority of Jewish Republicans (81%) said Trump was friendly toward Jews in the United States, just 13% of Jewish Democrats agreed.
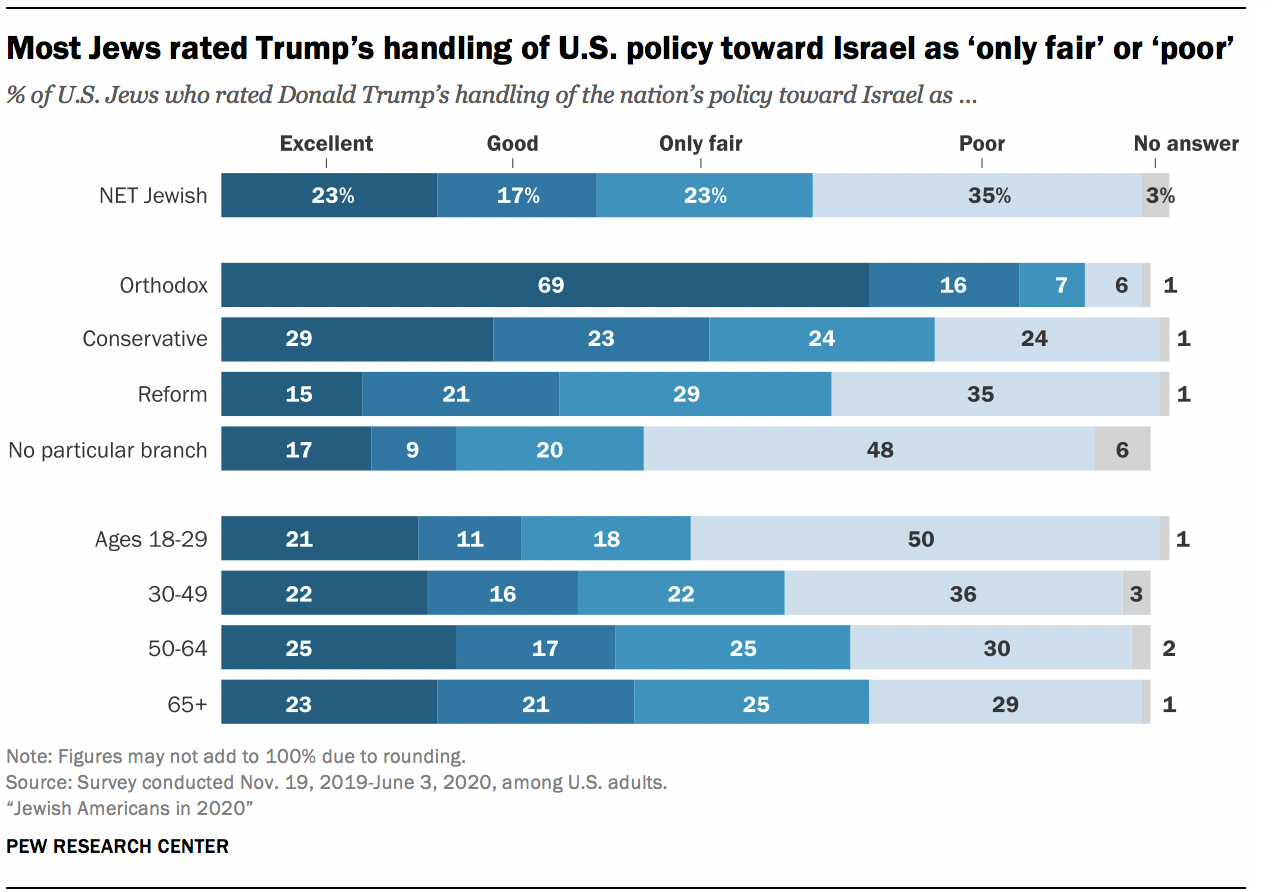
Even though most U.S. Jews perceived Trump as friendly toward Israel, that does not necessarily mean they looked positively on his policies toward the Jewish state. Indeed, most Jewish Americans rated Trump’s handling of U.S. policy toward Israel as “only fair” (23%) or “poor” (35%), while four-in-ten rated his handling of this policy as good (17%) or excellent (23%).10 Orthodox Jews were particularly inclined to give Trump high marks for his policies toward Israel (69% “excellent”).
In the 2013 survey, which took place during the administration of President Barack Obama, one-in-ten Jewish Americans said U.S. policy was “too supportive” of Israel. Most said U.S. policy was either “not supportive enough” of Israel (31%) or “about right” (54%).
Seven years later, during the final 14 months of the Trump administration, just over half of Jewish adults (54%) still said the level of U.S. support for Israel was about right. But, by comparison with 2013, fewer said the U.S. was not supportive enough (19%), and more said U.S. policy was too supportive of Israel (22%).
Among Jewish adults under the age of 30, about four-in-ten (37%) took the position in 2020 that U.S. policy was too supportive of Israel, and fully half said Trump was handling policy toward Israel poorly.
Levels of connectedness with Israel
More broadly, young U.S. Jews are less emotionally attached to Israel than older ones. As of 2020, half of Jewish adults under age 30 describe themselves as very or somewhat emotionally attached to Israel (48%), compared with two-thirds of Jews ages 65 and older.
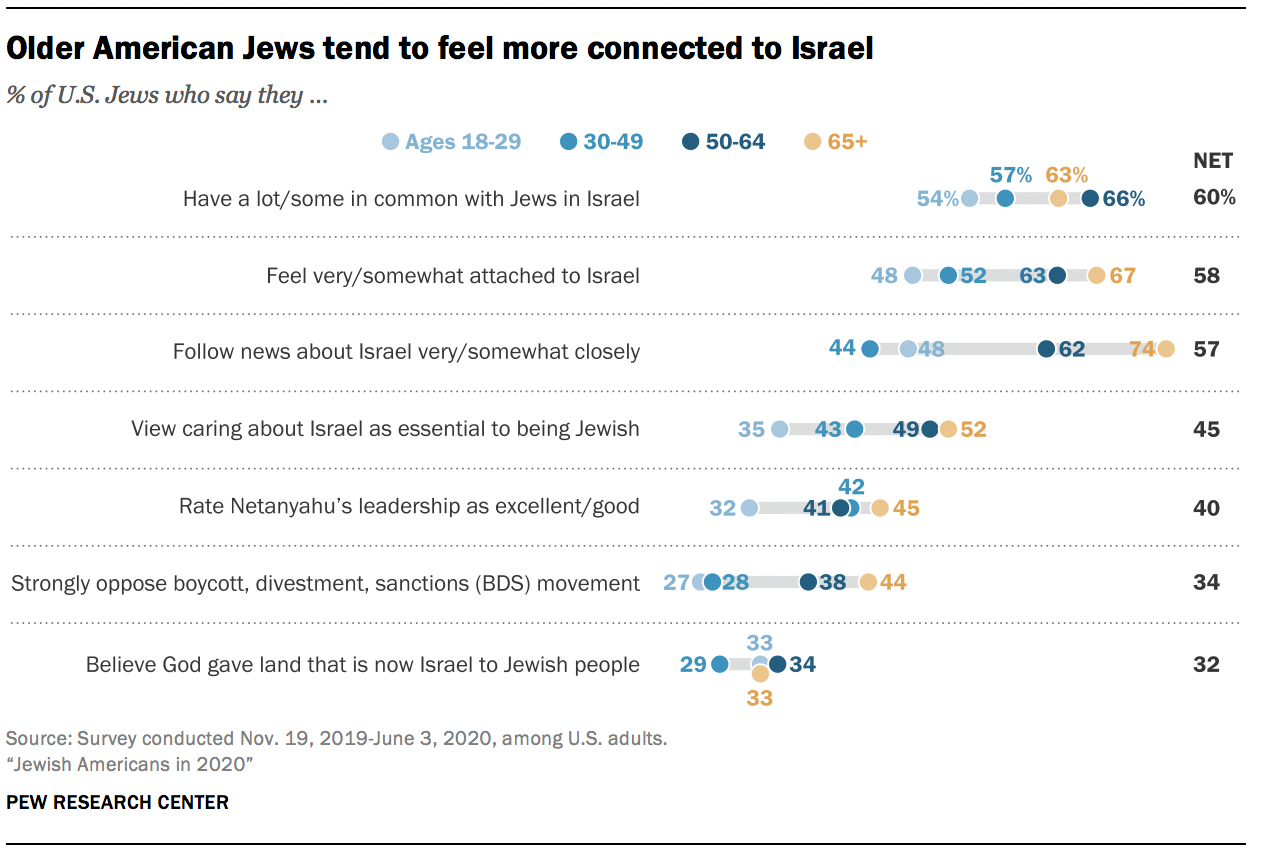
In addition, among Jews ages 50 and older, 51% say that caring about Israel is essential to what being Jewish means to them, and an additional 37% say it is important but not essential; just 10% say that caring about Israel is not important to them. By contrast, among Jewish adults under 30, one-third say that caring about Israel is essential (35%), and one-quarter (27%) say it’s not important to what being Jewish means to them.
The same pattern – lower levels of attachment to Israel among younger Jewish adults than among older ones – also was present in the 2013 survey. Because the 2013 survey was conducted by live interviewers over the telephone and the 2020 survey was self-administered by respondents online or on a paper questionnaire, the results on some questions are not directly comparable. This includes measures of attachment to Israel, and consequently it is difficult to know whether overall levels of attachment to Israel among Jewish Americans have changed over that seven-year period.
Racial and ethnic diversity among U.S. Jews
Being Jewish is an interconnected matter of religion, ethnicity, culture and ancestry. The survey sought to explore this dynamic by including questions about race and ethnicity (questions that are also intertwined with ancestry and culture), Jewish customs and geographic origin.11
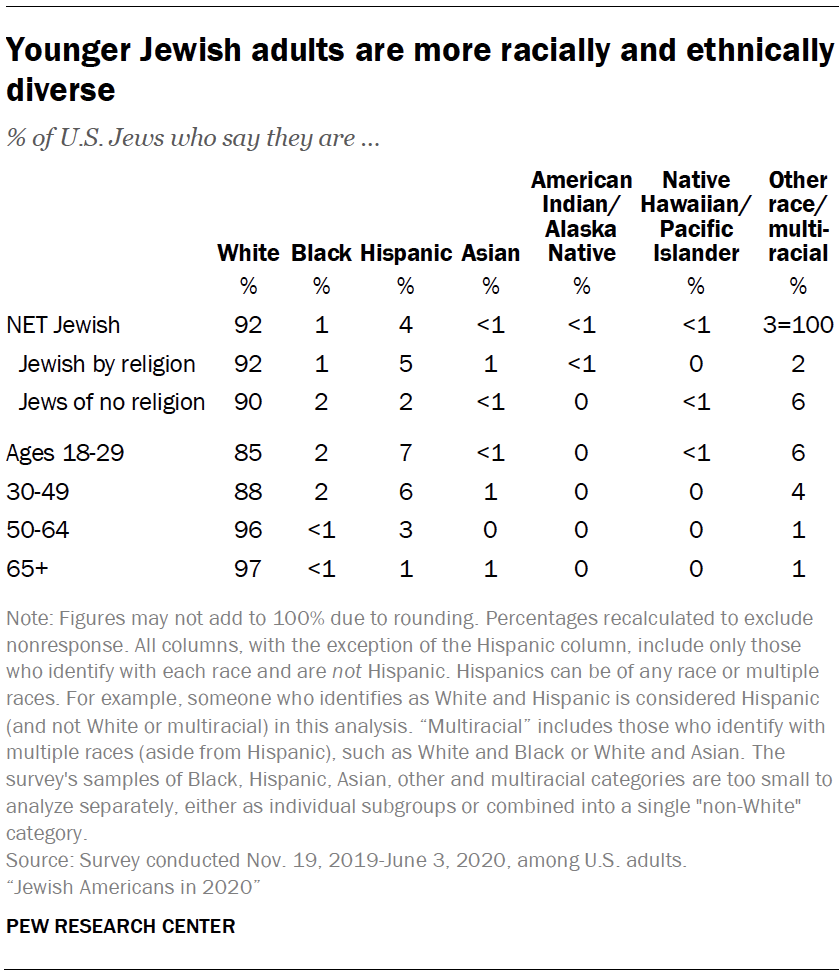
In the 2020 survey, roughly nine-in-ten U.S. Jewish adults identify as White non-Hispanic (92%), while 8% identify with all other categories combined. This compares with 94% White non-Hispanic and 6% in all other categories in the 2013 survey. In addition, there are other good reasons to think that the U.S. Jewish population, like the country’s population as a whole, is growing more racially and ethnically diverse over time, including a pattern of rising diversity by age.
Among Jewish adults under age 30, 85% identify as White (non-Hispanic), while 15% identify with all other categories, including 7% Hispanic, 2% Black (non-Hispanic) and 6% other or multiple races. That is much more racial and ethnic diversity than the survey finds among Jews ages 50 and older (97% White non-Hispanic).
Unlike in 2013, the 2020 survey also asked about the race and ethnicity of other adults and children in Jewish households. The data indicates that 17% of U.S. Jews live in households where at least one person – adult or child – is Hispanic, Black, Asian, another (non-White) race or ethnicity, or multiracial; this includes household members who may not be Jewish.
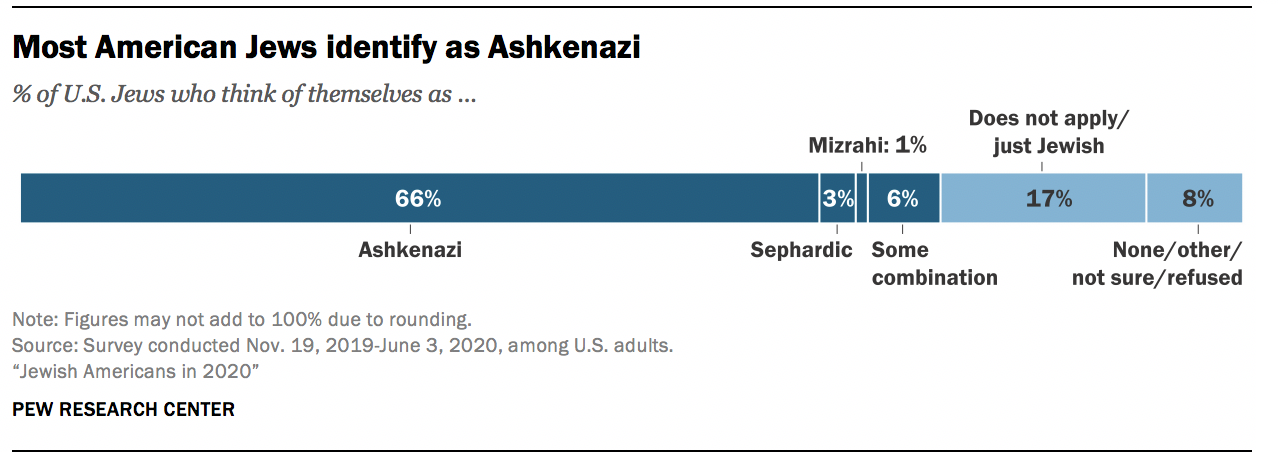
The survey also asked whether Jews think of themselves as Ashkenazi (following the Jewish customs of Central and Eastern Europe), Sephardic (following the Jewish customs of Spain), Mizrahi (following the Jewish customs of North Africa and the Middle East) or something else.12 Fully two-thirds of Jewish Americans consider themselves Ashkenazi, while relatively few consider themselves to be Sephardic (3%) or Mizrahi (1%). An additional 6% say they are some combination of these or other categories.
Despite the fact that most American Jews identify as following Jewish customs from Europe, nine-in-ten were born in the United States (90%), including 21% who are the adult children of at least one immigrant and 68% whose families have been in the U.S. for three generations or longer. One-third of Jewish adults (32%) are first- or second-generation immigrants, including 20% who were born in Europe or had a parent born in Europe and 4% who are first- or second-generation immigrants from the Middle East-North Africa region (including Israel).
Intermarriage and child rearing
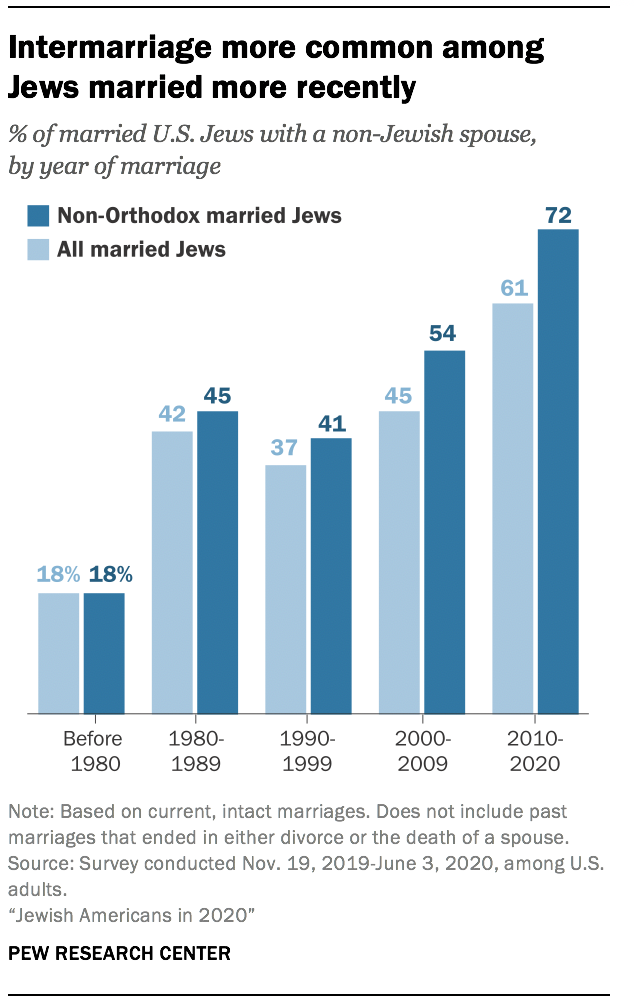
Rates of intermarriage between Jews and non-Jews in the United States are higher among Jews who have married in recent years than among those who married decades ago, a pattern broadly similar to what the 2013 survey found, though there is some variation between the decade-by-decade figures in the two surveys.13
Among Jewish respondents who got married in the past decade, six-in-ten say they have a non-Jewish spouse. Among Jews who got married between 2000 and 2009, fewer (45%) are intermarried, as are about four-in-ten who got married in the 1990s (37%) or 1980s (42%). By contrast, just 18% of Jews who got married before 1980 have a non-Jewish spouse.
Intermarriage is almost nonexistent in the Orthodox Jewish community. In the current survey, just 2% of married Orthodox Jews say their spouse is not Jewish. By contrast, among married Jews outside the Orthodox community, about half (47%) say their spouse is not Jewish. And among non-Orthodox Jews who got married in the last decade, 72% say they are intermarried – virtually the same as the 2013 survey found in the decade prior to that study.
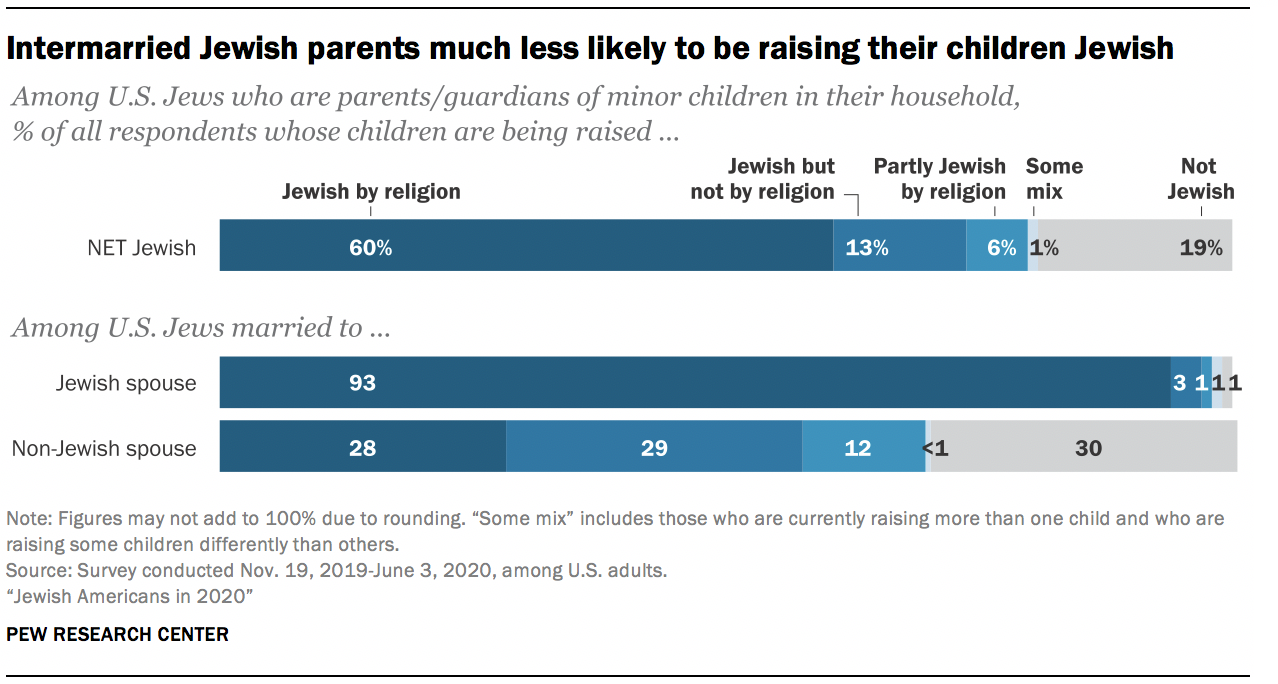
Intermarriage rates also have an intergenerational component: Adult Jews who are themselves the offspring of intermarriages are especially likely to intermarry. In the new survey, among married Jewish respondents who have one Jewish parent, 82% are intermarried, compared with 34% of those with two Jewish parents. Similarly, intermarried Jews who are currently raising minor children (under age 18) in their homes are much less likely to say they are bringing up their children as Jewish by religion (28%) than are Jewish parents who have a Jewish spouse (93%), although many of the intermarried Jews say they are raising their children as partly Jewish by religion or as Jewish aside from religion.
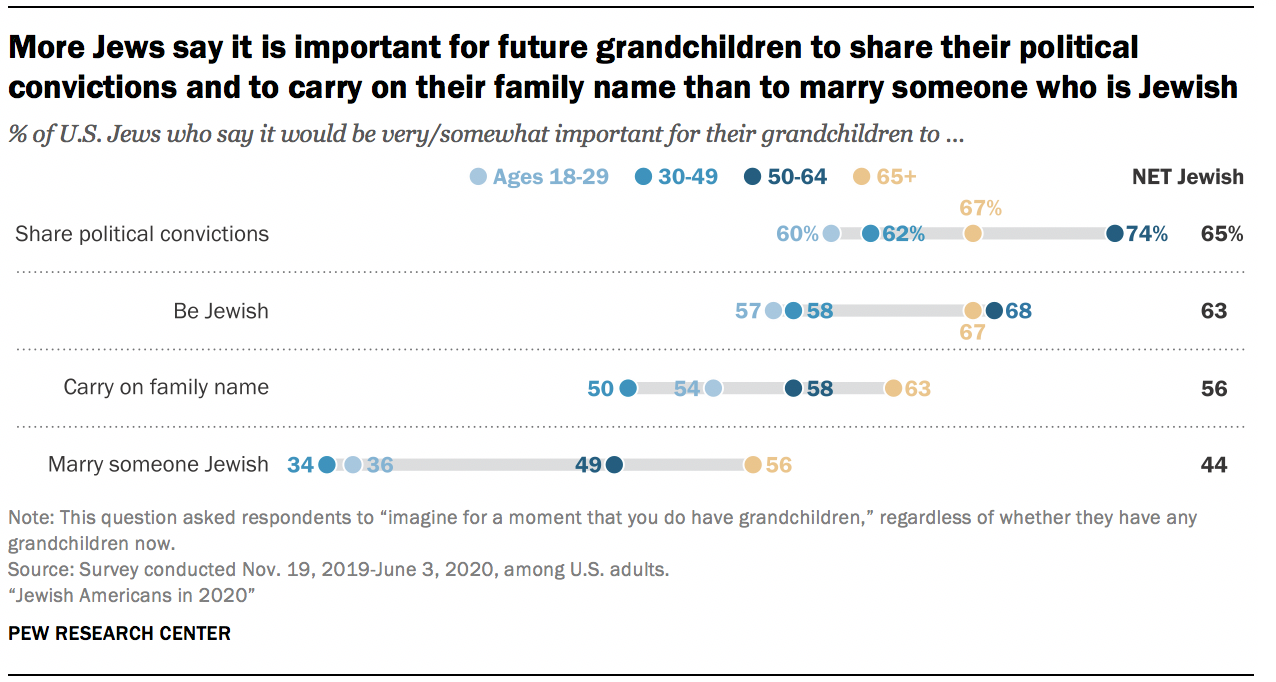
The 2020 survey included a new question aimed at helping to assess the importance to Jewish Americans of passing along their Jewish identity. Asked to imagine a time in the future when they have grandchildren of their own (if they do not currently have any), roughly six-in-ten U.S. Jews say it would be very important (34%) or somewhat important (28%) for their grandchildren to be Jewish. Smaller proportions say it would be very (22%) or somewhat (22%) important for their grandchildren to marry someone who is also Jewish.
The answers to these questions tend to vary by age, with older Jews generally assigning greater importance to Jewish continuity and in-marriage than younger Jews do. But, as previously noted in this report, there is also a kind of divergence taking place in the U.S. Jewish population, with a rising percentage of young Jewish adults who are Orthodox as well as a rising share who describe themselves – in terms of religion – as atheist, agnostic or nothing in particular.
The question about future grandchildren captures one element of this divergence. Three-in-ten Jewish adults under the age of 30 (31%) say it would be “not at all” important for their future grandchildren to be Jewish, which is significantly higher than the share who say this in any other age group. At the same time, 32% of the youngest Jewish adults say it would be “very important” for their grandchildren to be Jewish, which is on par with the share who say the same among older age groups. Among the Orthodox, 91% say it is very important for their grandchildren to be Jewish, compared with 4% among Jews of no religion.
Retention
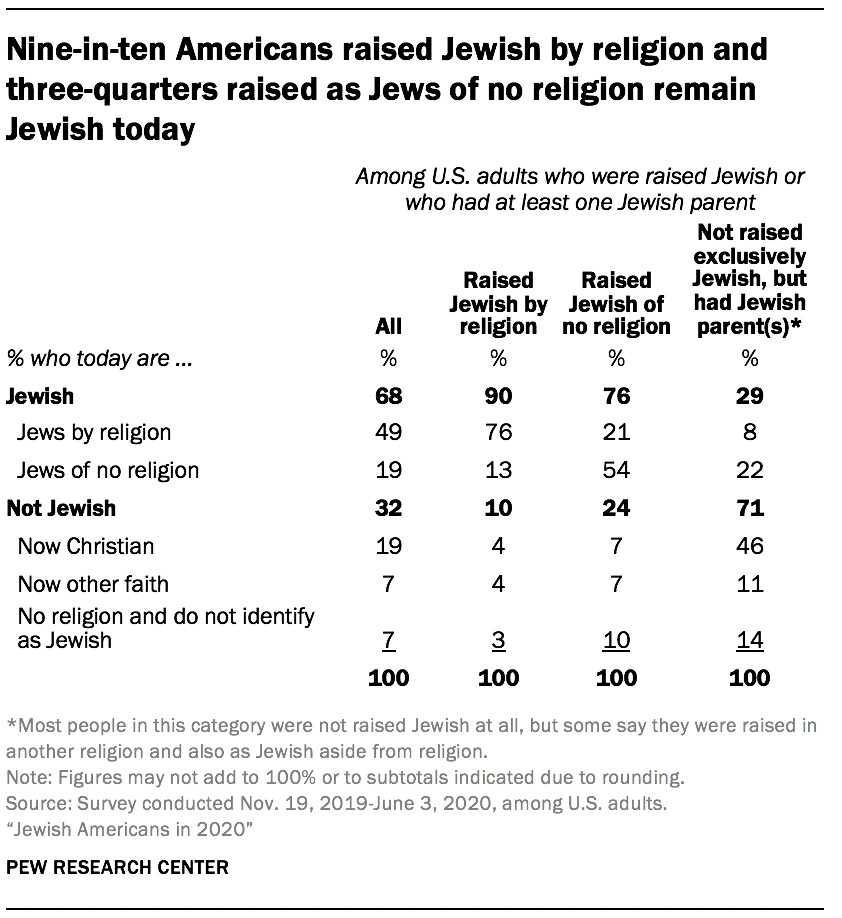
The survey estimates that roughly 8 million U.S. adults were raised Jewish or had a Jewish parent. Six-in-ten were raised Jewish by religion (58%), while 7% were raised as Jews of no religion; another 35% had at least one Jewish parent but say they were not raised exclusively Jewish (if at all), either by religion or aside from religion.14
Overall, 68% of those who say they were raised Jewish or who had at least one Jewish parent now identify as Jewish, including 49% who are now Jewish by religion and 19% who are now Jews of no religion. That means that one-third of those raised Jewish or by Jewish parent(s) are not Jewish today, either because they identify with a religion other than Judaism (including 19% who consider themselves Christian) or because they do not currently identify as Jewish either by religion or aside from religion.
Among all respondents who indicate they have some kind of Jewish background, those who were raised Jewish by religion have the highest retention rate. Nine-in-ten U.S. adults who were raised Jewish by religion are still Jewish today, including 76% who remain Jewish by religion and 13% who are now categorized as Jews of no religion. By comparison, three-quarters of those raised as Jews of no religion are still Jewish today; roughly half are still Jews of no religion and about one-in-five are now Jewish by religion. Among those who had at least one Jewish parent but who say they were not raised exclusively Jewish (either by religion or aside from religion), far fewer are Jewish today (29%).
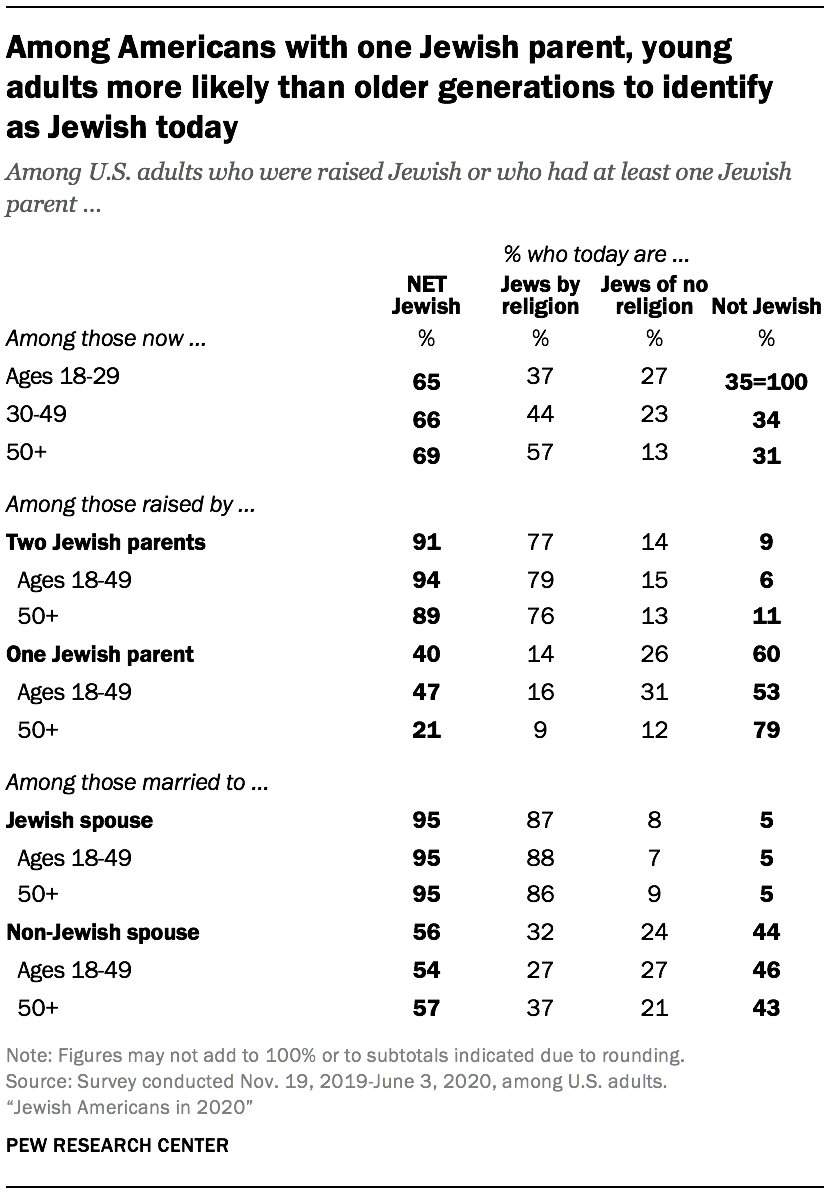
Among people who were raised with a Jewish background, the share who identify as Jewish today is similar across age groups. However, older adults who were raised Jewish or had at least one Jewish parent are more likely to identify as Jewish by religion, while larger shares of young adults say they are Jewish aside from religion. For instance, among those ages 50 and older with a Jewish background, 57% identify as Jewish by religion, compared with 37% among adults under 30.
The data also shows that people with two Jewish parents are more likely than those with just one Jewish parent to retain their Jewish identity into adulthood. However, among people who have just one Jewish parent, younger cohorts are more likely than those ages 50 and older to be Jewish as adults, suggesting that the share of intermarried Jewish parents who pass on their Jewish identity to their children may have increased over time. Or, put somewhat differently, the share of the offspring of intermarriages who choose to be Jewish in adulthood seems to be rising.15
The vast majority of adults who were raised with a Jewish background and who now are married to a Jewish spouse identify as Jewish today (95%). By contrast, far fewer of those who have a non-Jewish spouse are Jewish today (56%). However, this does not necessarily mean that marrying a non-Jewish spouse pulls people away from their Jewish identity. The causal arrow could just as easily point in the other direction: People whose Jewish identity is relatively weak may consider it less important to marry a Jewish spouse.
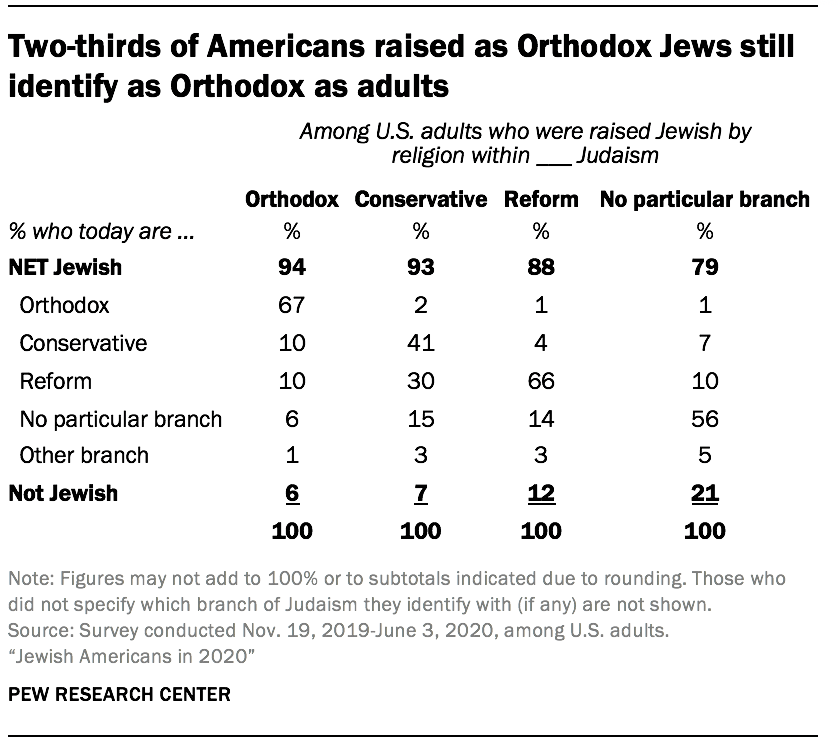
The survey also makes it possible to examine the retention rate of various institutional branches or streams of Judaism in America. Orthodox and Reform Judaism exhibit the highest retention rates of the major streams; 67% of Americans raised as Orthodox Jews by religion continue to identify with Orthodoxy as adults. Similarly, most people raised as Reform Jews by religion also identify as Reform today (66%). The retention rate for those raised within Conservative Judaism is lower; four-in-ten people (41%) raised as Conservative Jews by religion continue to identify with Conservative Judaism as adults, although fully nine-in-ten (93%) are still Jewish.
In some ways, these patterns resemble the findings from the 2013 study. In both surveys, adults who no longer identify with their childhood stream tend to have moved in the direction of less traditional forms of Judaism rather than in the direction of more traditional streams. For example, roughly half of people raised within Conservative Judaism now identify with Reform Judaism (30%), don’t affiliate with any particular branch of Judaism (15%) or are no longer Jewish (7%), while just 2% of people raised as Conservative Jews now identify with Orthodox Judaism. Similarly, about one-quarter of people raised within Reform Judaism now either have no institutional affiliation (14%) or are no longer Jewish (12%), while just one-in-twenty now identify with Conservative Judaism (4%) or with Orthodox Judaism (1%).
However, the share of adults raised within Orthodox Judaism who continue to identify as Orthodox is higher in the new study (67%) than it was in the 2013 survey (48%). This may be due (at least in part) to the fact that, in the new study, the sample of adults who say they were raised as Orthodox Jews includes a larger percentage of people under the age of 30. The 2013 study indicated that the Orthodox retention rate had been much higher among people raised in Orthodox Judaism in recent decades than among those who came of age as Orthodox Jews in the 1950s, ’60s and ’70s. The new survey included too few interviews with those raised as Orthodox Jews to be able to subdivide them by year or decade of birth.
Like other Americans, Jews have been hit hard by coronavirus
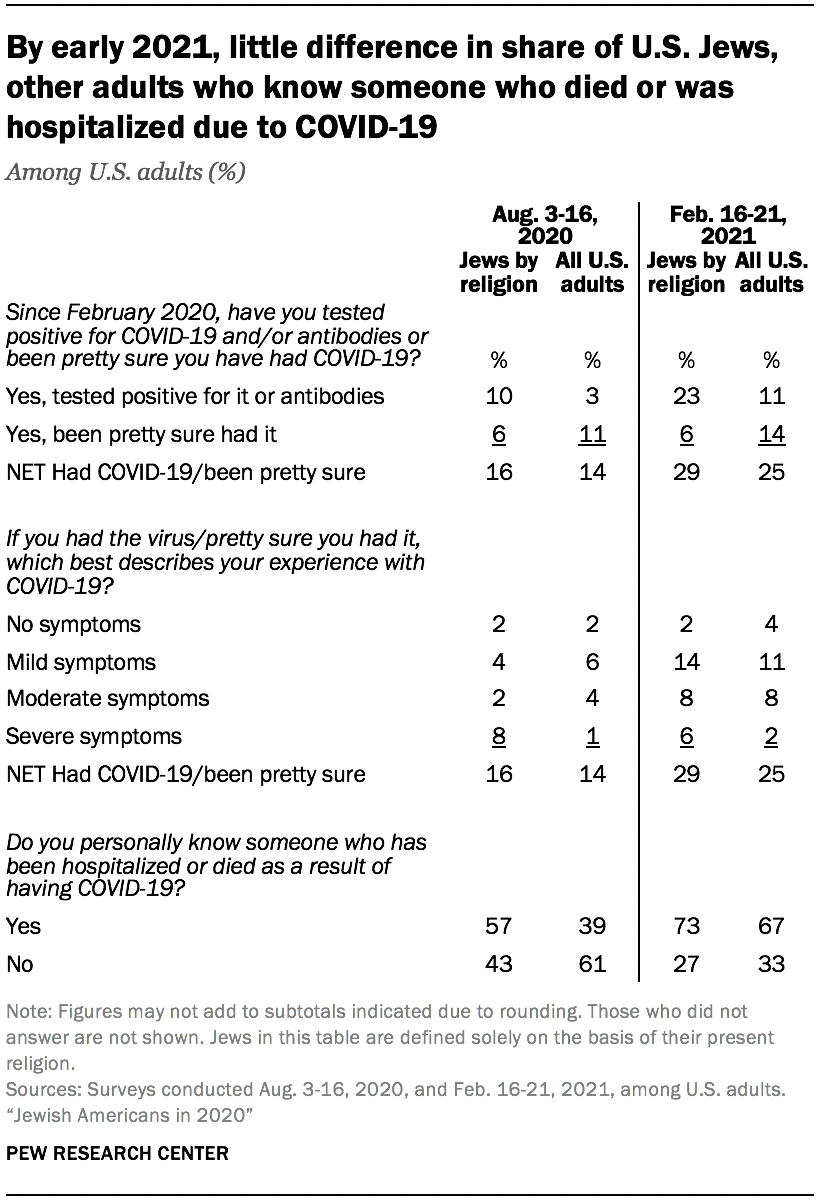
Because the survey was designed in 2019 and most of the interviewing was completed before the coronavirus pandemic hit the United States, the results by themselves do not paint a clear picture of the pandemic’s impact on Jewish Americans. However, subsequent polls conducted by Pew Research Center in August 2020 and February 2021 asked more than 10,000 Americans – including 348 and 265 Jews by religion, respectively – about their experiences in the pandemic.16
In August 2020, Jews by religion were substantially more likely than U.S. adults overall to say they knew someone who had been hospitalized or died as a result of COVID-19 (57% vs. 39%), likely because many Jews are concentrated in the New York City area, which had the highest number of COVID-19 cases in the country during the first few months of the pandemic. But both numbers had increased and the gap virtually disappeared by February 2021, when 73% of Jews and 67% of all U.S. adults said they personally knew someone who had been hospitalized or died from the coronavirus (the gap between these two figures is not statistically significant due to sample size limitations).
In February, Jews remained twice as likely as U.S. adults overall to say they had tested positive for COVID-19 or for antibodies to the disease (23% vs. 11%). But when looking at the combined share of people who say they have tested positive for the illness and those who say they are “pretty sure” they had it, even if they did not test positive, the difference between Jews (29%) and all U.S. adults (25%) is not statistically significant.
Other findings from Pew Research Center’s 2020 survey include:
- Nearly four-in-ten U.S. Jews feel they have a lot (4%) or some (34%) in common with Muslims. Fewer say they have a lot (2%) or some (18%) in common with evangelical Christians. Jews who do not identify with any denominational branch are more likely to say they have at least some in common with mainline Protestants and Muslims than to say the same about Orthodox Jews.
- Nearly two-thirds of U.S. Jews (64%) say rabbis should perform marriage ceremonies for interfaith couples (that is, between someone who is Jewish and someone who is not), and an additional 25% say “it depends.” Just 9% flatly object to rabbis performing interfaith weddings. Among Orthodox Jews, however, 73% say rabbis should not officiate at such weddings.
- Seven-in-ten U.S. Jews (71%) say rabbis should officiate at same-sex weddings, while 13% say it depends. Just 15% oppose rabbis performing marriage ceremonies for same-sex couples. But among Orthodox Jews, 82% object.
- About one-in-ten U.S. Jewish adults identify as gay or lesbian (4%) or bisexual (5%); 88% say they are straight, 1% say they are something else, 1% say they don’t know and 1% declined to answer the question.
- Just under half of U.S. Jewish adults (45%) have been to Israel. Among Jews in the survey ages 25 to 34, one-quarter say that they have been on a trip to Israel sponsored by Birthright, an organization that provides free travel to Israel for young U.S. Jews.
- Nearly one-in-five Jews say they often (5%) or sometimes (12%) participate in activities or services with Chabad. This is especially common among Orthodox Jews; 46% say they participate in Chabad activities at least sometimes, compared with 25% of Conservative Jews, 12% of Reform Jews and 8% of Jews who do not identify with any particular branch of Judaism.
- Jews continue to have high levels of educational attainment. Nearly six-in-ten are college graduates, including 28% who have earned a postgraduate degree. By way of comparison, about three-in-ten U.S. adults overall are college graduates, including 11% who have earned a postgraduate degree.
- One-in-four American Jews say they have family incomes of $200,000 or more (23%). By comparison, just 4% of U.S. adults report household incomes at that level. At the other end of the spectrum, one-in-ten U.S. Jews report annual household incomes of less than $30,000, versus 26% of Americans overall.
- At the time of the survey (which was mostly fielded before the coronavirus outbreak in the United States), half of U.S. Jews described their financial situation as living “comfortably” (53%), compared with 29% of all U.S. adults. At the same time, 15% of Jewish adults said they had difficulty paying for medical care for themselves or their family in the past year, 11% said they had difficulty paying their rent or mortgage, 8% said they had a difficult time paying for food, and 19% had trouble paying other types of bills or debts.
Roadmap to the report
The remainder of this report explores these and other findings in more detail. Chapter 1 provides estimates of the size of the U.S. Jewish population using various definitions of Jewishness. Chapter 2 examines Jewish identity and beliefs, including affiliation with various branches of Judaism, what U.S. Jews consider essential to being Jewish, and where they find meaning and fulfillment. Chapter 3 explores Jewish practices and customs, including some traditional religious practices (such as synagogue attendance) and some more “cultural” Jewish activities. Chapter 4 looks at marriage and families, including rates of intermarriage, how Jewish survey respondents say they are raising their children, and whether respondents attended Jewish day schools or camps. Chapter 5 delves into measures of community and connectedness, such as how much responsibility U.S. Jews feel toward fellow Jews around the world and how much they say they have in common with other Jews. Chapter 6 describes experiences and perceptions of anti-Semitism, as well as perceived levels of discrimination against other groups in U.S. society. Chapter 7 analyzes U.S. Jewish attitudes toward Israel, prospects for a peace settlement with Palestinians, and the BDS movement. Chapter 8 focuses on U.S. Jews’ political affiliations and views, including on former President Donald Trump, who was still in office when the survey was conducted. Chapter 9 explores measures of race, ethnicity, Jewish heritage and country of origin among U.S. Jews. Chapter 10 describes how Jewish adults answered other demographic questions, including about their age, education, region of residence, fertility and sexual orientation. Chapter 11 looks at measures of economic well-being and vulnerability, including employment status and occupation. And Chapter 12 summarizes the survey’s findings on people of Jewish background and Jewish affinity – two groups that have a connection to Judaism but that are not classified as Jewish for the purposes of this report.
