Pew Research Center conducted analyses not detailed elsewhere in this report to make decisions that shaped projections. This appendix contains an overview of some of these analyses.
Trends in other sources of religious composition data
This report considers how the rapid and continuous rise of religious “nones” in the United States might continue or change in the future. However, in 2021, one report suggested the number may have already begun to decline. To evaluate this possibility, data from the American National Election Survey, Gallup and Public Religion Research Institute (PRRI) was compared with the Pew Research Center and General Social Survey (GSS) trends that form the basis of the report. While each of these data sources have shown occasional small declines in unaffiliated shares from year to year, the common pattern is a steady increase in unaffiliated shares over the decades. What appear to be occasional small declines may be statistical noise, including effects of changing survey and sampling methodologies.

While the unaffiliated share reported by PRRI was lower in 2021 than the organization reported in previous years, PRRI again reported an increasing share of “nones” in 2022. Considering the general trend across surveys and the declining rates of religious affiliation among young cohorts, the preponderance of evidence suggests the share of “nones” is not declining and, as described in the “no switching” scenario of this report, should be expected to grow for demographic reasons alone (e.g., the younger age structure of “nones” compared with the religiously affiliated).
While different surveys show the same general rise of Americans identifying with no religion, scholars have noted that the specific estimate varies across surveys. In 2002, sociologists Michael Hout and Claude Fischer noted that Gallup estimates were lower than estimates from the National Election Study, Pew Research Center and the GSS. They observed, “One important distinction between Gallup and the other surveys: Gallup interviewers accept ‘no religion’ as an answer but do not suggest it to their respondents.” The other surveys offered explicit “no religion” options.26 Gallup has since adjusted its response options, though it continues to have a relatively low estimate of religious “nones.”
International retention
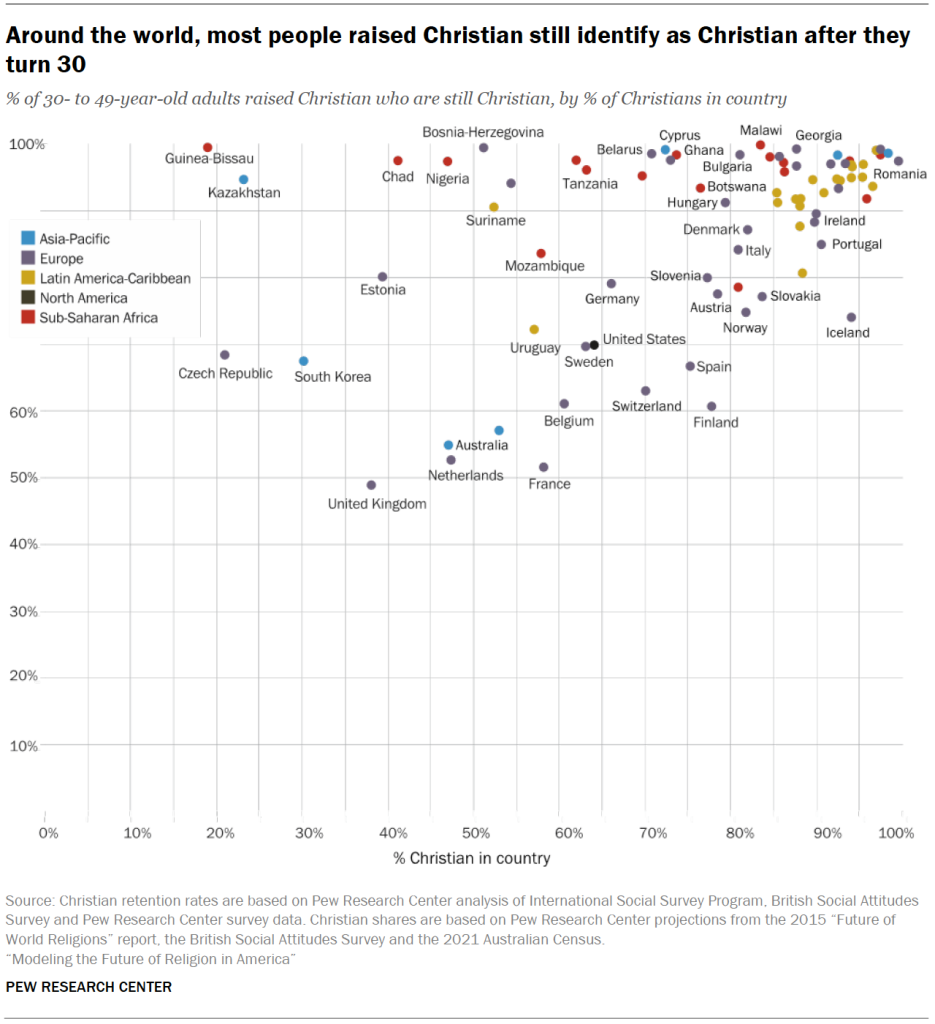
The “rising disaffiliation with limits” scenario imposes a floor of 50% retention for men raised Christian and 55% for women raised Christian. This limit was chosen after an analysis of Christian retention rates in 79 countries outside the U.S. This analysis relied on data from the International Social Survey Program, the British Social Attitudes Survey, and regional Pew Research Center surveys covering sub-Saharan Africa, Latin America, Central and Eastern Europe, and Western Europe. (We analyzed the most recent survey when multiple data sources were available for a country.) Every survey included a question about which religion respondents were raised in as well as a question about their present religious affiliation.
Among people ages 30 to 49, the average country had a Christian retention rate (the percentage of people raised Christian who still identify as Christian) of 87%. The lowest rates of Christian retention were in Great Britain (49%), France (52%) and the Netherlands (53%). Countries with large Christian majorities also tended to have high retention rates, but high retention rates were also found in some countries in which Christians are a minority.

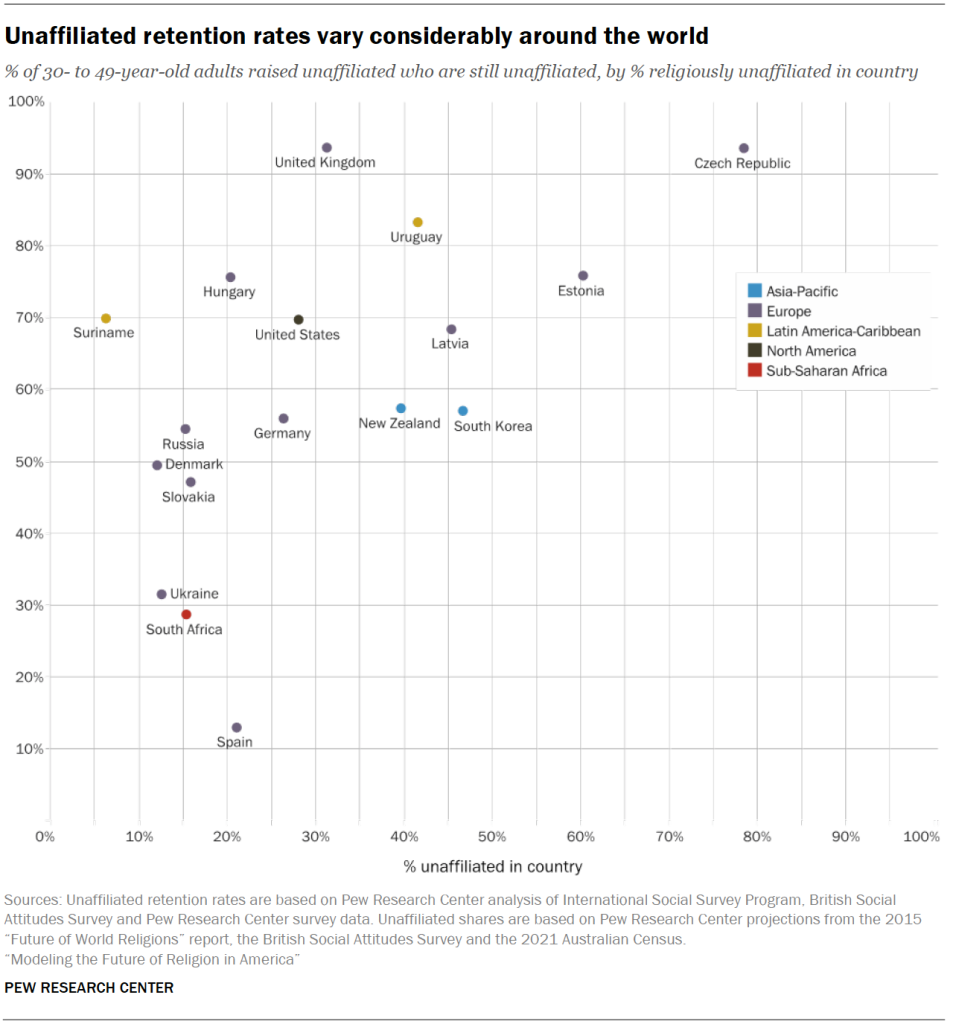
The report’s “rising disaffiliation with limits” scenario also imposes a ceiling for unaffiliated retention at 95%. This threshold arose from a similar analysis of 30- to 49-year-olds in 22 countries (fewer countries had sufficient samples of people who were raised with no religion to analyze). Great Britain and the Czech Republic had the largest shares of people who remained unaffiliated after being raised without a religion, with a little over 95% retention each. Across countries, the average unaffiliated retention rate was 73%.

Disaffiliation after age 30
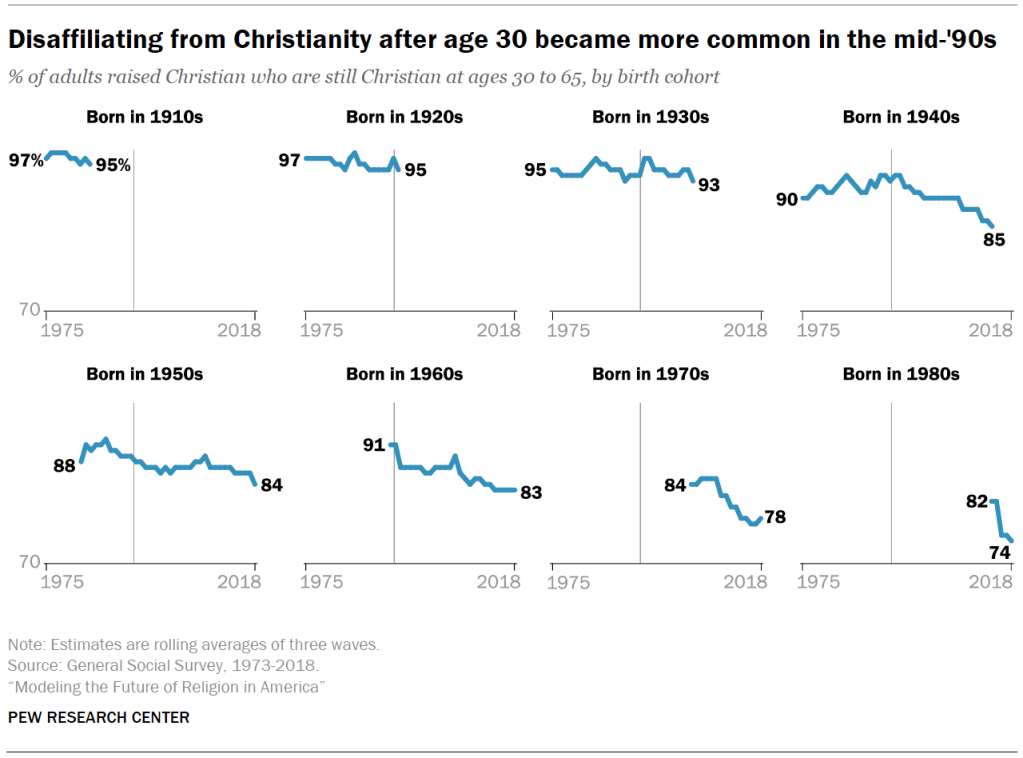
Most scenarios assume that cohorts with members between the ages of 30 and 65 in 2020 will lose 7 percentage points in Christian retention by age 65. This figure is based on an analysis of later switching by 10-year birth cohort. People born in the 1950s, ’60s and ’70s had lost an average of about 7 points in Christian retention between the year their oldest members turned 30 and 2018.27

This pattern of later attrition began in the 1990s among people born in the ’40s and later, at about the same time as the broader trend of disaffiliation from Christianity. It may be based on a period effect in which adults of all ages who were loosely affiliated with Christianity felt free to disaffiliate as the unaffiliated grew in numbers. After this period, switching may return to being almost exclusively a phenomenon of young adulthood, but it is unclear when this period will end.
To get a rough idea of when later attrition could end, we looked for later switching in 21 countries outside the U.S. with sufficient data to compare retention rates across birth cohorts for at least two time points. The best cross-national comparison to the U.S., both in terms of conditions/histories and data quality, come from the British Social Attitudes Survey (BSAS). This social survey is similar to the GSS in sample size, and it has been conducted every year since 1983, but its flaws are outlined in the earlier discussion of data issues. Based on exactly the same method as in the GSS cohort data analysis, the British data shows falling retention by cohort at age 30 (i.e., increases in attrition from Christianity during young adulthood) until retention got down to about 50%, but no attrition from Christianity among people ages 30 and older in any cohort going back to those born in the 1930s. For example, rolling averages of three waves for retention were between 73% and 80% for Brits born in the 1930s and raised Christian in every survey year, with the highest retention rate in 2016. People born in the 1940s started and ended the measurement period with retention rates in the high 60s, and this pattern of consistency held for 60% of people born in the 1950s, 50-57% born in the 1960s, and about 50% for those born in the 1970s and 1980s.
This may indicate that Britain – which became a country where Christian identity could no longer be taken for granted far earlier than the U.S. – reached a floor for attrition among people ages 30 and older by the mid-1990s. Since the British data starts with retention rates in the high 60s to low 70s and none of the cohorts show any substantial drops in retention after age 30, this may be a reasonable threshold at which to assume that switching ends for adults over 30.28
In 20 other countries for which we analyzed smaller sample sizes for larger cohorts over two or three survey waves, there were only two countries where Christian retention was 70% or below and there was still decline within cohort after age 30: People born in the 1950s and early ’60s in France who were raised Christian showed a drop in retention from 56% to 52% between 2008 and 2018 – a relatively small amount of change. The same cohort in Australia, however, declined from 61% to 46% retention. Data for these 20 countries comes from the ISSP, and there are large and difficult to explain fluctuations in some countries, but the patterns in most countries converge with the retention floor suggested by the British data – i.e., the 70% Christian retention floor at which point switching after 30 ends.
After the projections in this report were completed and shortly before the report was released, we became aware of 2021 census data from Australia showing that the count of Christians had dropped among adults of all ages since 2016, though declines were concentrated among young adults. At the same time, the count of religiously unaffiliated Australians had increased among adults of all ages, though this pattern too was concentrated among young adults (see discussion in Appendix A). After reading about these census patterns, we were able to gain access to 2018 ISSP religion module data for Australia that was excluded from the international release of 2018 ISSP religion module data. Australia’s ISSP data confirmed the ongoing decline in retention rates suggested by 2021 census data (see earlier discussion of ISSP results).
If the United States follows Australia’s example of people who were raised Christian continuing to disaffiliate after young adulthood even among cohorts with retention rates below 70% at age 30, then the adult switching patterns included in this report could prove to be conservative. This report introduces new innovations in projections of the religious future of the United States. We hope future studies will build on this work, taking advantage of new data that will become available in the years ahead.


