

Like the country’s overall population, many U.S. religious groups have experienced a decline in the share of adults who identify as White, according to the 2023-24 Religious Landscape Study (RLS).
Today, 61% of U.S. Christians are non-Hispanic White, compared with 66% in 2014 and 70% in 2007. There has been a similar decline in the share of White adults in the religiously unaffiliated category.87
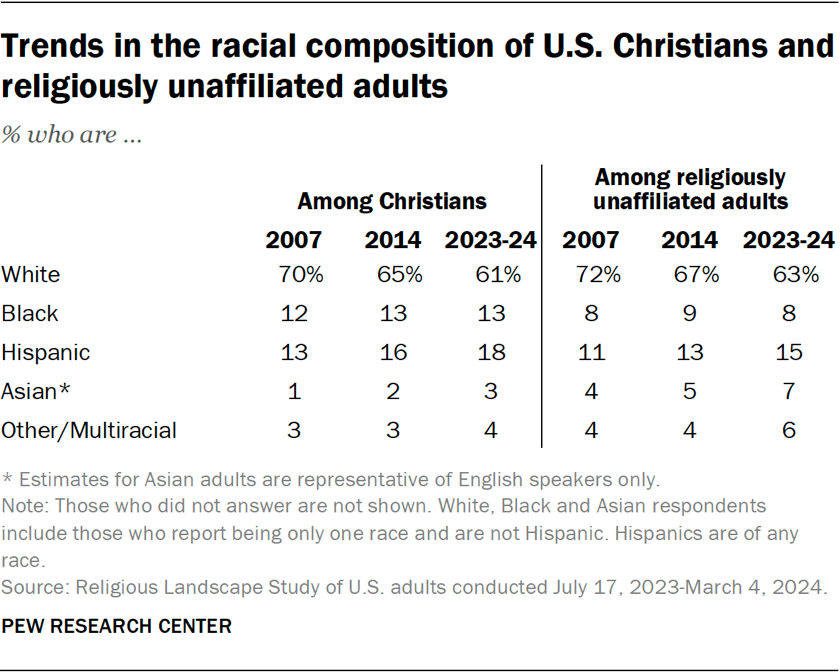
Meanwhile, there has been growth or stability in the shares of Christians who identify as Black, Hispanic or Asian.88
For example, Hispanic Americans now make up 18% of Christians, compared with 13% in 2007. And Asian Americans now make up 7% of the religiously unaffiliated, compared with 4% in 2007.
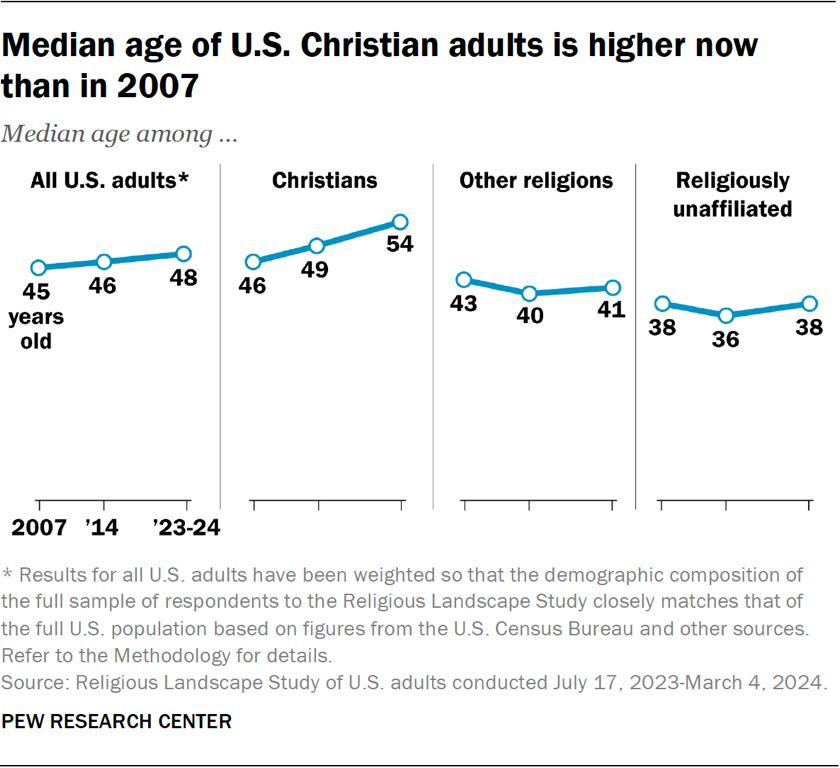
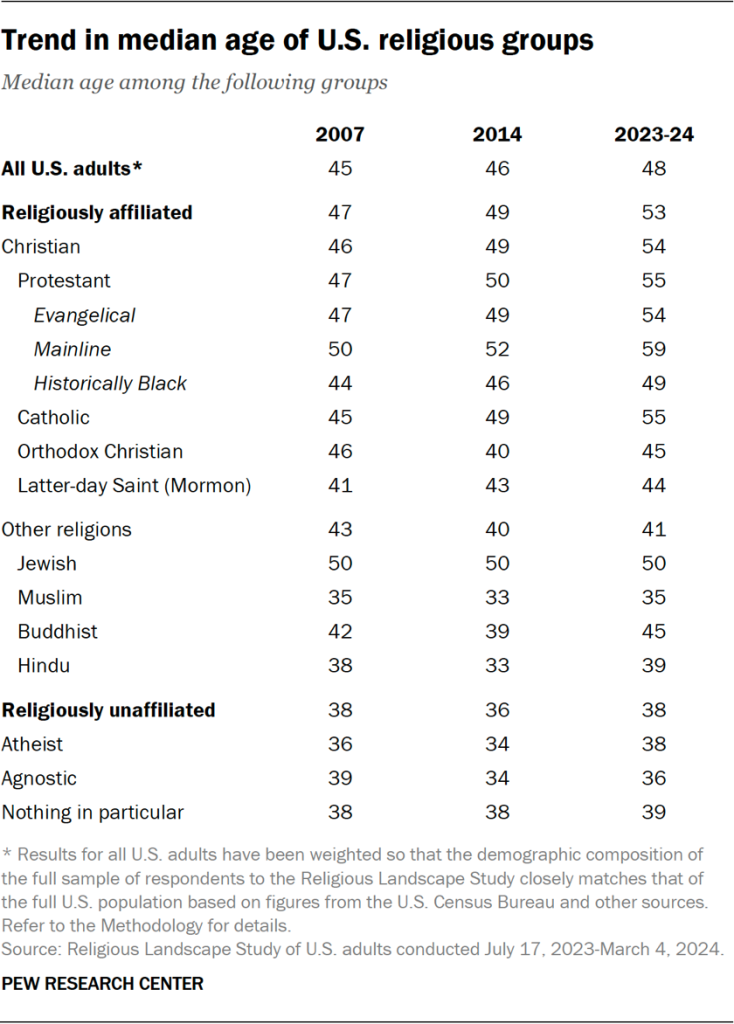
There have been other demographic changes as well. The median age of Christians has risen to 54, from 49 in 2014 and 46 in 2007. The median age of adults who identify with other religions is lower (41) and has not changed much since 2014 and 2007. The median age of religiously unaffiliated adults in the new survey is 38, which also is in line with both 2014 and 2007.
Women continue to make up a majority of Christians. But, today, women also account for nearly half of all religiously unaffiliated Americans (47%). In the 2007 and 2014 Religious Landscape Studies, the religiously unaffiliated population was composed much more heavily of men than of women.
Read on for more details about the demographic traits of U.S. religious groups:
- Race and ethnicity
- Immigration and region of birth
- Citizenship and civic engagement
- U.S. geographic distribution
- Age
- Gender and sexual orientation
- Education
- Income and employment status
Race and ethnicity
Many of the country’s large religious groups – including evangelical Protestants, mainline Protestants and Catholics – continue to have White, non-Hispanic majorities. So does the country’s religiously unaffiliated population. Among “nones” – i.e., people who answer a question about their current religion by saying they are atheist, agnostic or “nothing in particular” – 63% identify as non-Hispanic White.
Among evangelical Protestants, 70% are White, 12% are Hispanic and 7% are Black. Among mainline Protestants, 79% are White and 6% each are Black or Hispanic. Members of the historically Black Protestant tradition continue to be predominantly Black, though about 3% of U.S. adults who affiliate with that tradition identify as White and 4% are Hispanic.
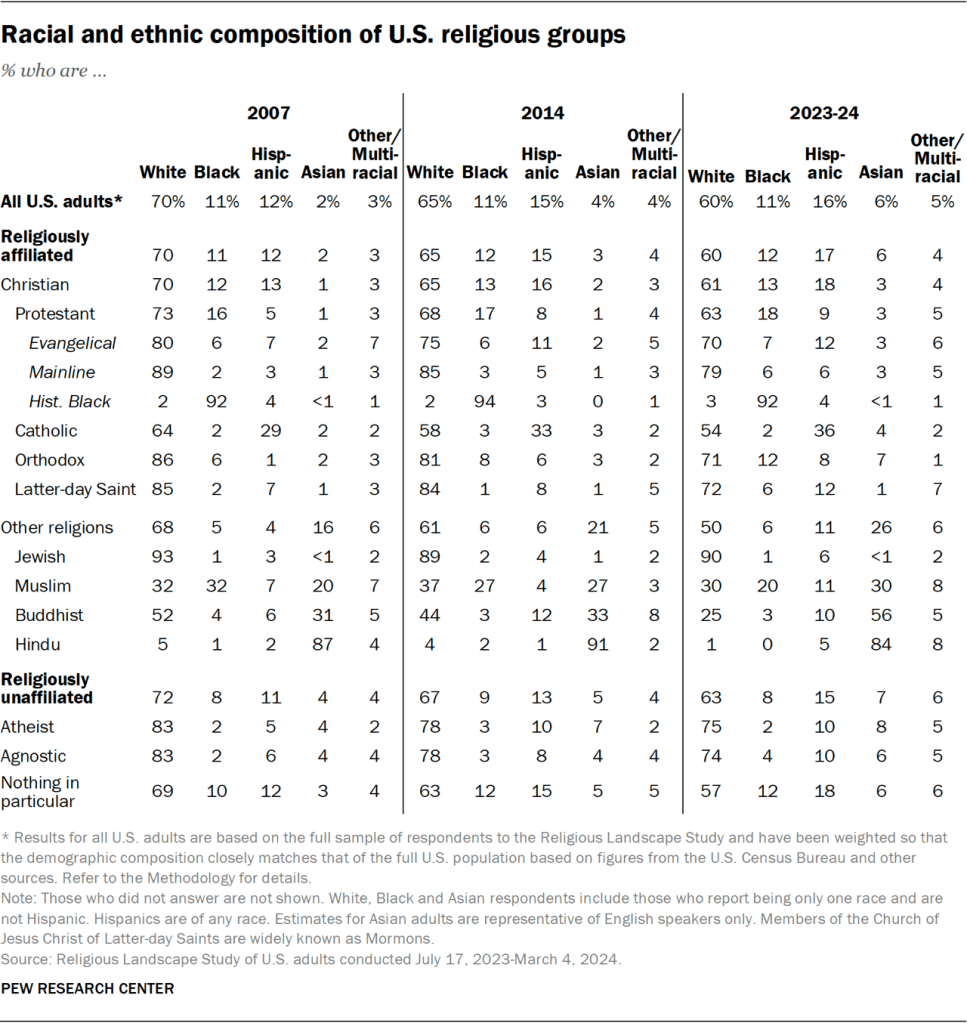
Among U.S. Catholics, the share of Hispanic adults has increased from 29% in 2007 to 36% in the 2023-24 Religious Landscape Study (RLS).89 U.S. Jews remain predominantly White and non-Hispanic (90%).90
Meanwhile, 84% of Hindus are Asian, as are 56% of Buddhists. Among U.S. Muslims, 30% are Asian, 30% are White, 20% are Black, 11% are Hispanic and 7% are multiracial or identify with another race. White Americans make up roughly three-quarters of adults who identify as atheist (75%) or agnostic (74%), but just 57% of adults who identify religiously as “nothing in particular.”
Immigration and region of birth
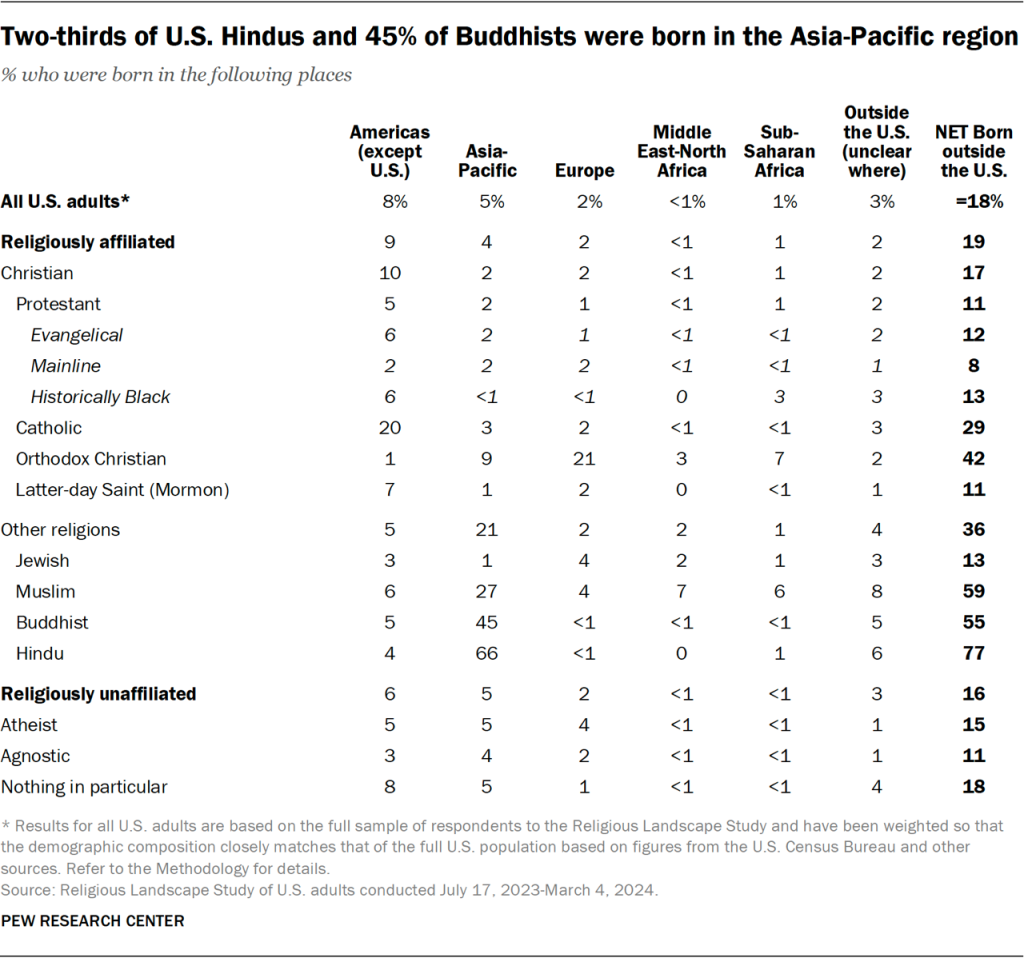
Immigrants make up much higher percentages of some non-Christian religions than they do of U.S. Christians.91
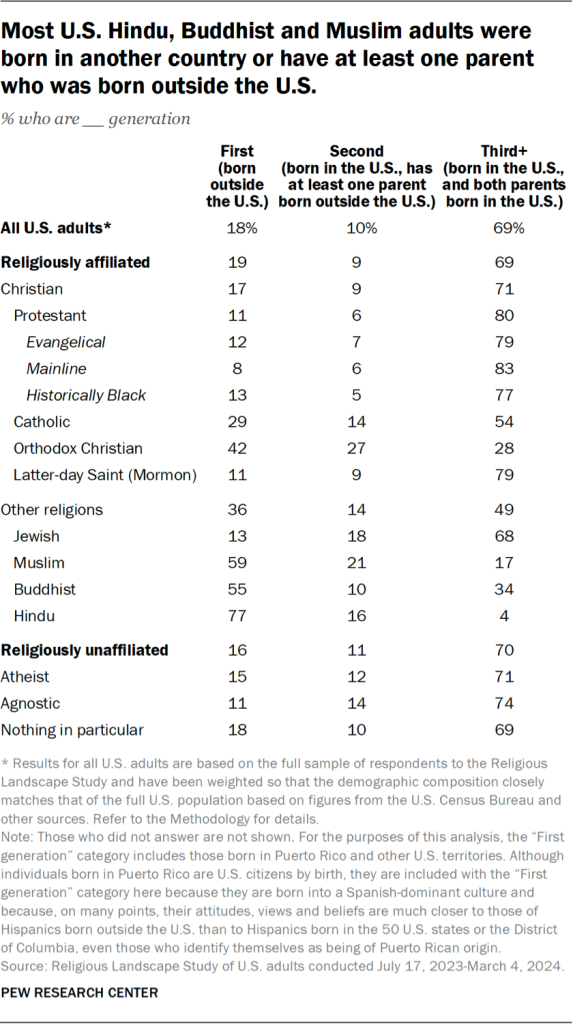
People born outside the United States account for notably large shares of Hindus (77%), Muslims (59%) and Buddhists (55%). Foreign-born Hindus and Buddhists most often were born in the Asia-Pacific region, while Muslim immigrants’ regions of origin are more varied.
Orthodox Christians also include a relatively high percentage of immigrants (42%), including 21% who were born in Europe. An additional 27% of Orthodox Christians have at least one parent who was born outside the U.S.
Much smaller shares of Christians as a whole (17%), the religiously unaffiliated (16%) and Jews (13%) were born outside the U.S. Most Christians, Jews and religiously unaffiliated Americans say their families have been in the U.S. for at least three generations.
(Read more about the religion of immigrants to the U.S. in our recent report “The Religious Composition of the World’s Migrants.”)
Citizenship and civic engagement
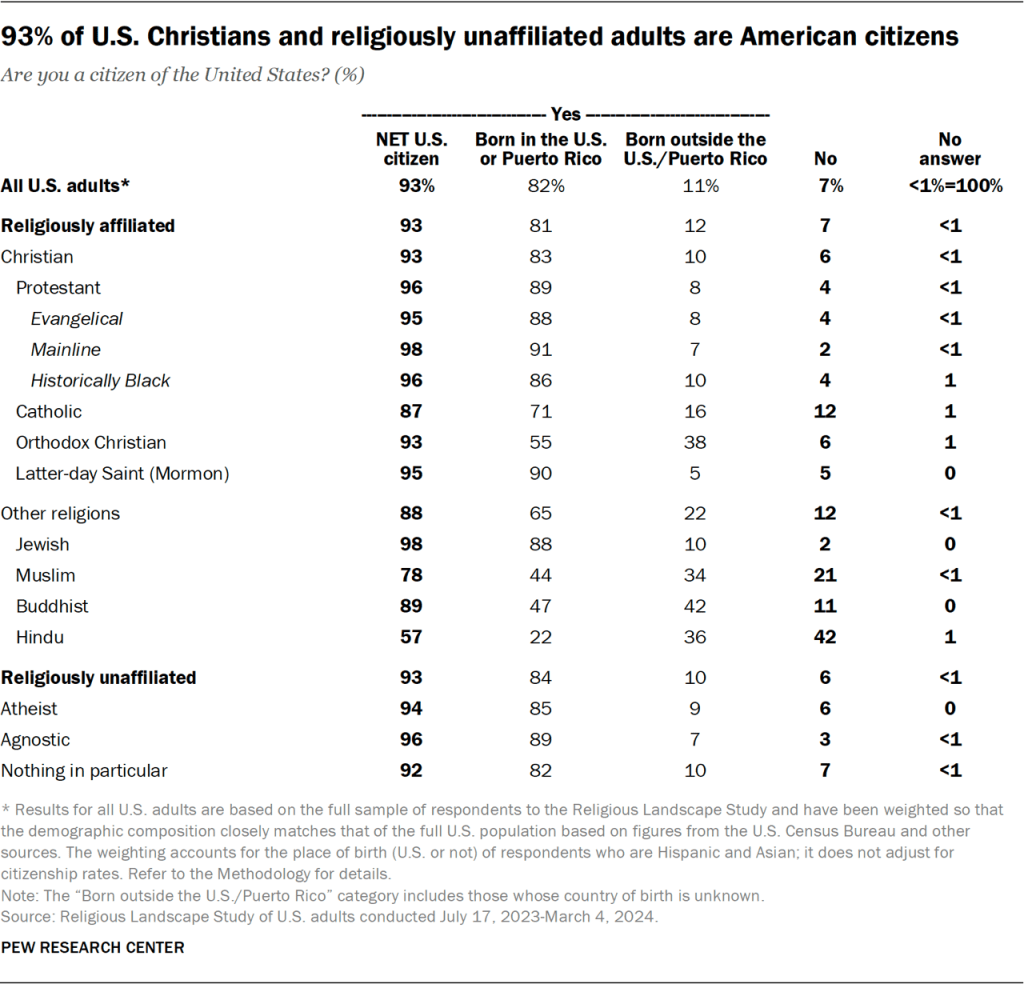
Citizenship
Most U.S. religious groups are comprised largely of U.S. citizens. This includes majorities of Jews (98%), Christians (93%), Buddhists (89%) and Muslims (78%). Hindus (57%) living in the United States are less likely to be U.S. citizens.
Voter registration
About three-quarters of Christians and Jews are registered to vote, as are roughly two-thirds of religiously unaffiliated adults.
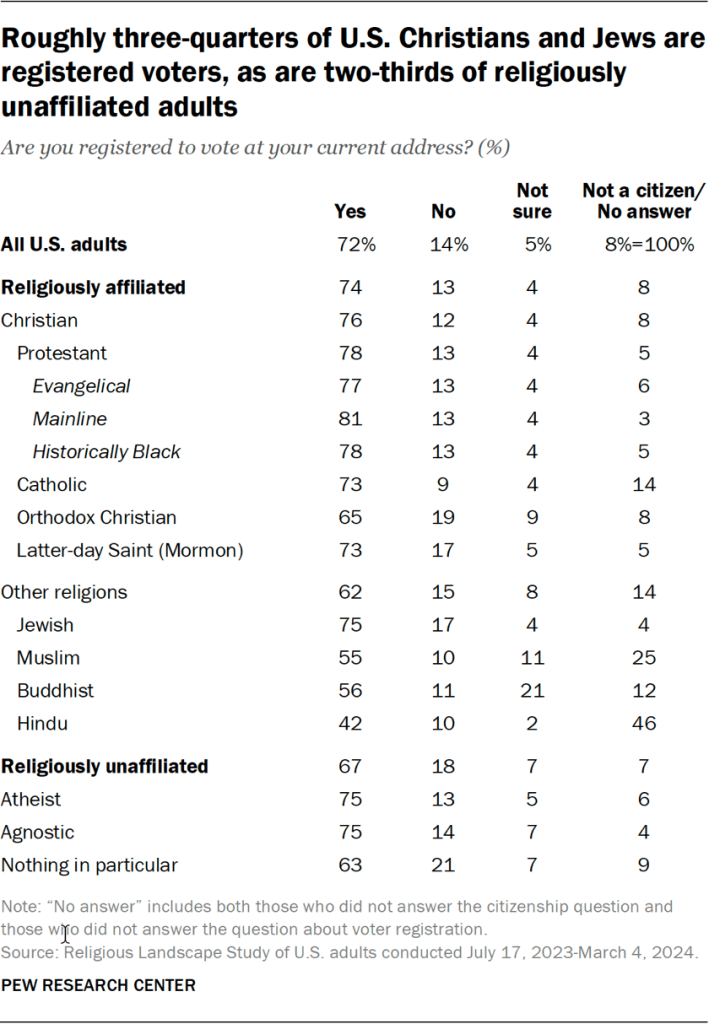
The survey finds that 56% of Buddhists, 55% of Muslims and 42% of Hindus are registered to vote. The share of Buddhists who say they are not sure if they are registered to vote stands at 21% – higher than among other groups.
Relatively large shares of Muslims and Hindus indicate that they are not citizens and so are not eligible to vote.
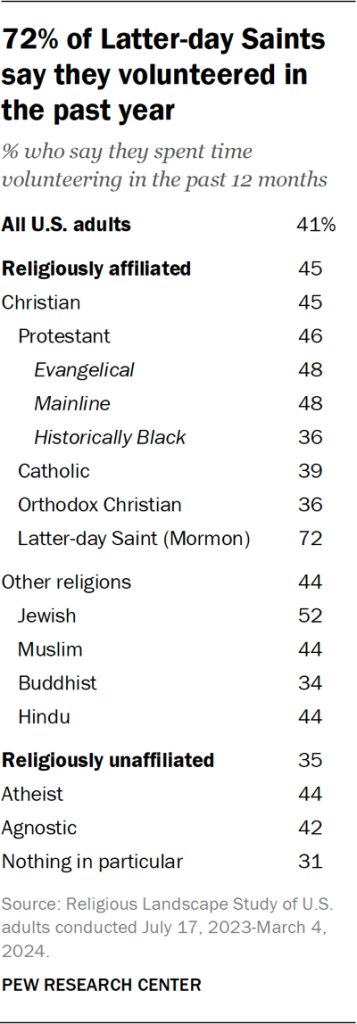
Volunteering
Members of the Church of Jesus Christ of Latter-day Saints (widely known as Mormons) are the only group in this analysis with more than half of adults who say they have volunteered for any organization in the past 12 months (72% say this).
U.S. geographic distribution
Overall, 42% of U.S. Christians live in the South. That includes 64% of adults in the historically Black Protestant tradition and 52% of evangelical Christians.
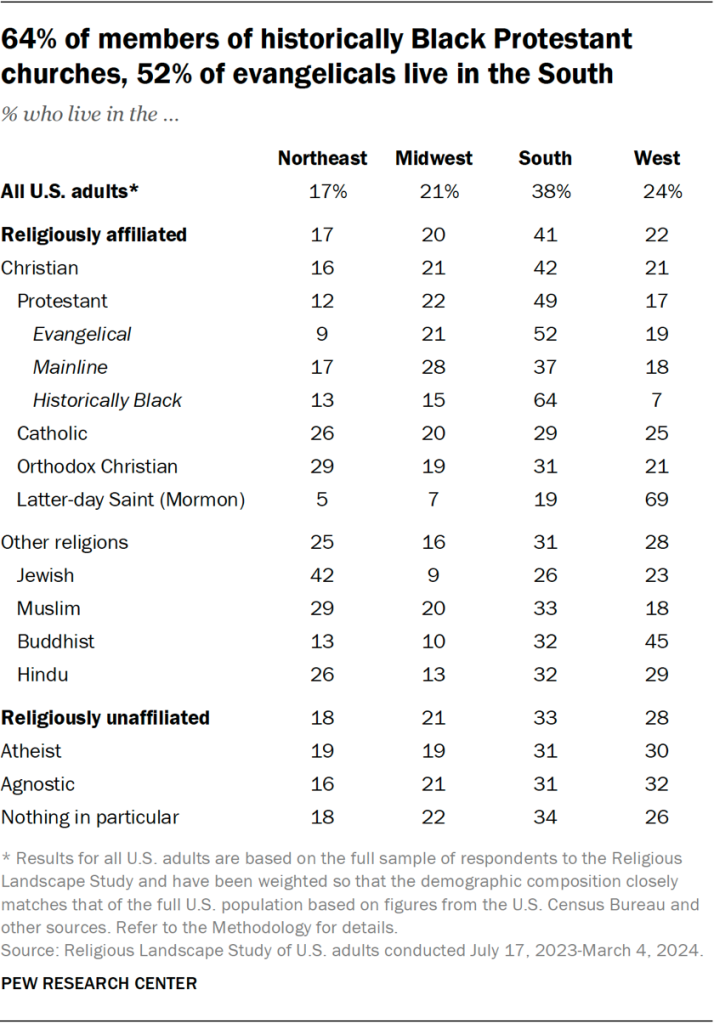
Roughly seven-in-ten Latter-day Saints live in the West, as do around half of Buddhists.
About four-in-ten Jews (42%) live in the Northeast.
Religiously unaffiliated adults are less likely than Christians to live in the South.
Age
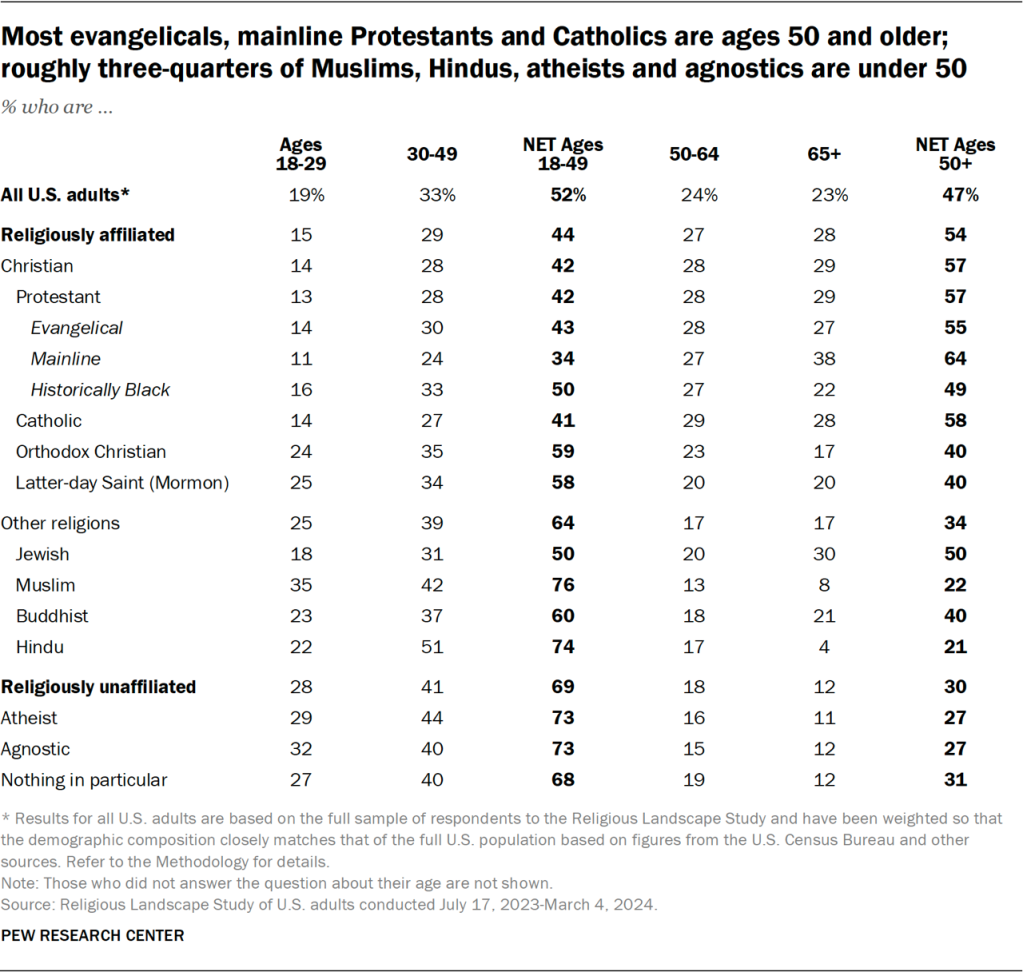
Mainline Protestants, Catholics and evangelical Protestants are among the country’s oldest religiously affiliated populations. People ages 50 and older make up a majority of mainline Protestants (64%), Catholics (57%) and evangelical Protestants (54%).
Muslims and Hindus are much younger, on average, than other U.S. religious groups: About three-quarters of adults in each group are under 50. And a third of U.S. Muslim adults are younger than 30.
The country’s religiously unaffiliated population is relatively young as well. Roughly seven-in-ten U.S. adults with no religion are under 50, compared with 44% of religiously affiliated adults.
The median age of Christians overall has risen from 46 in 2007 to 54 in 2024. This is a trend that can be seen within most of the Christian subgroups large enough to analyze in this survey.
Among the religiously unaffiliated and adherents of non-Christian religions, the median age has remained relatively stable since 2007.
Gender and sexual orientation
Most Christian groups in this analysis have more women than men. The gap is widest among members of historically Black Protestant churches (64% women, 35% men).
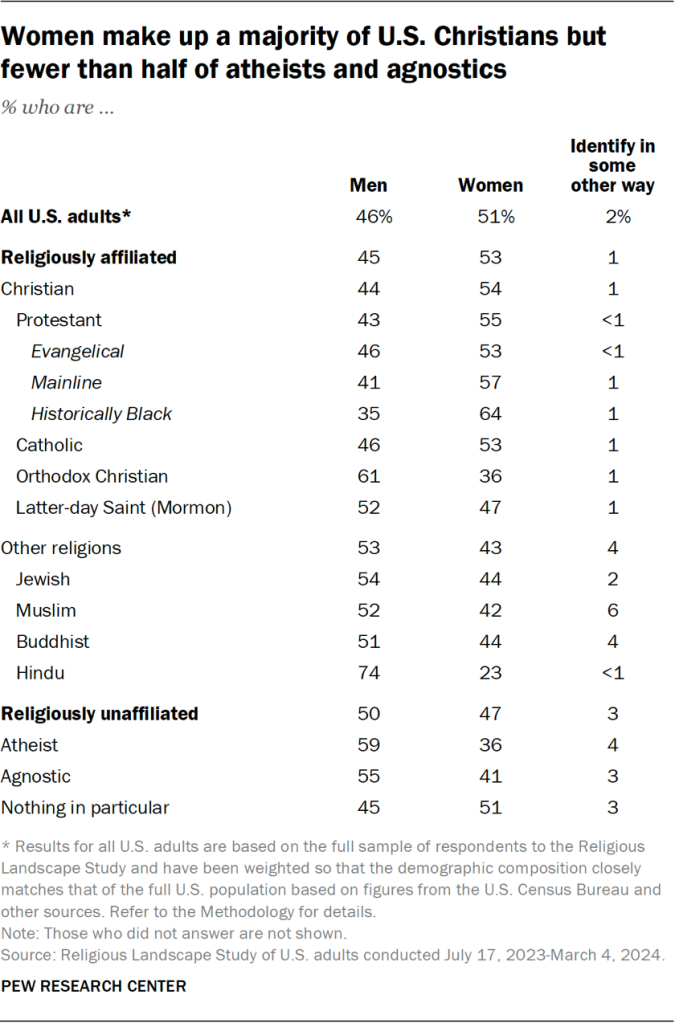
On the other hand, atheists and agnostics have greater shares of men than women.
Surveys consistently show that in the U.S., women, on average, are more religious than men on a variety of measures. (Read more about the connections between gender and religiousness in the report Overview.)
At the same time, the gender ratio of the religiously unaffiliated has become more balanced over time. In 2007, about 41% of religiously unaffiliated adults were women, while 59% were men. Today, 47% of unaffiliated Americans are women, 50% are men and 3% identify in some other way (an option that was not available in the 2007 and 2014 Religious Landscape Studies).92
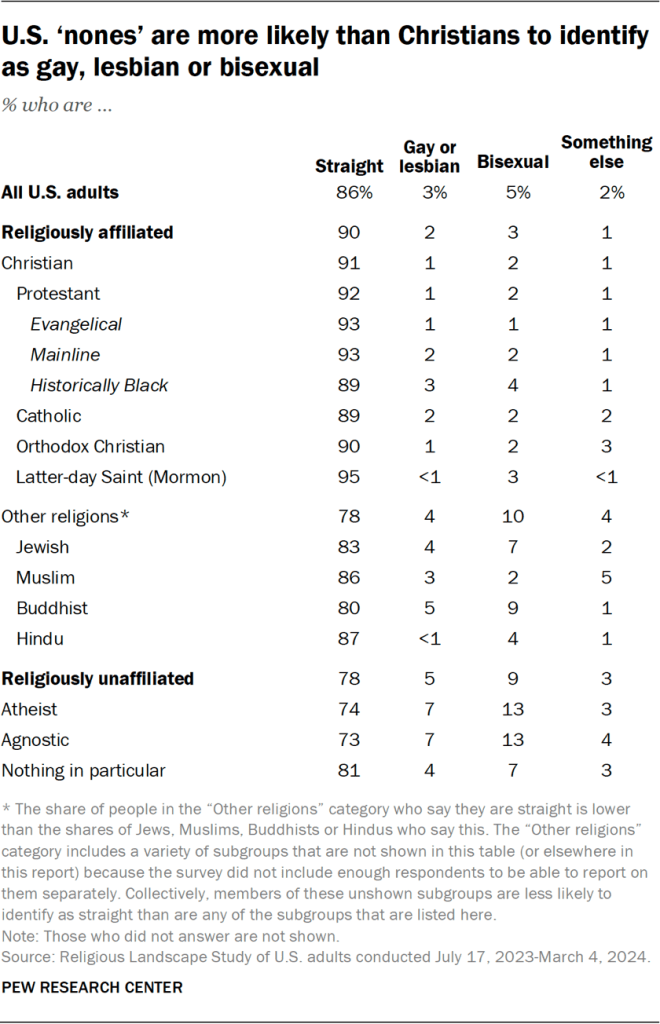
There are more men than women among Jewish, Muslim and Buddhist respondents in the survey. However, given the relatively small samples sizes of these groups, the shares of these groups who are men are not statistically significantly larger than the shares who are women.93
In terms of sexual orientation, atheists and agnostics are notably more likely than other U.S. adults to describe their sexual orientation as gay, lesbian or bisexual.
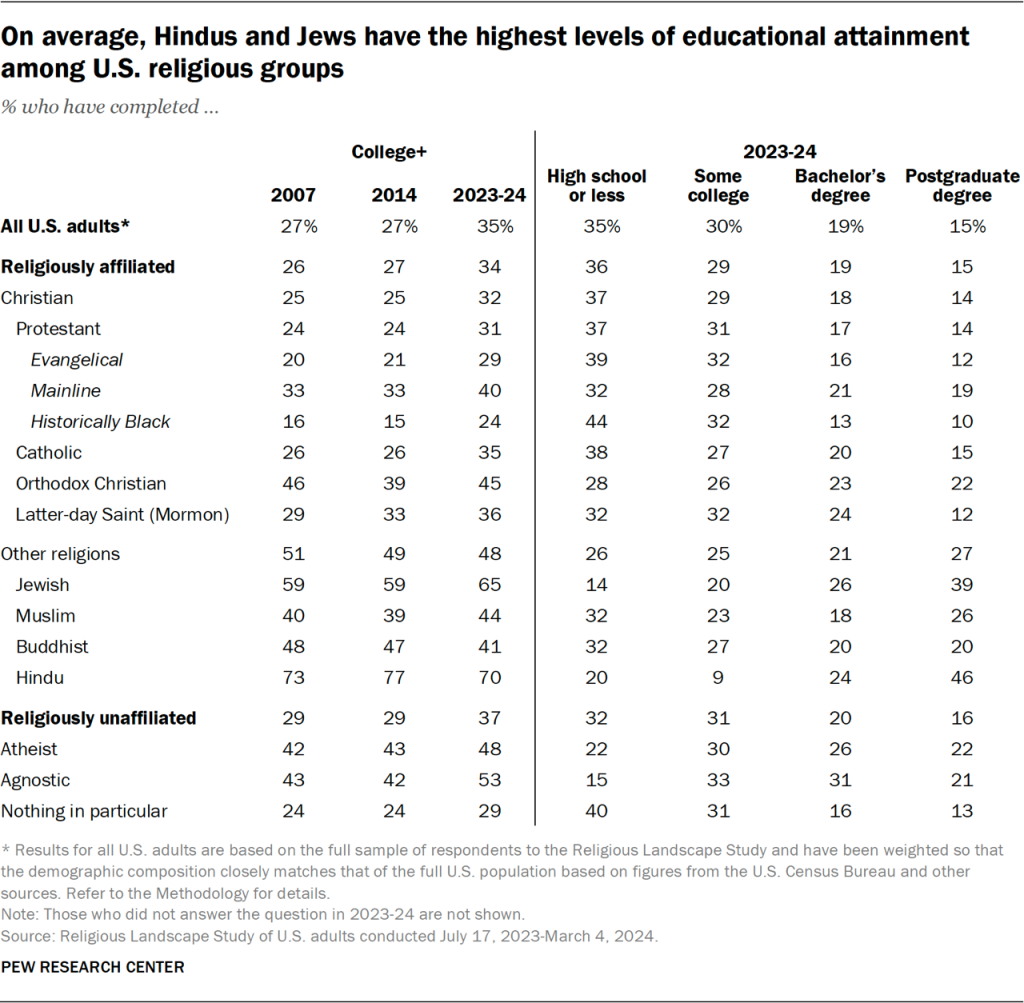
Education
Hindus and Jews are, on average, the most highly educated religious groups in the U.S. Roughly seven-in-ten Hindus and two-thirds of Jews have a bachelor’s degree or more education.
Roughly half of agnostics (53%) and atheists (48%) have a bachelor’s degree or more education, as do 32% of Christians.
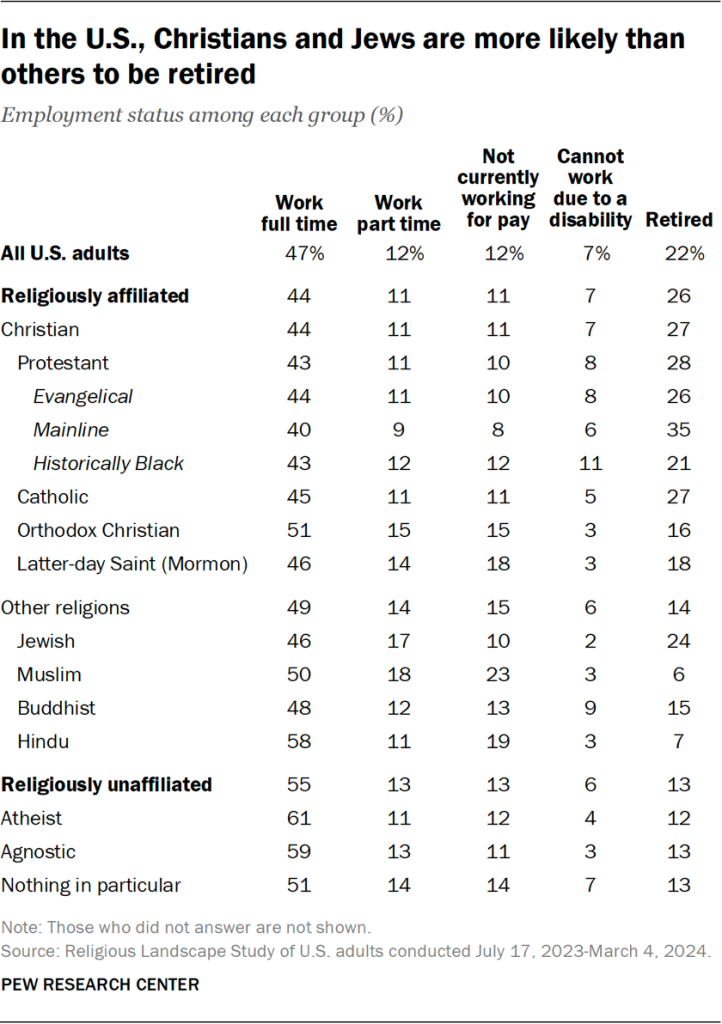
Income and employment status
Of the religious groups in this analysis, Hindus and Jews tend to have the highest family incomes. Roughly half or more of adults in each of these two groups report an annual household income of $100,000 or more.
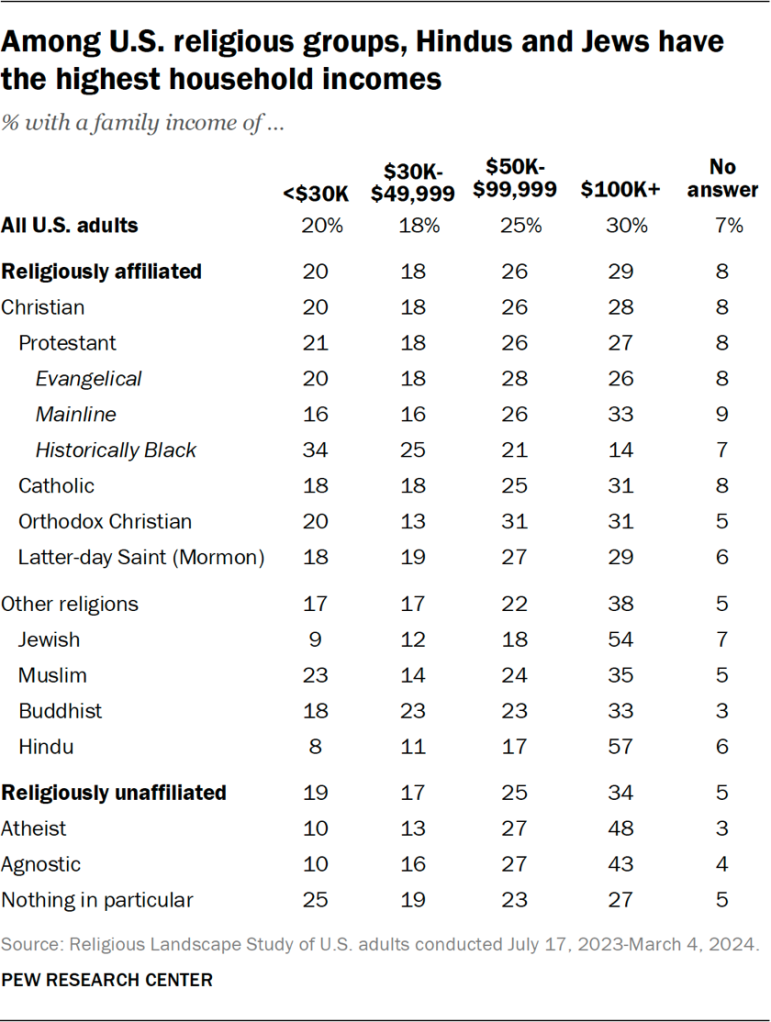
Additionally, roughly three-in-ten Catholics and mainline Protestants report annual household incomes of $100,000 or more.
Relatively few members of historically Black Protestant churches (14%) are in this highest income bracket.
Among religiously unaffiliated Americans, 48% of atheists and 43% of agnostics have a household income of $100,000 or more.
Among religiously unaffiliated adults, 55% are currently working full time for pay, as are 58% of Hindu adults. Half of Muslim adults are working full time, as are 48% of Buddhists, 46% of Jews and 44% of Christians.
About a quarter of Christians (27%) and Jews (24%) are retired. Christians and Jews also are among the religious groups most likely to be ages 65 or older.
CORRECTION (Sept. 29, 2025): A previous version of this report included an incorrect value for the median age of Christians overall in 2024, which has since been updated. This change does not substantively affect the findings of this report. The figures shown in the accompanying graphic were correct and remain unchanged.


