
Pew Research Center has tracked trends in American religion since 2007 via the Religious Landscape Study (RLS) and since 2020 using the annual National Public Opinion Reference Survey (NPORS). But the RLS and NPORS are hardly the only sources of survey data on religion in the United States. Among others, the General Social Survey (GSS) and Gallup also ask questions about Americans’ religious identity, beliefs and practices – and have done so for decades.106
Surveys by Pew Research Center, GSS and Gallup all find declines on several religion measures over the past two decades, including a decline in the percentage of U.S. adults who identify as Christians and a corresponding rise in the percentage who say they have no religion. But the data from these three sources is less clear and uniform about what has happened in the last few years, since about 2020.
This appendix explores the long-term and short-term patterns in RLS, GSS and Gallup polls on questions about:
- Identifying as Christian
- Identifying as religiously unaffiliated
- Attending religious services
- Considering religion personally important
- Praying daily
- Believing in God
It also explores trends in religion by birth cohort, and provides methodological details about the GSS and Gallup surveys.
About the surveys
The GSS is a national survey of American adults conducted by NORC at the University of Chicago since 1972. It generally has been conducted every two years since the 1990s. Through 2018, GSS data was collected mostly through in-person interviews. Due to the COVID-19 pandemic, the GSS was not fielded in 2020. The 2021 GSS was conducted mainly online, supplemented by telephone.
The 2022 GSS was administered to respondents using three modes: in person, online and by phone.
Gallup also asks questions about religion. Although Gallup has an online panel, most interviews for its U.S. polls are still conducted by telephone.
The Center’s 2023-24 Religious Landscape Study was fielded from July 17, 2023, to March 4, 2024, and has a sample size of 36,908. Respondents were given the choice to complete the survey online, by mail or over the phone with an interviewer. The 2007 and 2014 landscape studies were conducted entirely by telephone and included nationally representative samples of around 35,000 respondents each.
These organizations do not always measure the same religious topics, nor do they employ identical methods or question wording. In addition, the Center and the GSS have made “mode shifts” in recent years, switching from having a live person ask the questions (and record the answers) to administering at least some of their surveys online. Mode shifts can affect how respondents answer even identically worded survey questions. Consequently, this appendix focuses mostly on the overall direction of the trends.
Share of U.S. adults who are Christian
For many years, all three data sources agreed on the broad trend: The share of Americans who identify as Christian (of all varieties) was declining. In the 1970s, both Gallup and the GSS found that around nine-in-ten U.S. adults were Christian. By 2014, both Gallup and the GSS found that Christians made up 73% of the adult population, and the 2014 RLS estimate was 71%.107

In recent years, results from Pew Research Center surveys indicate that the share of Americans who say they are Christian may be leveling off. The 2023-24 RLS finds that Christians make up 62% of U.S. adults. That is clearly lower than in the 2007 and 2014 landscape surveys – in line with the long-term trend – but in the middle of recent annual estimates from the Center’s National Public Opinion Reference Survey. This survey (NPORS) has found the Christian share hovering between 60% and 64% each year since 2020. Refer to Chapter 1 for more about religious affiliation in NPORS.
Gallup, meanwhile, consistently found between 69% and 71% of U.S. adults identifying as Christian between 2017 and 2022, with no clear decline over that period. In 2023, Gallup’s figure ticked downward to 68%.
The GSS found that 62% of Americans identified as Christian in 2021, and that 64% did so in 2022. It is difficult to say, though, whether the GSS finds the same kind of leveling off in the Christian share of the population that is evident in Pew Research Center surveys. Both the 2021 and 2022 GSS produced substantially lower estimates of the Christian share of the population compared with the 2018 GSS. But the GSS underwent major changes between 2018 and 2021/2022, which complicates comparisons across waves. In 2018 and prior years, the GSS was mostly conducted face-to-face, whereas the 2021 GSS was conducted online with a telephone supplement, and the 2022 GSS was done using three modes: in person, online and by phone.
Additionally, the 2021 and 2022 figures are the only two GSS data points available after 2018 (as of the time this appendix was written in January 2025). The GSS was not conducted in 2019, 2020 or 2023, and GSS results for 2024 have not yet been released.
Share of U.S. adults who are religiously unaffiliated
All three polling organizations have found a similar rise in the share of religiously unaffiliated adults, also known as religious “nones” over the past few decades. These are people who identify as atheist, agnostic or as “nothing in particular” in Pew Research Center surveys, and as having “no religion” in the GSS and Gallup surveys.
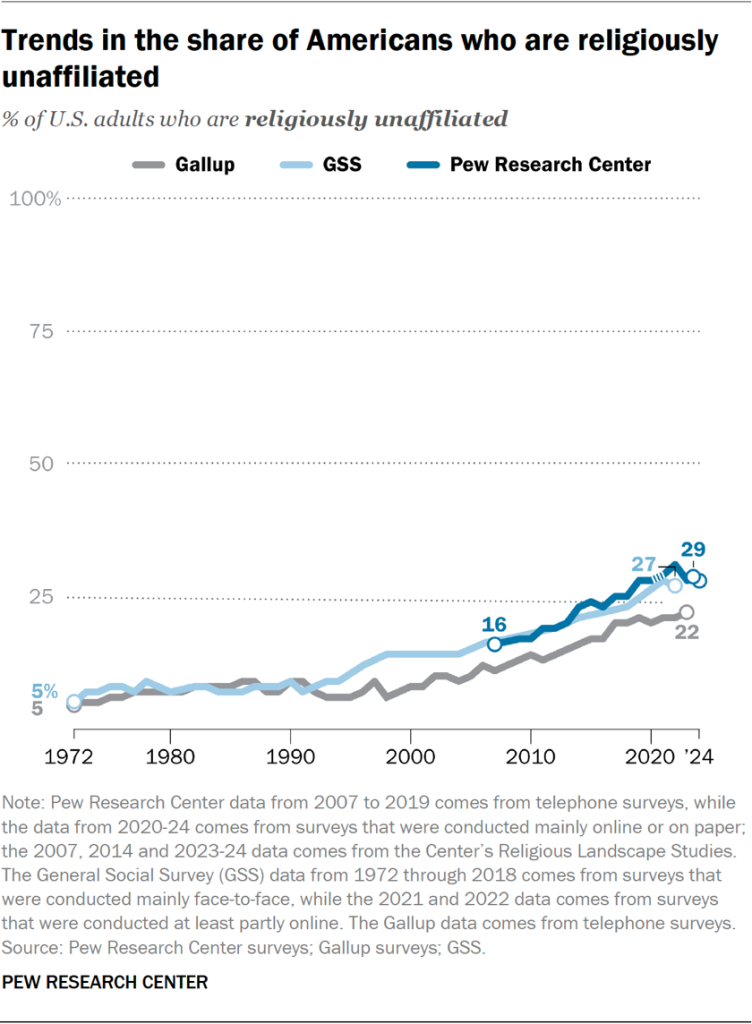
In the 1970s, Gallup and the GSS showed that about one-in-ten or fewer U.S. adults chose not to identify with any religion. By 2014, Gallup’s estimate of the size of the unaffiliated population had risen to 16%. The GSS found a higher share at 21%, and the 2014 Religious Landscape Study reported that the proportion was 23%.108
More recently, Pew Research Center surveys suggest that the rise of the “nones” may be slowing. Between 2019 and 2024, the Center’s surveys consistently find that 28% or 29% of U.S. adults are religious “nones.” The only exception is the 2022 NPORS, which put the religiously unaffiliated figure at 31%. Read Chapter 1 for more about religious affiliation in NPORS.
Gallup’s estimate of the size of the religiously unaffiliated population held fairly steady between 2017 and 2022, at 20% or 21% each year. In 2023, it was 22%.
The GSS tracked a steady rise in the religiously unaffiliated share of the population from the 2000s through the 2010s and reported that 23% of Americans said they had no religion as of 2018. There was no GSS in 2020. In the 2021 GSS, the share who identified as religiously unaffiliated jumped to 28%, and in 2022 it was 27%. These higher figures may be a result of the GSS’s switch in mode from mostly face-to-face interviews before the COVID-19 pandemic to a mix of in-person, online and phone modes afterward.
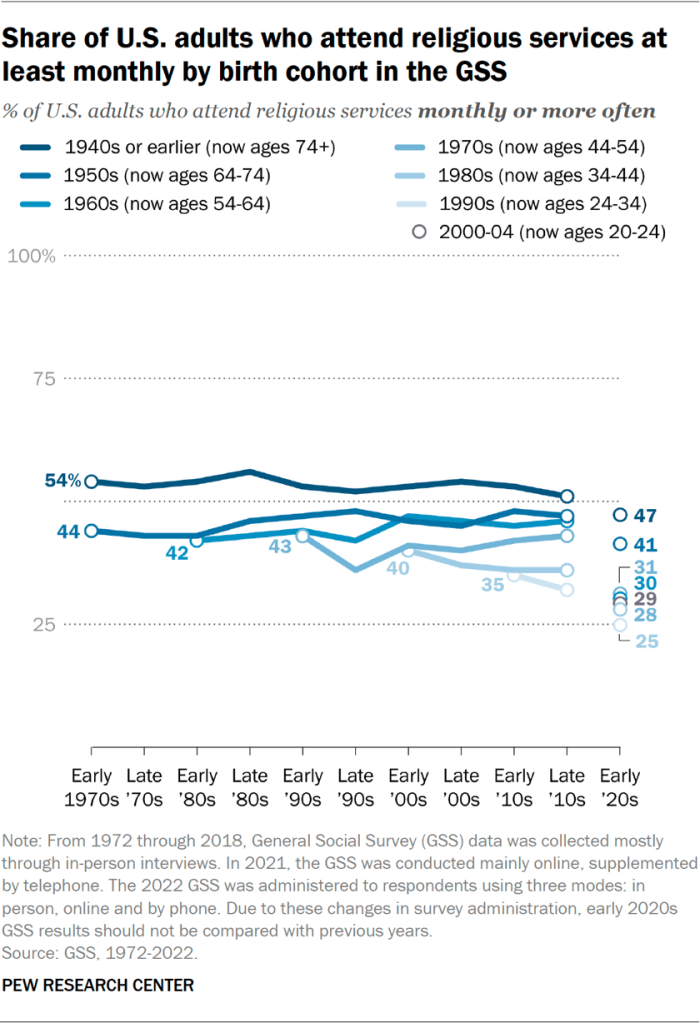
Share of U.S. adults who attend religious services
Both Gallup and the GSS show a long-term decline in attendance at churches and other houses of worship. Because of the “mode switch” from telephone polling to interviewing respondents mostly online and on paper, Pew Research Center does not have a long-term trend on this measure.
In recent years, Gallup’s telephone polls show a continuing decline in the percentage of U.S. adults who regularly attend religious services, while the GSS – like the Center – has made methodological changes that cloud the picture.
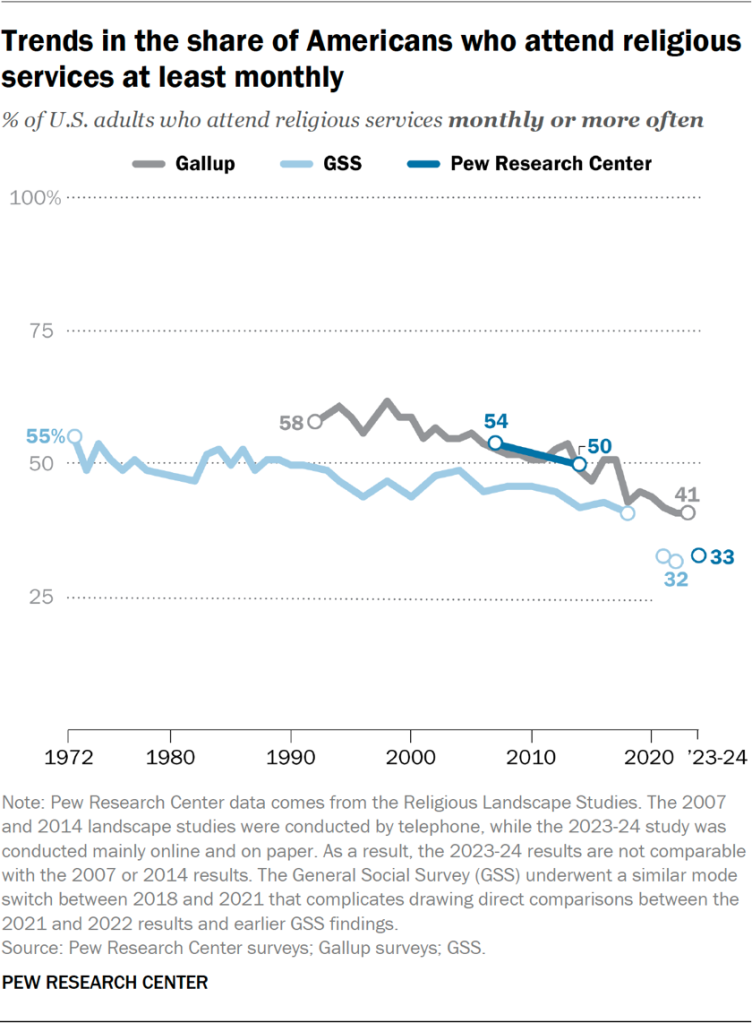
Between 2007 and 2014, the Center’s first two Religious Landscape Studies found a dip in the share of Americans who said they attended religious services at least monthly, from 54% to 50%. However, we cannot directly compare those figures with the new RLS, because of changes in how we asked about attendance and in how the survey was administered.
In the wake of the COVID-19 pandemic, the new RLS asks about religious service attendance by posing two questions, asking Americans how often they attend religious services in person and, separately, how often they watch services online or on TV. (The figures shown in the accompanying chart are responses to the question specifying attendance in person.)
In 2007 and 2014, the RLS asked a single question – “How often do you attend religious services?” – without differentiating between virtual and in-person participation. In addition, the 2007 and 2014 landscape surveys were conducted entirely by telephone, while the 2023-24 survey was conducted mainly online and on paper. Research shows that telephone surveys tend to produce higher estimates of religious attendance than web/paper surveys do.
Because of these changes, the results of the 2023-24 RLS on religious service attendance are not directly comparable with the prior landscape studies. What might appear to be a sharp drop from 50% of U.S. adults describing themselves as regular (at least monthly) attenders in 2014 to 33% describing themselves that way in 2023-24 does not necessarily reflect a real change in behavior. The difference between the two surveys is caused, at least in part, by changes in the way they were conducted.
Like the RLS, the GSS has changed its methods in recent years. Through 2018, it consisted mostly of in-person interviews, but the 2021 GSS was conducted online, and in 2022 the GSS was available to respondents in three modes: in-person, online and by phone.
When the GSS first started asking about religious service attendance in 1972, 55% of Americans said they attended services at least monthly. In 2006 and 2008, the GSS found that 45% and 46%, respectively, attended religious services monthly, as did 42% in 2014. In the 2021 survey – which was conducted online during the COVID-19 pandemic and potentially subject to period and mode effects – and in the 2022 survey, the GSS found that 32% of U.S adults attended religious services monthly or more often.
Gallup’s telephone polls also have reported a steady long-term decline in monthly attenders, from 58% in 1992 to 53% in 2007 and 49% in 2014. Over the last five years or so, Gallup found a continuation of the downward trend, from 45% in 2019 to 41% in 2023.
Share of U.S. adults who consider religion important to them
Starting in the early 1990s, Gallup found that nearly six-in-ten Americans said religion was very important to them. That figure began dropping in the 2000s, falling to 53% in 2014 and 45% in 2023.
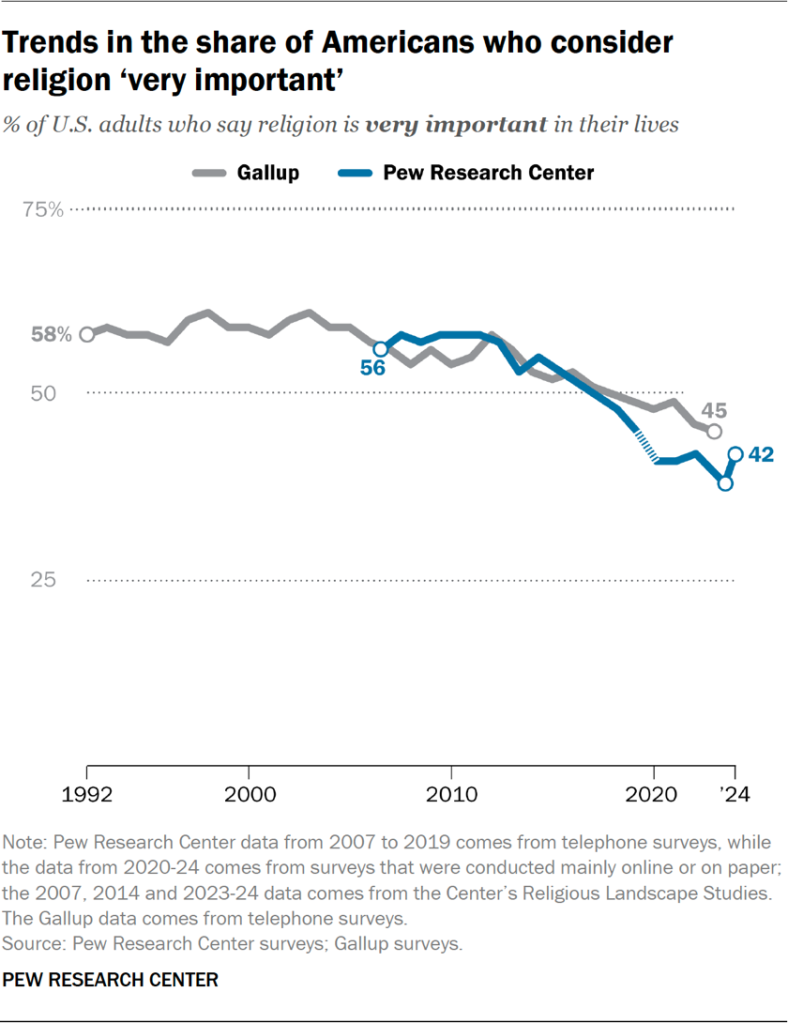
In Pew Research Center’s 2007 RLS, 56% of Americans said religion was very important in their lives. That figure dipped to 53% in 2014 and then fell to 38% in the latest RLS. However, results from the Center’s NPORS indicate that the share of Americans who consider religion to be very important may have leveled off in recent years, at 41% in 2021, 41% in 2022, 42% in 2023, and 42% in 2024. The gap between the 2023-24 RLS and the results from the recent NPORS may be due to “context effects.” In other words, it’s possible that the order of questions in the RLS effectively prompts respondents to think about their religious identity, beliefs and practices before asking them how important religion is in their lives. NPORS contains fewer questions about religious beliefs and practices, and therefore may elicit a different response about the importance of religion in a respondent’s life.
Additionally, responses to the question about the importance of religion – like the question about attendance at religious services – may be affected by the change in survey mode. Unlike the 2007 and 2014 religious landscape surveys, which were conducted by telephone, the new RLS was conducted primarily online and on paper. The NPORS series, conducted annually since 2020, also is administered mostly online and on paper.
A companion study conducted alongside the new RLS suggests that people are somewhat more inclined to say religion is very important in their lives when speaking to a live interviewer over the telephone than when reading questions by themselves and responding online or on paper. People taking surveys sometimes give more socially desirable answers when talking with another person, though the size and direction of this “mode effect” can vary, depending on the question.109
However, the percentage of Americans who say religion is very important in their lives was already slipping before Pew Research Center transitioned to online and paper surveys, and the mode effect on this question does not appear to be big enough to account for the entire decline since 2014.
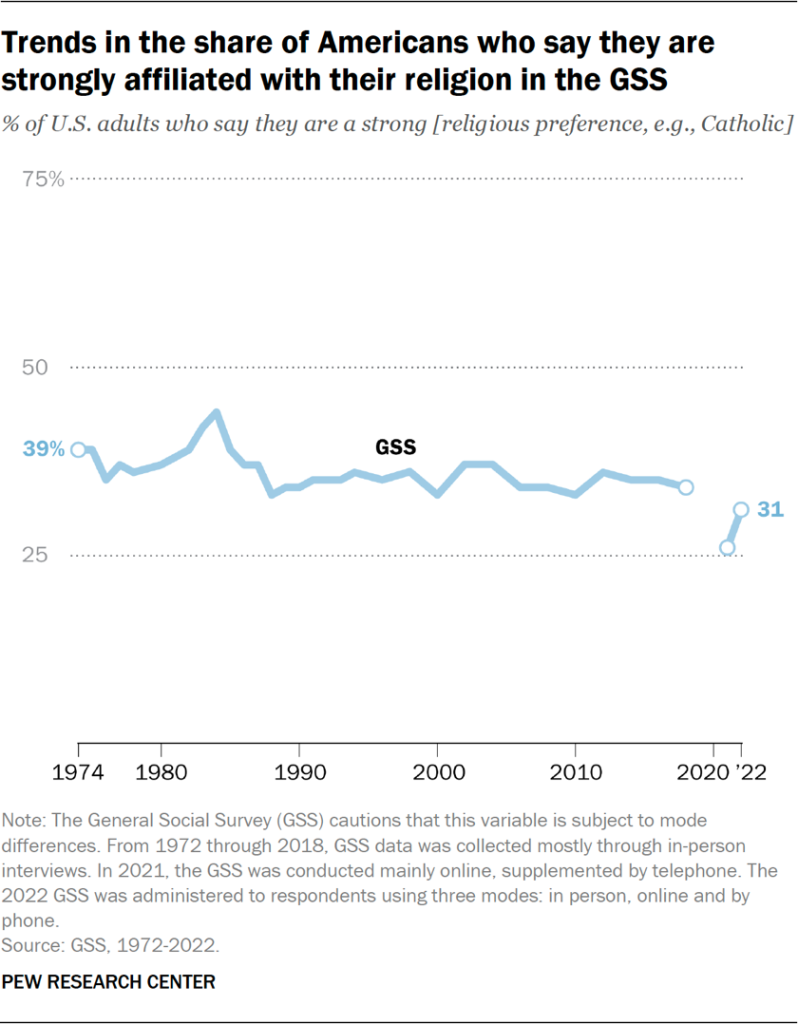
The General Social Survey does not have a long-term trend question about the importance of religion in one’s life. However, it has a different question that asks adults who identify with a religion: “Would you call yourself a strong [religious preference, e.g., Catholic] or not a strong [religious preference, e.g., Catholic]?” Using this measure, the GSS finds a slight long-term decline in the strength of religious affiliation, though it is less steep than the drop in the importance of religion measured in Gallup polls and Pew Research Center’s landscape studies.
In the 1974 GSS, 39% of U.S. adults said their religious identity was strong. This figure ticked up slightly by the early 1980s, when the GSS found the share of Americans expressing a strong religious identity hovering in the low 40% range (42% in 1983, 44% in 1984). In 2016, 35% of GSS respondents expressed a strong religious identity, as did 34% in 2018.
In 2021, 26% of GSS respondents expressed a strong religious identity, as did 31% in 2022. However, it is hard to know whether these recent estimates constitute a decline since the earlier GSS readings or were produced by the changes in GSS methodology.
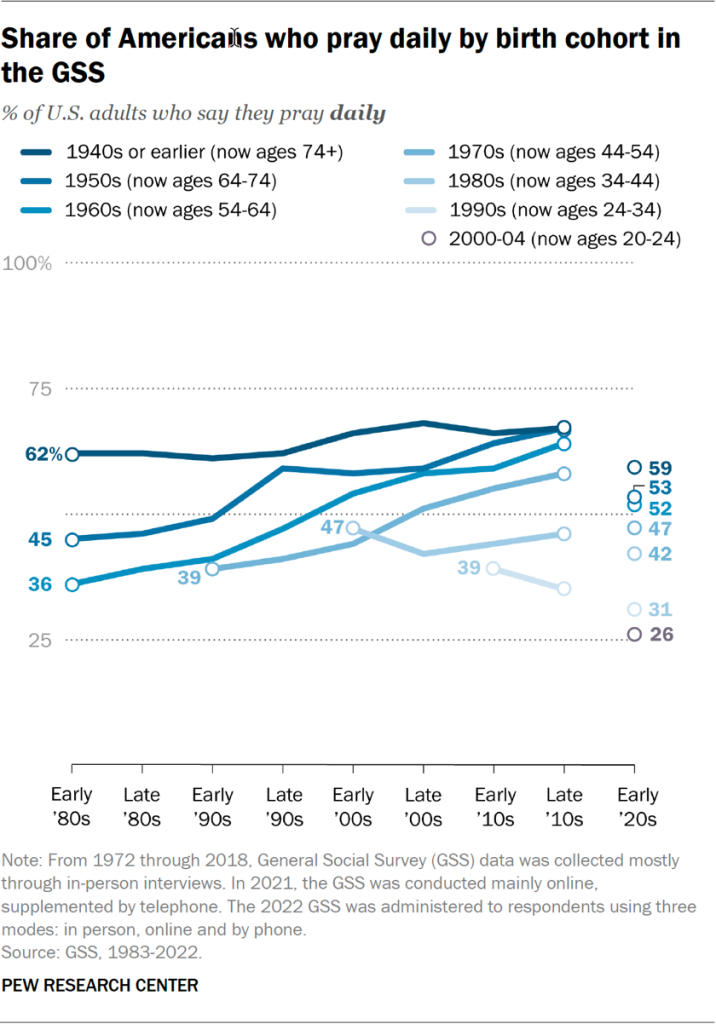
Share of U.S. adults who pray daily
The GSS asks, “About how often do you pray? Several times a day, once a day, several times a week, once a week, less than once a week, or never?” In a similar vein, the RLS asks, “Outside of religious services, how often do you pray? Several times a day, once a day, a few times a week, once a week, a few times a month, seldom or never?”
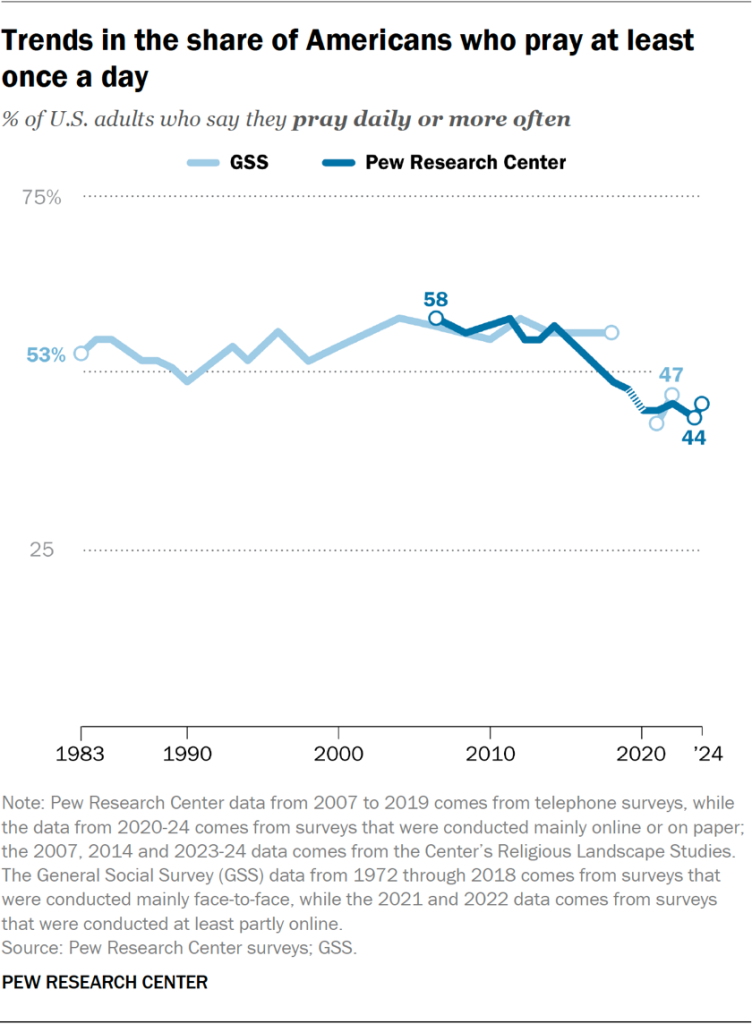
Between 1983 and 2018, the GSS typically found that the share saying they pray daily or more often hovered between 49% and 58%, depending on the year. If anything, the GSS suggests that the share of people who pray daily may have risen over the period from 1983 to 2018. Both the 2021 and 2022 GSS obtained lower estimates of daily prayer than any previous GSS, but here again, it is hard to know whether this recent data reflects actual declines in the public’s prayerfulness or, instead, is an artifact of changes in the GSS methodology.
In 2007, the RLS found that 58% of U.S. adults said they prayed at least on a daily basis. In 2014, the RLS found that 55% of Americans prayed daily, and the 2023-24 RLS finds that 44% of U.S. adults say they pray at least once a day. Pew Research Center’s NPORS suggests that since 2021, the share of Americans who pray daily may have leveled off, hovering between 44% and 46% each year since 2021.
Share of U.S. adults who in believe in God
Gallup polls have asked about belief in God in a variety of ways, but it has a particularly long trend on a question that asks simply, “Do you believe in God? Yes/No.” Using this wording, Gallup found that 92% of U.S. adults believed in God in 2011, which dropped to 86% in 2014 and 81% in 2022.
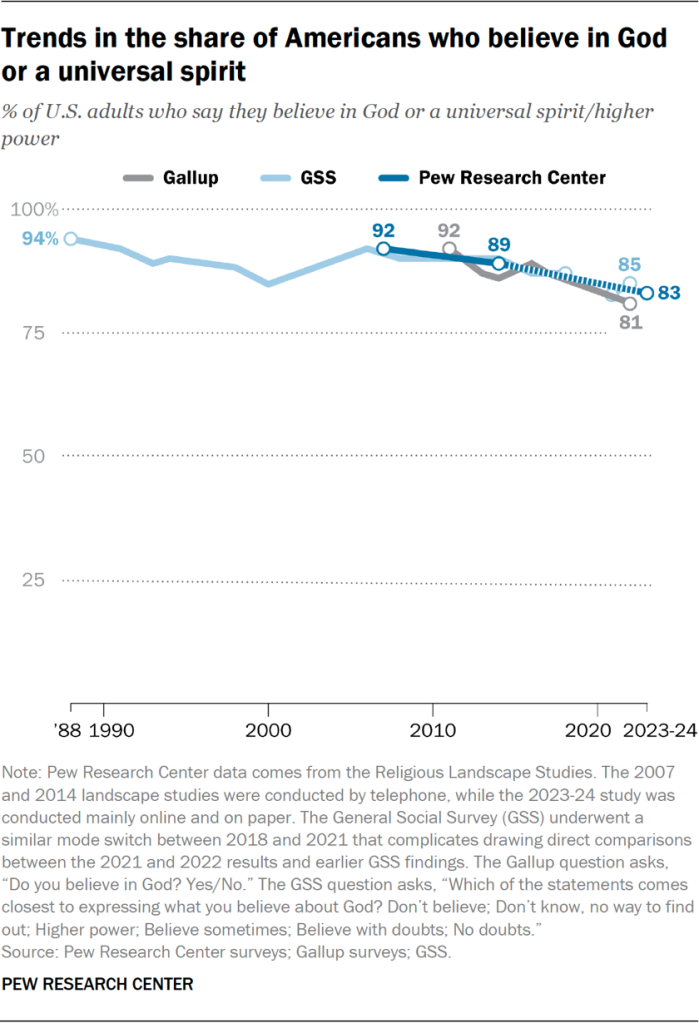
In the GSS, just over 90% of respondents in 1988 and 1991 said they believe in God.110 By 2016 and 2018, just under 90% of GSS respondents said they believe in God. The 2021 and 2022 GSS surveys produced lower estimates of belief in God compared with prior GSS surveys, perhaps partly owing to changes in the GSS methodology.
The 2007 RLS found that 92% of Americans said they “believe in God or a universal spirit,” a share that declined to 89% in 2014 and to 83% in 2023-24. Because Pew Research Center’s annual NPORS does not ask about belief in God, the Center does not have comparable data on whether belief in God has been steady, rising or falling in just the last five years.
Trends in religion by birth cohort
Both the GSS and Pew Research Center generally have found that younger Americans are less religious than older Americans by a couple of traditional measures. For example, in surveys conducted recently (in the early 2020s), the GSS finds that 36% of Americans who are now between the ages of 20 and 24 say they have no religion, compared with just 14% of those ages 74 or older.
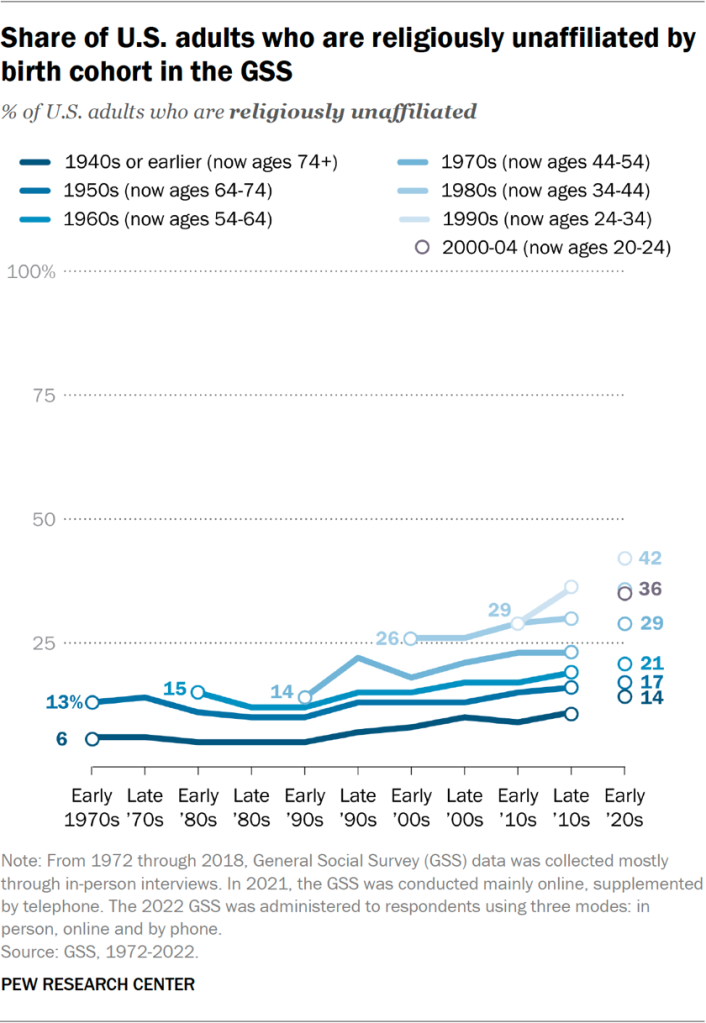
Moreover, the long-running GSS can be used to analyze how birth cohorts (i.e., people born in the same years) have changed as they have aged. Most birth cohorts have tended to enter adulthood with a somewhat lower level of religious affiliation than the previous (older) cohort had when it came of age.
For example, surveys conducted in the early 1970s found that 6% of Americans born in the 1940s or earlier said they were religiously unaffiliated. Among those born in the 1950s, ’60s and ’70s, between 13% and 15% said they were religious “nones” as they entered into adulthood and became eligible to take the GSS. Among those born in the 1980s and ’90s, 26% to 29% said they were religiously unaffiliated as they became adults. And 36% of Americans born in the early 2000s said they are religiously unaffiliated as they aged into the GSS conducted in the early 2020s.
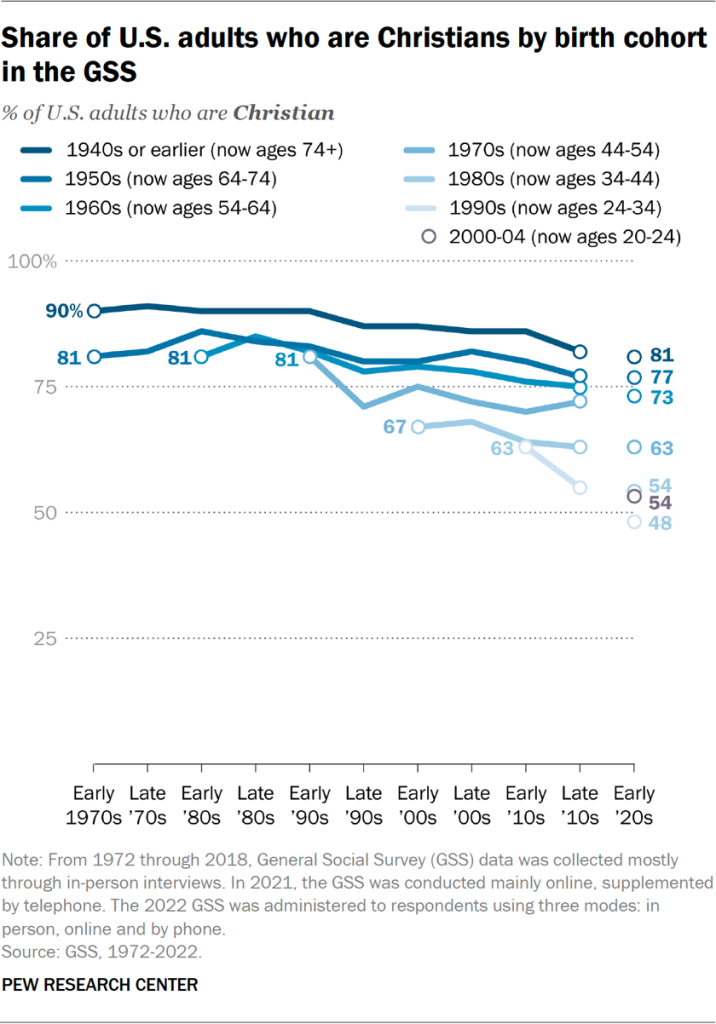
The GSS data shows, furthermore, that people within birth cohorts do not tend to become more religiously affiliated as they get older. Rather, within each birth cohort that can be analyzed in the GSS data, the share of people who say they are Christian, for example, tends to stay roughly the same or tick down somewhat as people get older. And conversely, within each birth cohort, the share of people who say they are religiously unaffiliated tends to stay about the same or tick up slightly as people get older.
The GSS data on religious attendance paints a similar picture. Broadly speaking, adults have tended to come of age with at least marginally lower rates of religious attendance than their immediate older predecessors. And within birth cohorts, the share of people who say they attend religious services regularly has not tended to go up as people get older.
But the GSS data is very different when it comes to prayer frequency. Between the early 1990s and early 2010s, young people just entering adulthood have reported praying at rates similar to or slightly higher than the rates reported by people who aged into adulthood just before them. And in several birth cohorts, including those born in the 1950s, 1960s and 1970s, the share who report praying daily has increased as the people in these groups have gotten older.
Details on the data sources
General Social Surveys are conducted by the independent research organization NORC at the University of Chicago, beginning in 1972. They were conducted annually through 1994 (with a few exceptions) and then mostly biennially thereafter.
For more information, refer to: Davern, Michael; Bautista, Rene; Freese, Jeremy; Herd, Pamela; and Morgan, Stephen L.; General Social Survey 1972-2022. [Machine-readable data file]. Principal Investigator, Michael Davern; Co-Principal Investigators, Rene Bautista, Jeremy Freese, Pamela Herd, and Stephen L. Morgan. NORC ed. Chicago, 2024. 1 datafile (Release 4) and 1 codebook (2022 Release 4).
NORC samples households, which cover almost 95% of adults, but it excludes what the U.S. Census Bureau calls “group quarters” (jails and prisons, shelters, college dorms, military barracks, assisted living and nursing homes).
Data was accessed from the GSS website. All analyses were conducted using the weight WTSSPS for years 1972-2002, and WTSSNRPS for 2004-2022.
Gallup data was accessed via their religion topic page, and drawn from their recent publication “How Religious Are Americans?”
Read Pew Research Center’s RLS and NPORS methodologies here.


