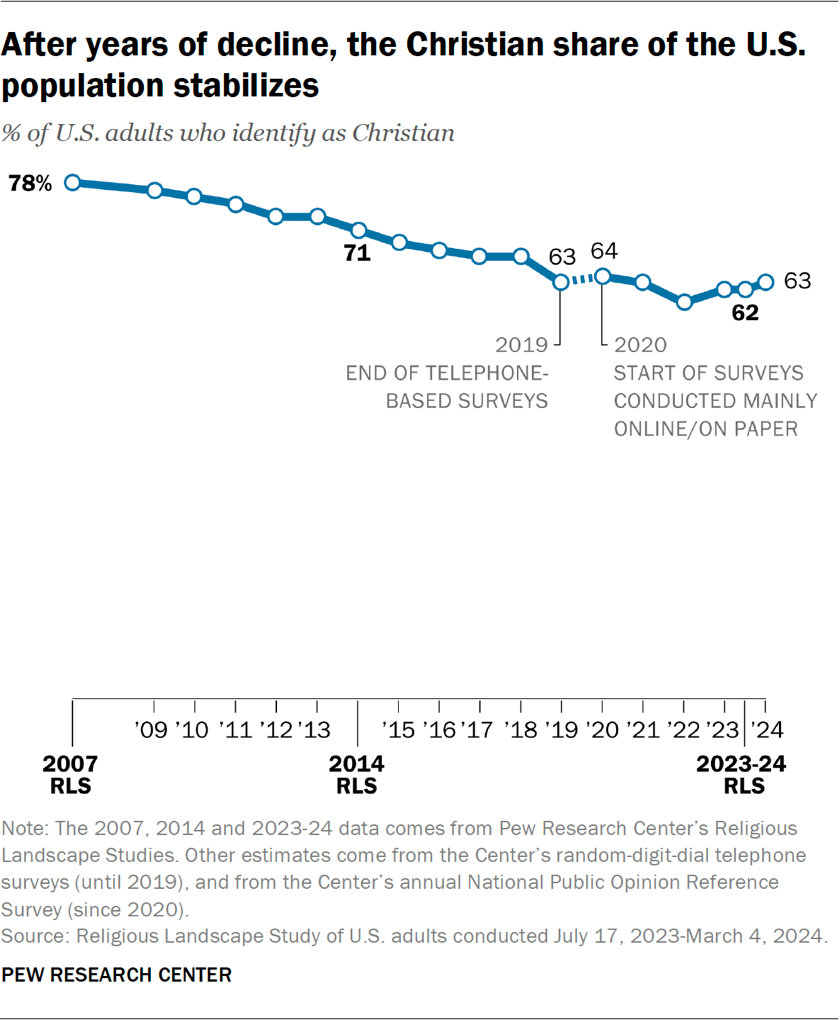
After many years of steady decline, the share of Americans who identify as Christians shows signs of leveling off – at least temporarily – at slightly above six-in-ten, according to a massive new Pew Research Center survey of 36,908 U.S. adults.
The Religious Landscape Study (RLS) is the largest single survey the Center conducts, aiming to provide authoritative figures on the size of U.S. religious groups because the U.S. census does not collect that information.
We have conducted three of these landscape surveys over the past 17 years, with more than 35,000 randomly sampled respondents each time. That’s enough to paint a statistical portrait of religion not only nationally, but also in all 50 states and the District of Columbia, as well as in 34 large metro areas.
This introductory essay walks through the big-picture trends: evidence both of a long-term decline in American religion and of relative stability in the last few years, since 2020 or so.
Jump to an executive summary of key findings.
Search for data on religious groups.
The first RLS, fielded in 2007, found that 78% of U.S. adults identified as Christians of one sort or another. That number ticked steadily downward in our smaller surveys each year and was pegged at 71% in the second RLS, conducted in 2014.
The latest RLS, fielded over seven months in 2023-24, finds that 62% of U.S. adults identify as Christians. That is a decline of 9 percentage points since 2014 and a 16-point drop since 2007.
But for the last five years, between 2019 and 2024, the Christian share of the adult population has been relatively stable, hovering between 60% and 64%. The 62% figure in the new Religious Landscape Study is smack in the middle of that recent range.
The largest subgroups of Christians in the United States are Protestants – now 40% of U.S. adults – and Catholics, now 19%. People who identify with all other Christian groups (including the Greek and Russian Orthodox Churches, the Church of Jesus Christ of Latter-day Saints, Jehovah’s Witnesses and many others) total about 3% of U.S. adults.
Both Protestant and Catholic numbers are down significantly since 2007, though the Protestant share of the population has remained fairly level since 2019 and the Catholic share has been stable since 2014, with only small fluctuations in our annual surveys.
Meanwhile, the share of Americans who identify with a religion other than Christianity has been trending upward, though it is still in single digits.
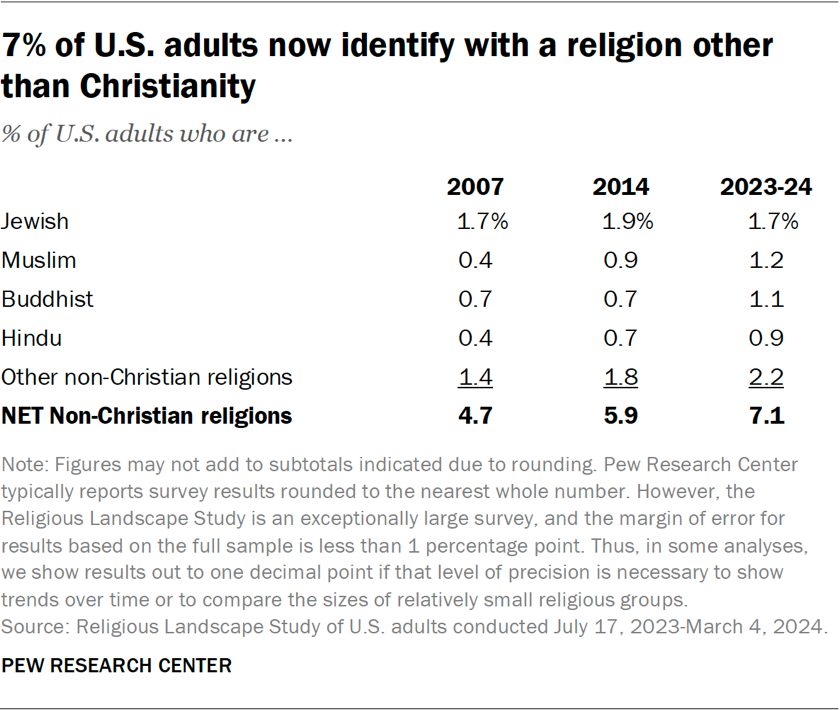
Today, 1.7% of U.S. adults say they are Jewish when asked about their religion, while 1.2% of respondents in the new survey are Muslim, 1.1% are Buddhist, and 0.9% are Hindu.
Religiously unaffiliated adults – those who identify as atheists, agnostics or as “nothing in particular” when asked about their religion – account for 29% of the population in the new RLS. The size of the religiously unaffiliated population, which we sometimes call religious “nones,” has plateaued in recent years after a long period of sustained growth.
Rates of prayer, attendance at religious services also relatively stable
Other standard survey measures contribute to this emerging picture of stability:
- Though down significantly since 2007, the share of Americans who say they pray daily has consistently held between 44% and 46% since 2021. In the new RLS, 44% say they pray at least once a day.
- Similarly, since 2020, the percentage of U.S. adults who say they attend religious services monthly has hovered in the low 30s. In the new RLS, 33% say they go to religious services at least once a month.
Spiritual beliefs are widespread
Moreover, the survey shows that large majorities of Americans have a spiritual or supernatural outlook on the world.
For example:
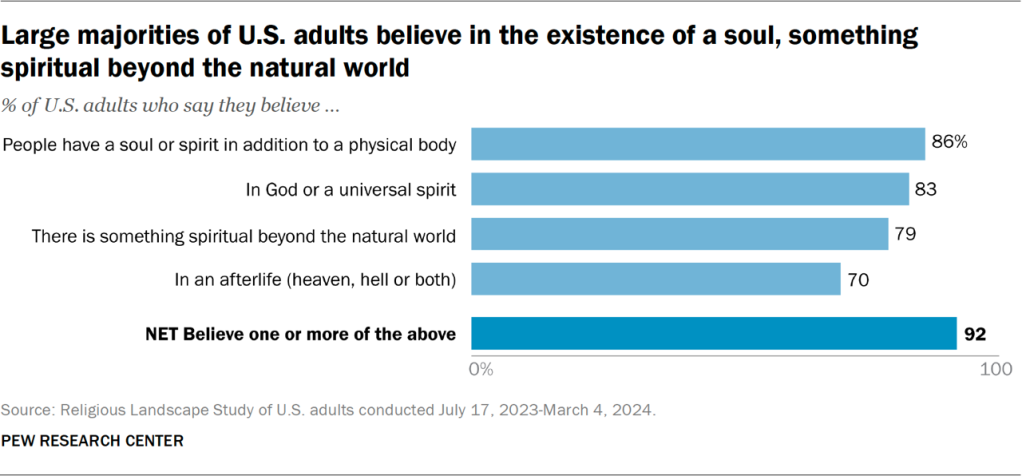
- 86% believe people have a soul or spirit in addition to their physical body.
- 83% believe in God or a universal spirit.
- 79% believe there is something spiritual beyond the natural world, even if we can’t see it.
- 70% believe in an afterlife (heaven, hell or both).
But, despite these signs of recent stabilization and abiding spirituality, other indicators suggest we may see further declines in the American religious landscape in future years.
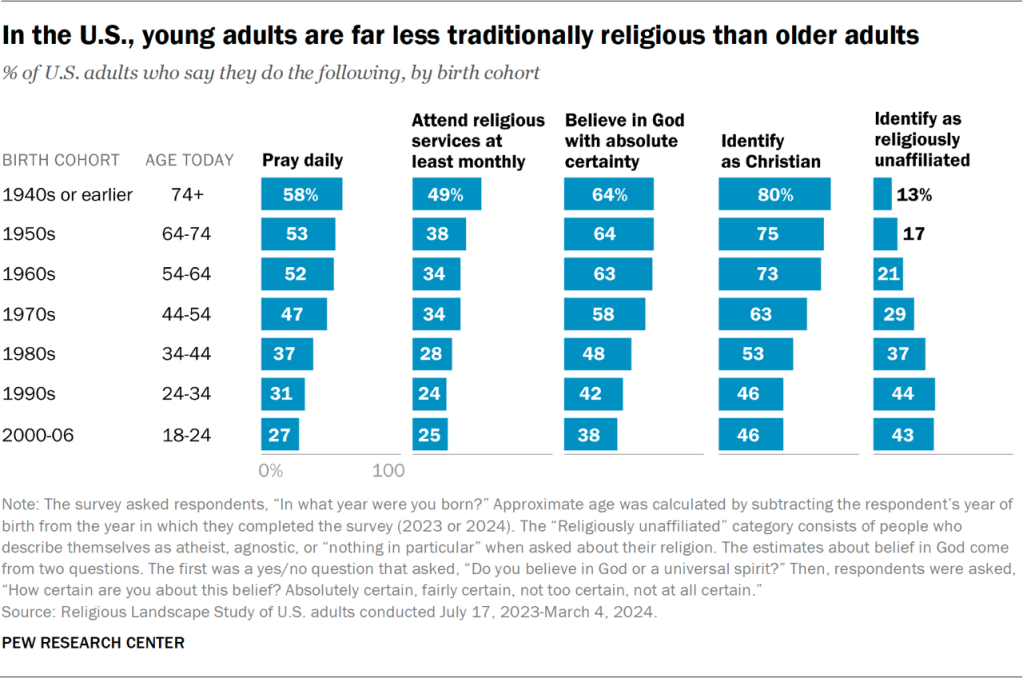
Namely, younger Americans remain far less religious than older adults.
For example, the youngest adults in the survey (ages 18 to 24) are less likely than today’s oldest adults (ages 74 and older) to:
- Identify as Christian (46% vs. 80%)
- Pray daily (27% vs. 58%)
- Say they attend religious services at least monthly (25% vs. 49%)
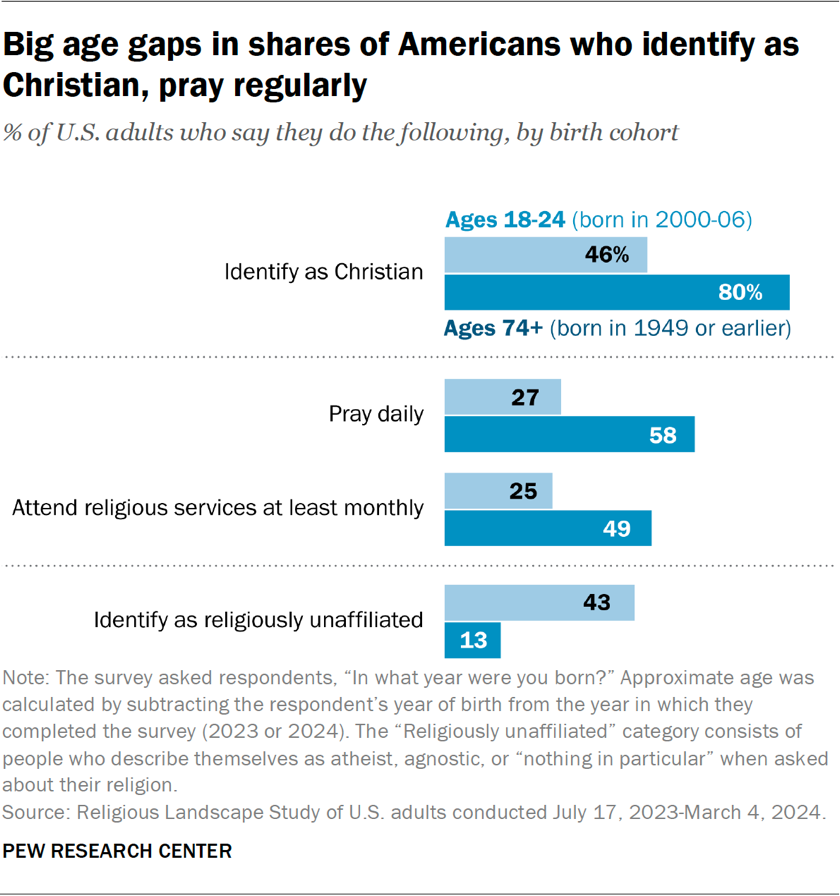
And the youngest adults are more likely than the oldest Americans to be religiously unaffiliated (43% vs. 13%).
Also, younger Americans are less likely than older adults to say they were raised in religious households.1 And, compared with older adults, fewer young people who were raised in religious households have remained religious after reaching adulthood.
These are among the key findings of Pew Research Center’s 2023-24 Religious Landscape Study. Like the previous studies, the new survey offers a great deal of information on what Americans believe and how they practice a wide variety of religions.
In this report, we cover in detail:
- 7. Importance of religion and the Bible
- 8. Religious attendance and congregational involvement
- 9. Race and ethnicity in religious congregations
- 10. Prayer and other religious practices
- 11. Religious and spiritual beliefs
- 12. Spiritual experiences
- 13. Spiritual activities
- 14. Spiritual and religious self-descriptions
- 15. Religion, partisanship and ideology
- 16. Religion and views on LGBTQ issues and abortion
- 17. Religion and views on gender, parenting and workforce participation
- 18. Religion and views on immigration and diversity
- 19. Religion and views on the environment
- 20. Religion and views on the role of government
Executive summary
I. Religious affiliation and religious switching
II. Religion and family life
III. Religious or spiritual beliefs and practices
IV. Social and political views
V. Opinions on religion's place in society
VI. Demographics of U.S. religious groups
Acknowledgments
Methodology
Reasons for the long-term decline and recent stability
The RLS and other recent Pew Research Center surveys suggest that two things are happening simultaneously in American religion:
- Over the long term (since 2007 in our data and going back further in other major surveys), there is a downward trend in several measures of religiousness, including affiliation with Christianity.
- In the short term (the last four or five years), these changes have slowed or perhaps even plateaued.
Long-term decline
One driver of the long-term trend is “generational replacement.” Older, highly religious, heavily Christian generations are passing away. The younger generations succeeding them are much less religious, with smaller percentages of Christians and more “nones.”2
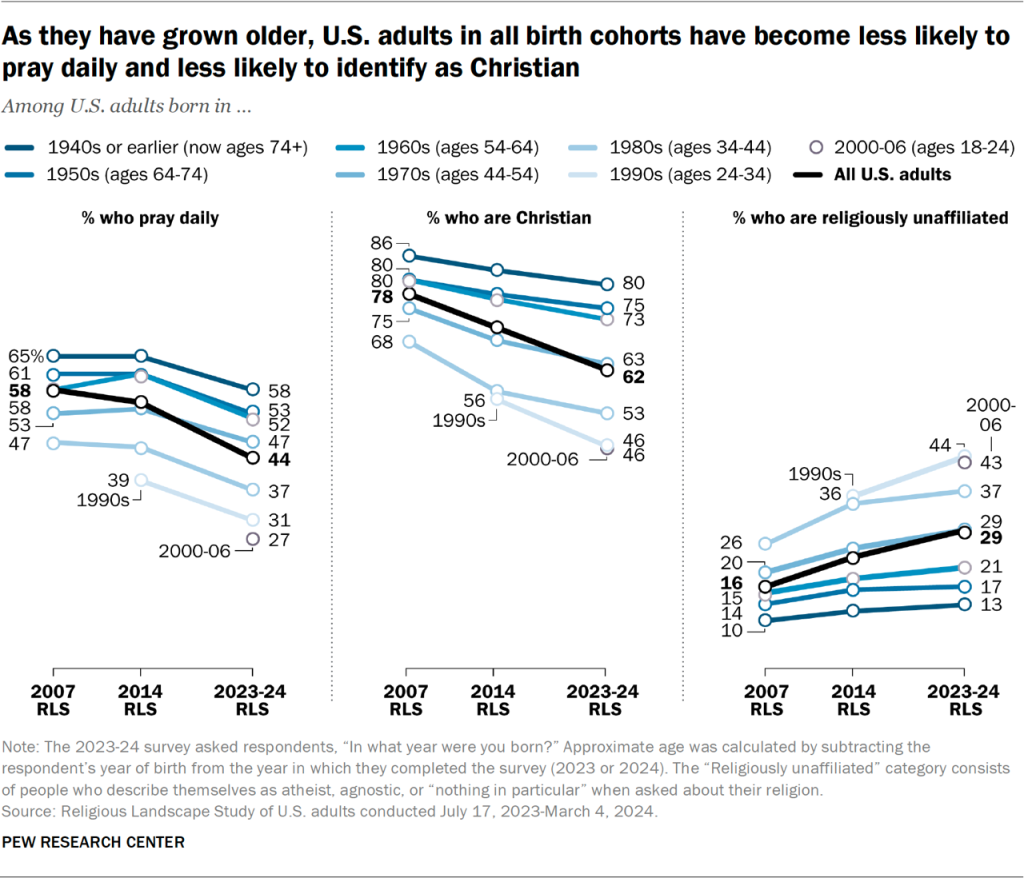
In addition, the landscape surveys show that between 2007 and 2023-24, each birth cohort has become less religious, by several measures, as it has aged.
For example, people within the oldest and youngest cohorts, as well as those in between, have become less likely to say they pray daily, less likely to identify with a religion (including Christianity), and less likely to believe in God or a universal spirit with absolute certainty.
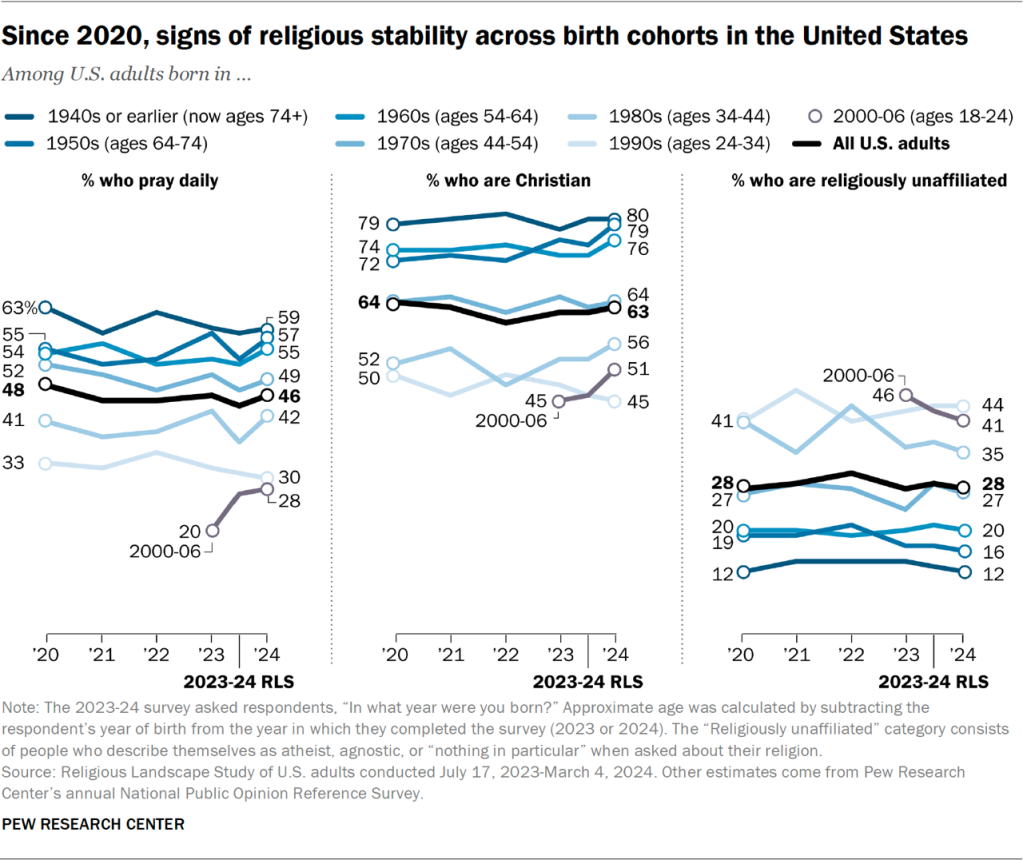
Recent stability
Since 2020, however, our surveys indicate that the religiousness of most birth cohorts has remained relatively stable. For instance, people born in the 1950s are about as likely to report praying daily in the 2023-24 RLS (53%) and the 2024 National Public Opinion Reference Survey, or NPORS (57%), as they were in the 2020 NPORS (55%).
Additionally, the new RLS finds that the youngest cohort of adults is no less religious than the second-youngest cohort in a variety of ways.3 Americans born in 2000 through 2006 (those ages 18 to 24 in the 2023-24 RLS) are just as likely as those born in the 1990s (now ages 24 to 34) to identify as Christians, to say religion is very important in their lives, and to report that they attend religious services at least monthly.4
Time will tell whether the recent stability in measures of religious commitment is the beginning of a lasting shift in America’s religious trajectory. But it is inevitable that older generations will decline in size as their members gradually die. We also know that the younger cohorts succeeding them are much less religious.
This means that, for lasting stability to take hold in the U.S. religious landscape, something would need to change. For example, today’s young adults would have to become more religious as they age, or new generations of adults who are more religious than their parents would have to emerge.
Religion and spirituality among young adults
The dynamics of religion and spirituality among young people are key to understanding the country’s recent religious trajectory. The large size of the new survey makes it possible to paint a religious and spiritual profile of the nation’s youngest adults with unique precision.
By a number of traditional measures, today’s young adults exhibit far lower levels of religiousness than older adults. For example, 27% of adults between the approximate ages of 18 and 24 in the new survey say they pray daily, as do 31% of those ages 24 to 34. But among adults ages 54 and older, half or more say they pray daily.
Young adults also report attending religious services less often than older adults do, and they express lower levels of belief in God or a universal spirit. Compared with older adults, fewer young people identify as Christians, and more say they don’t identify with any religion.
On the survey’s questions touching on matters of spirituality, however, the age gaps are smaller.
For example, eight-in-ten or more adults in all age categories say they believe people have a soul or spirit in addition to their physical bodies.
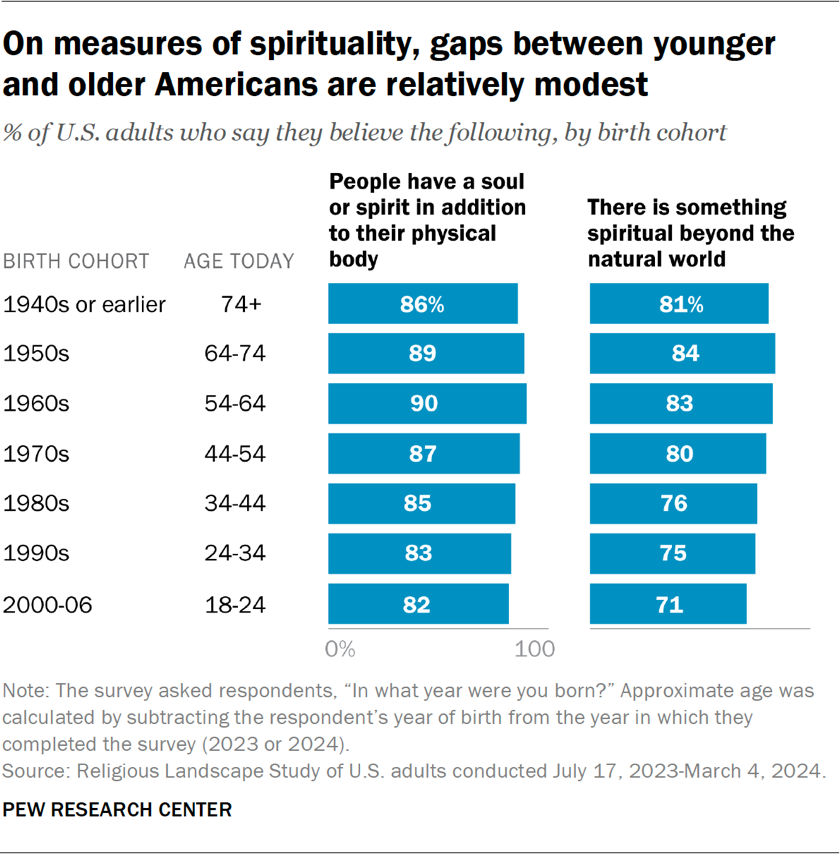
And about seven-in-ten adults ages 18 to 24 and 75% of those ages 24 to 34 believe there is something spiritual beyond the natural world, only modestly below the 81% of the oldest adults (ages 74 and older) who say this.
In the rest of this Overview, we explore these and other key topics in detail:
- Trends in the size of religious groups and denominations
- Race in religious groups and congregations
- The narrowing gender gap in American religion
- Religion in childhood and adulthood
- Religion in U.S. families today
- Religious switching
- Signs of strengthening spirituality
- Attendance at religious services
- How religious beliefs change as people age
- What is happening to the ‘middle’ of American religion
- Trends in the religiousness of Christians
- Religion and political polarization
Trends in the size of U.S. religious groups and denominations
In the new Religious Landscape Study, 62% of U.S. adults describe themselves as Christians. The Christian share of the population is now 9 points lower than when the landscape study was last conducted in 2014, and 16 points lower than in 2007.
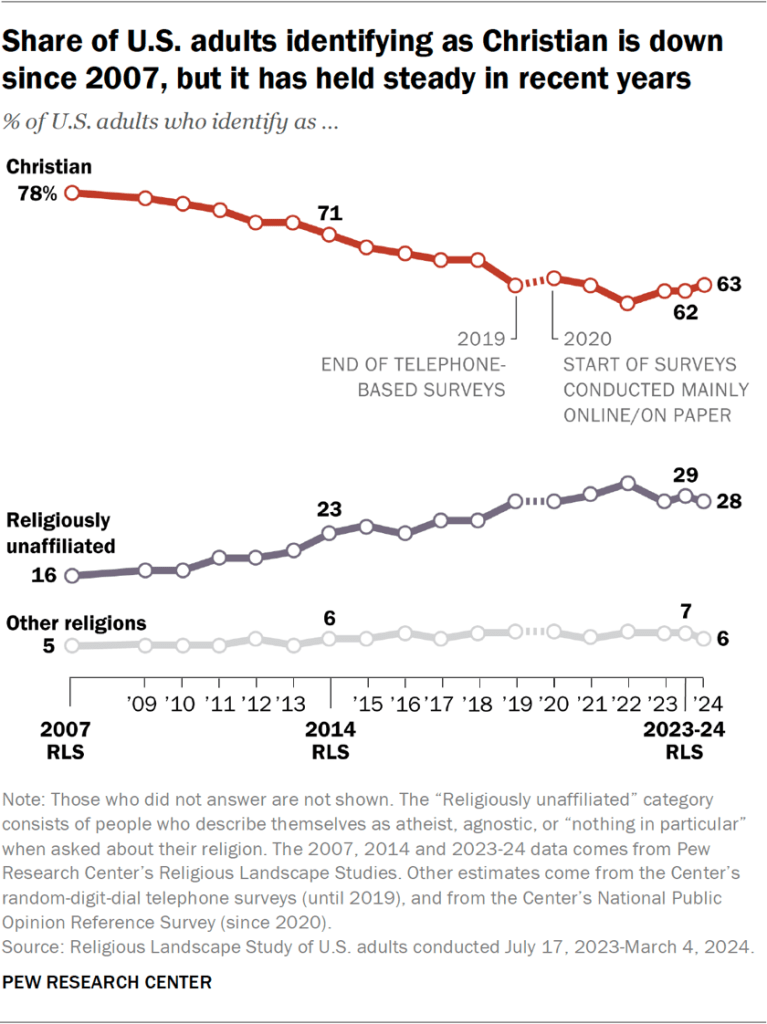
The share of Americans who say they have no religion – identifying, instead, as atheist, agnostic or as “nothing in particular” – stands at 29% in the new RLS, up from 23% in 2014 and 16% in 2007.
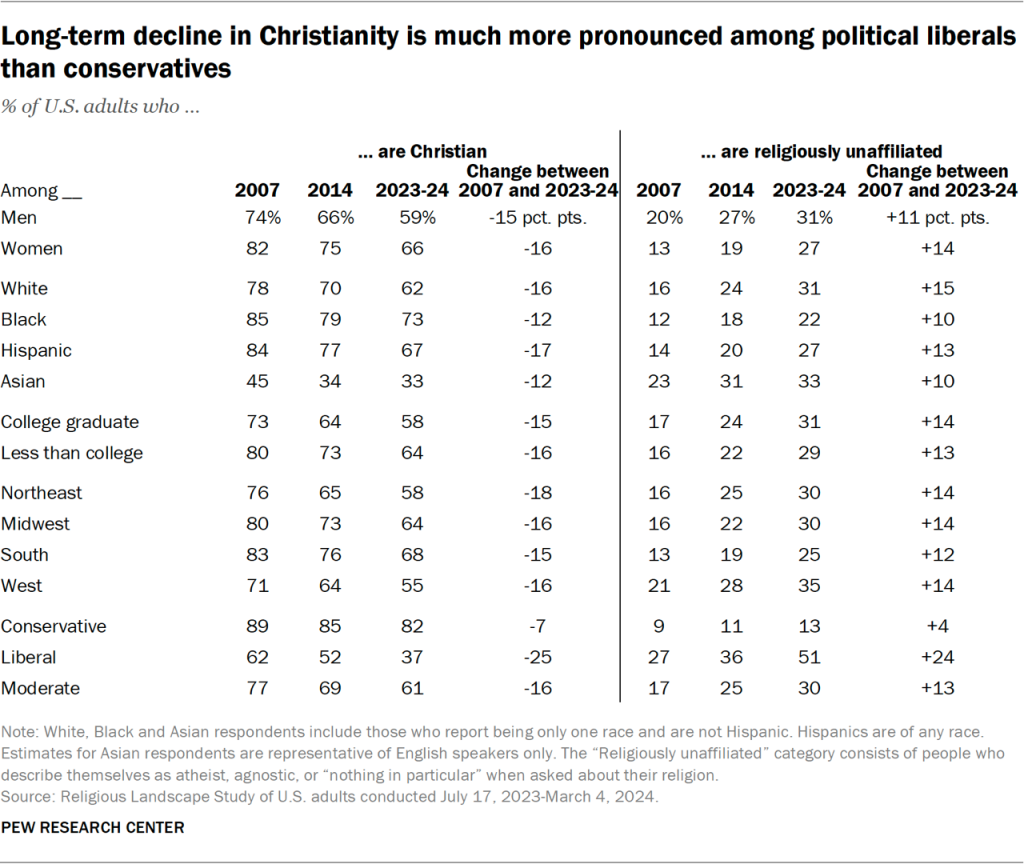
The long-term decline in the Christian share of the population and growth of religious “nones” is demographically broad-based. There are fewer Christians and more “nones” among men and women; people in every racial and ethnic category; college graduates and those with less education; and residents of all major regions of the country.
But the changes are much more pronounced among ideological liberals than conservatives. Today, 37% of self-described liberals identify with Christianity, down from 62% in 2007, a 25-point decline. Meanwhile, 51% of liberals now say they have no religion, up from 27% in 2007, a 24-point increase. There are now more religious “nones” than Christians among liberals, a reversal since 2007.5
There also are fewer Christians and more “nones” among conservatives. But the changes in the religious composition of conservatives have been much less pronounced than among liberals, and a large majority of conservatives continue to identify with Christianity.6
These changes within ideological categories resemble long-term trends within political parties. A prior Pew Research Center analysis shows that both Republicans and Democrats include fewer Christians and more religious “nones” today than they did a decade or more ago. But the decline of Christianity and rise of religious “nones” has been much more pronounced among Democrats than Republicans.7
For a detailed discussion of trends in the religious composition of demographic groups, refer to Chapter 1.
Trends within Christianity
In the 2023-24 RLS, about four-in-ten U.S. adults identify as Protestants. That is 11 points lower than in the 2007 RLS.
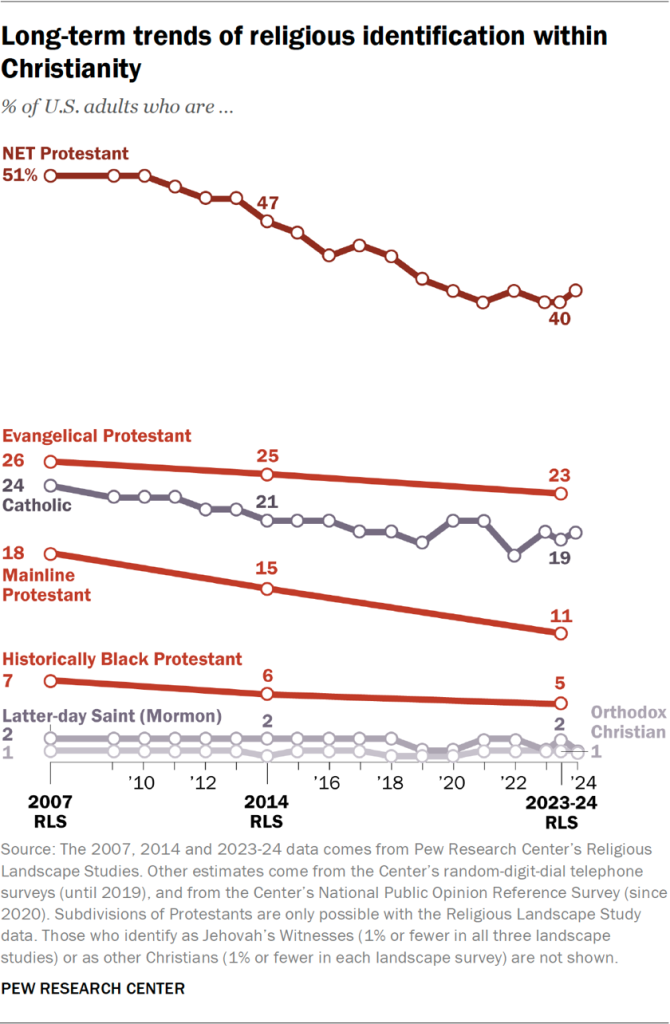
All three major Protestant traditions have seen their population shares tick downward at least slightly over that period:
- Evangelical Protestants now account for 23% of all U.S. adults, down from 26% in 2007.
- Mainline Protestants stand at 11%, down from 18% in 2007.
- Members of historically Black Protestant churches make up 5% of U.S. adults, down slightly from 7% in 2007.
Like the overall Christian share of the population, however, the total Protestant share of the population has been quite stable in recent years, hovering between 40% and 42% since 2019.
The Catholic share of the population has been steady over an even longer period. In 11 Pew Research Center surveys conducted since 2014, all but one have found between 19% and 21% of respondents identifying as Catholic.
Members of the Church of Jesus Christ of Latter-day Saints (widely known as Mormons) account for 2% of respondents in the new RLS, which is virtually unchanged from both the 2007 and 2014 landscape surveys. Orthodox Christians make up 1% of the U.S. population. Jehovah’s Witnesses and other, smaller Christian groups round out the country’s Christian population.
A closer look at Protestant denominational families
Many Protestant denominational families are slightly smaller today than they were in 2014 – at least nominally, even if some of the changes are too small to be statistically significant.
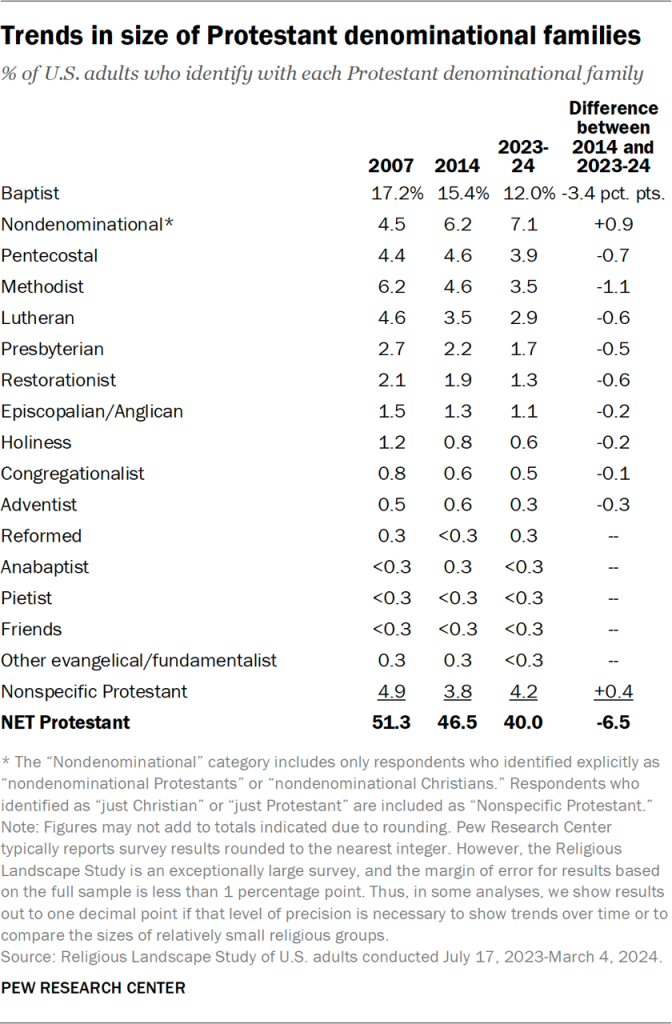
One exception to this pattern is nondenominational Protestantism. The share of Americans identifying with this group is slightly higher today than it was in 2014 (7.1% vs. 6.2%).8
Baptists continue to be the single largest Protestant denominational family in America. Today, 12% of U.S. adults are Baptists, down from 15% in 2014 and 17% in 2007.
Members of Pentecostal churches account for 4% of the U.S. adult population.
Methodists and Lutherans each make up 3% of the population, while 2% of U.S. adults identify as Presbyterians.
Detailed information about Protestant denominations is not available from Pew Research Center’s annual NPORS, making it difficult to know whether the size of denominations has stabilized in recent years.
Categorizing Protestants into one of three traditions based on their denomination
One unique feature of the Religious Landscape Study (RLS) is its detailed questions about religious affiliation. All respondents are asked an initial question about their religious identity (“Are you Protestant, Catholic … Jewish, Muslim, etc.?”).
Then, Protestants are asked a second question to get more information about what type of church they identify with (“Are you Baptist, Methodist, Lutheran, etc.?”).
Finally, depending on how they answer that second question, Protestants are asked a third question to try to determine which denomination they identify with. (Complete details on how these branching questions work and the exact wording of these questions are available in the questionnaires. Refer to the English paper questionnaire; Spanish paper questionnaire; and combined English/Spanish questionnaire for the web/phone administration.)
Pew Research Center researchers then take the most specific information respondents provide about their denominational identity and use it to group Protestants into one of three major traditions – the evangelical Protestant tradition, mainline Protestant tradition, or the historically Black Protestant tradition. These divisions within Protestantism are important, because each tradition has its own, distinctive set of beliefs, practices and histories.
For example, churches in the evangelical tradition tend to share the conviction that personal acceptance of Jesus is the only way to salvation; to emphasize bringing other people to the faith; and to have originated in separatist movements against established religious institutions. Churches in the mainline tradition, by comparison, tend to take a less exclusive view of salvation and to place more emphasis on social reform. Churches in the historically Black Protestant tradition have been shaped uniquely by the experiences of slavery and segregation, which put their religious beliefs and practices in a special context.
It’s important to note that not all Protestant respondents identify with a specific denomination. Many Protestants identify as “just Baptist” or “just Methodist,” say they don’t identify with any particular denomination, or describe themselves as “just Christian.” In these cases, respondents are categorized into one of the three Protestant traditions based on their answers to a question asking whether they think of themselves as born-again or evangelical Christians, and/or a question asking about their race. Protestants who do identify with a specific denomination are grouped into one of the three Protestant traditions based exclusively on their denominational affiliation.
For example, all Southern Baptists are coded as evangelical Protestants regardless of their race, and all United Methodists are coded as mainline Protestants regardless of their answer to the question about whether they think of themselves as a born-again or evangelical Christian. Complete details on the categorization of Protestantism are available in Appendix B.
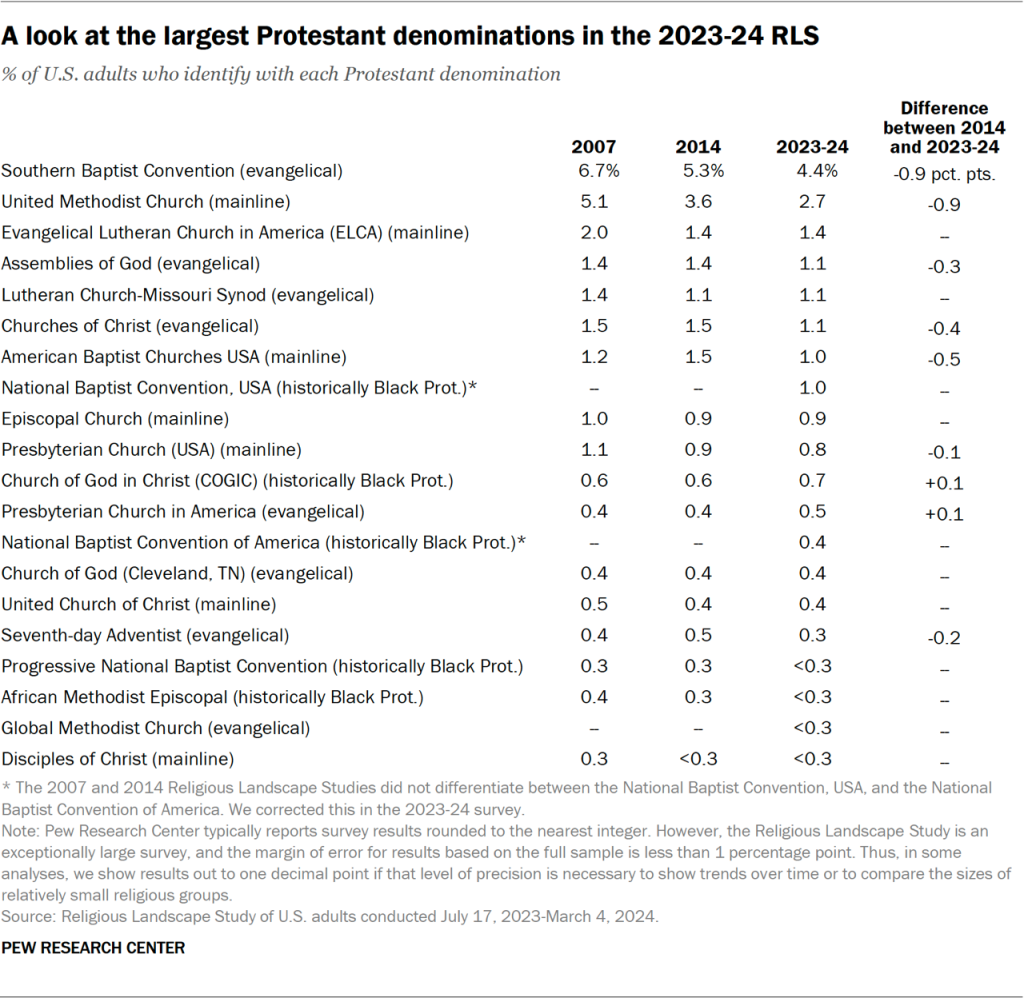
The Southern Baptist Convention (SBC) – which Pew Research Center categorizes as part of the evangelical Protestant tradition – remains the nation’s single largest Protestant denomination. Today, 4.4% of U.S. adults say they identify with the SBC, down from 5.3% in 2014 and 6.7% in 2007.
Some of the other large evangelical denominational groupings include:
- The Assemblies of God, which we classify as a Pentecostal church (1.1% of U.S. adults)
- The Lutheran Church-Missouri Synod (1.1%)
- Churches of Christ (1.1%)9
- The Presbyterian Church in America (0.5%)
The United Methodist Church – a mainline Protestant denomination in the Center’s coding – makes up 2.7% of the U.S. population, compared with 3.6% in 2014 and 5.1% in 2007. The United Methodist Church has splintered in recent years, and many of its former churches have “joined the more conservative Global Methodist Church,” according to The Associated Press.10
Other large mainline denominations include:
- The Evangelical Lutheran Church in America, or ELCA (1.4% of U.S. adults)
- The American Baptist Churches USA (1.0%)
- The Episcopal Church (0.9%)
- The Presbyterian Church (USA), at 0.8%
The National Baptist Convention, USA – a denomination in the historically Black Protestant tradition – was named by 1.0% of survey respondents. Other large historically Black Protestant denominations in the survey include:
- The Church of God in Christ (COGIC), a Pentecostal denomination mentioned by 0.7% of respondents
- The National Baptist Convention of America (0.4%)
- The Progressive National Baptist Convention (mentioned by fewer than 0.3% of respondents)
- The African Methodist Episcopal Church (also mentioned by fewer than 0.3% of respondents)
Identifying with religions other than Christianity
The share of Americans who identify with a religion other than Christianity has been trending upward, from 4.7% in 2007 to 7.1% today.
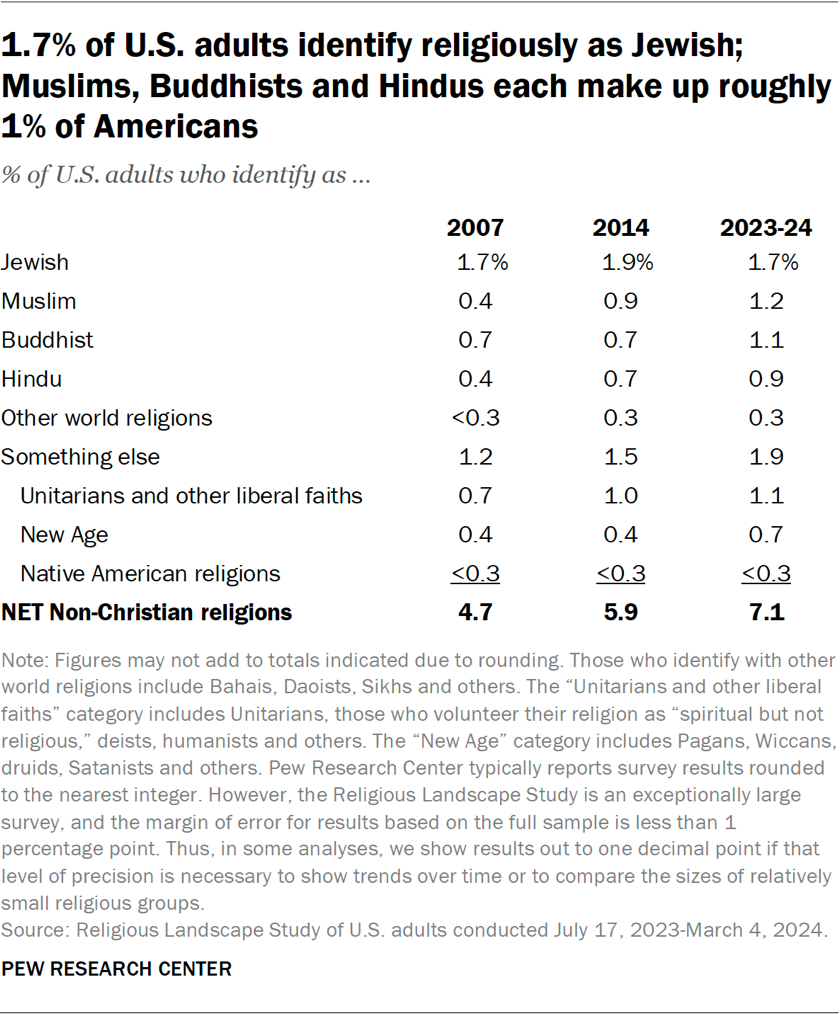
Overall, 1.7% of adults identify as Jewish when asked about their religion – on par with results from the previous landscape studies and Pew Research Center’s 2020 survey of Jewish Americans.
Muslims, Buddhists and Hindus each account for roughly 1% of the U.S. adult population. All three of these groups are larger today than they were in 2007.
An additional 0.3% of respondents identify with other world religions (including Bahai’ism, Daoism, Rastafarianism, Sikhism and traditional African religions).
And 1.9% of U.S. adults identify religiously as something else, including 1.1% of respondents who identify with Unitarianism or other liberal faiths, and 0.7% who identify with New Age groups.11
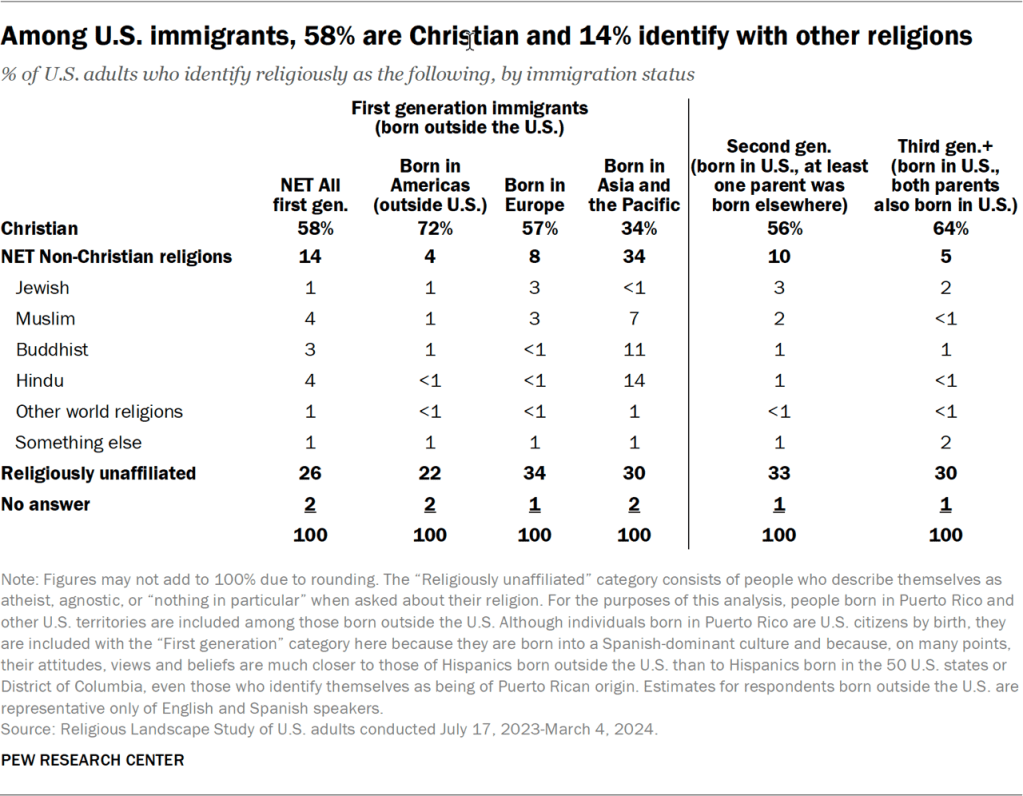
Religious affiliation of U.S. immigrants
About 14% of U.S. adults who were born outside the country identify with religions other than Christianity, including 4% of U.S. immigrants who are Muslim, 4% who are Hindu, and 3% who are Buddhists.12
Most immigrants to the U.S. who were born in other parts of the Americas are Christian (72%), including 45% who are Catholic. Among immigrants from Europe, 57% are Christian, 8% identify with other religions, and 34% are religiously unaffiliated.
Immigrants born in the Asia-Pacific region are divided about evenly between Christians, adherents of non-Christian religions (including 14% who are Hindu, 11% who are Buddhist and 7% who are Muslim), and the religiously unaffiliated.13
The survey did not include enough respondents born in the Middle East-North Africa or sub-Saharan Africa regions to be able to report on them separately.
Among respondents who were born in the U.S. but had at least one parent born outside the U.S. (i.e., second-generation Americans), 10% identify with religions other than Christianity.
By comparison, among people born in the U.S. to parents both of whom also were born in the U.S. (i.e., at least third-generation Americans), 5% identify with non-Christian religions.
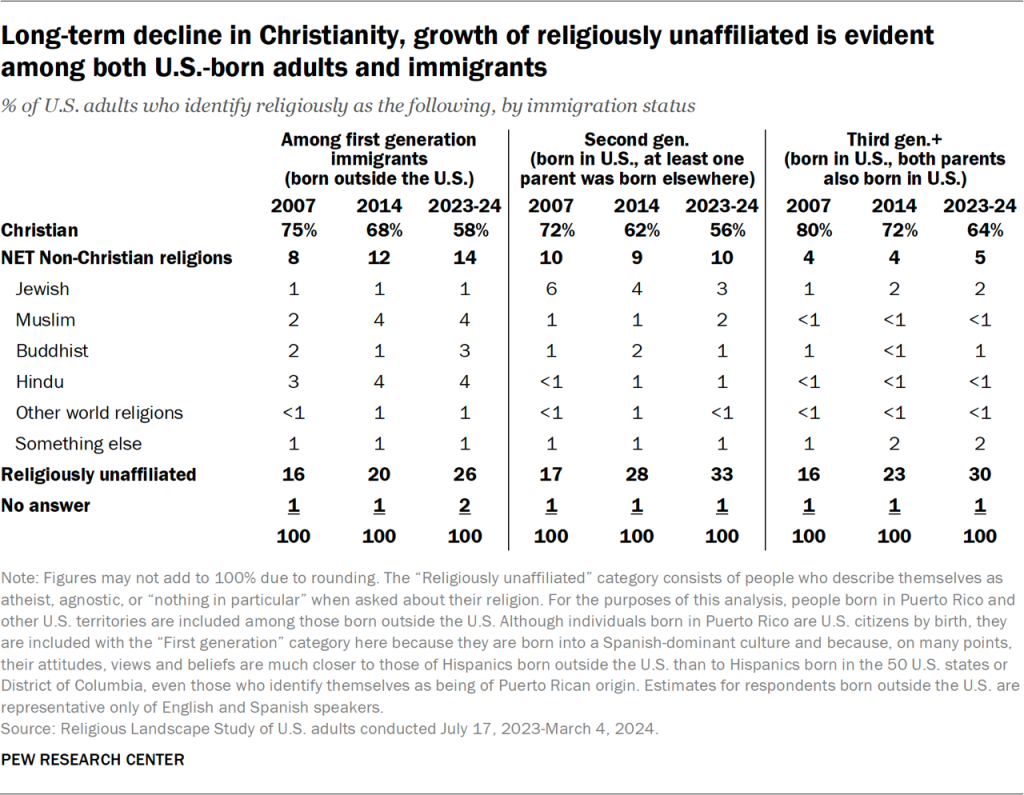
More broadly, the survey finds that the long-term decline in Christianity and growth of the religiously unaffiliated population is evident among immigrants, second-generation respondents (people who were born in the U.S. but had at least one parent born elsewhere), and people whose families have been in the U.S. for three generations or more.
For example, among respondents born outside the U.S., the Christian share of the population declined from 75% to 58% between 2007 and 2023-24. Over the same period, the religiously unaffiliated share of this group (immigrants to the U.S.) grew from 16% to 26%, and the share identifying with religions other than Christianity grew from 8% to 14%.
For more details on trends in the religious composition of U.S. adults, refer to Chapter 1.
Race in religious groups and congregations
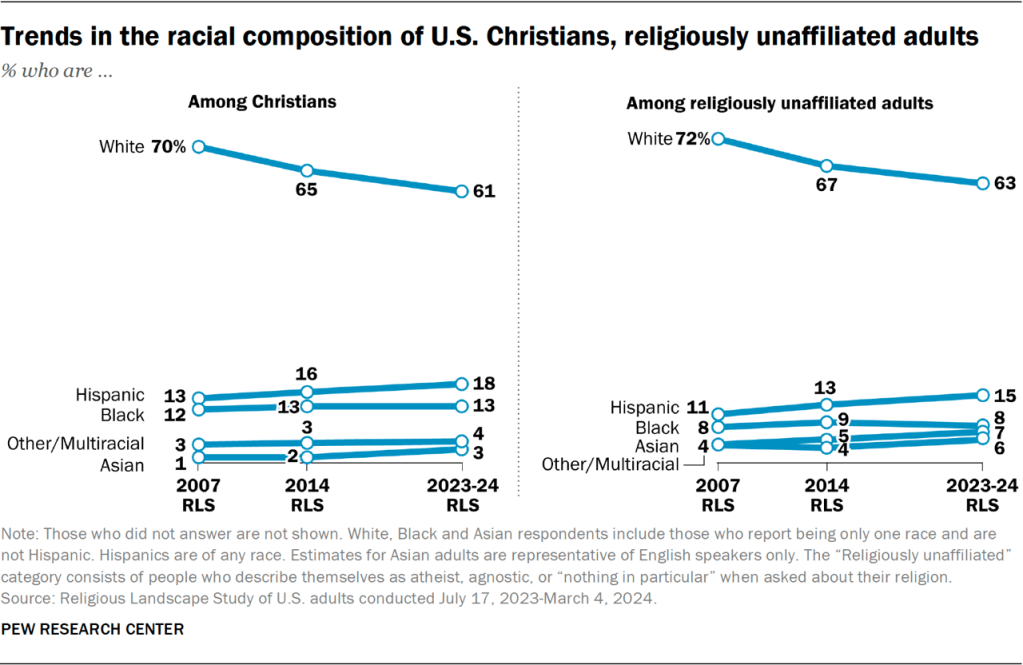
Like the U.S. public as a whole, both Christians and religious “nones” have experienced a decline in the shares who are White.
Among Christians in the new survey, 61% are White (and non-Hispanic), 18% are Hispanic, 13% are non-Hispanic Black, 4% describe themselves as multiracial or in another way, and 3% are non-Hispanic Asian.
In 2007, by comparison, 70% of Christians said they were White, 13% were Hispanic, 12% were Black, 3% identified as multiracial or in another way, and 1% were Asian.
In the new survey, 92% of respondents in the historically Black Protestant tradition are Black themselves, while 4% are Hispanic and 3% are White.
In most other Christian traditions large enough to be analyzed in the survey, seven-in-ten or more adherents are White. Catholics are an exception: 54% in the new survey are White, while 36% are Hispanic, 4% are Asian, and 2% are Black.
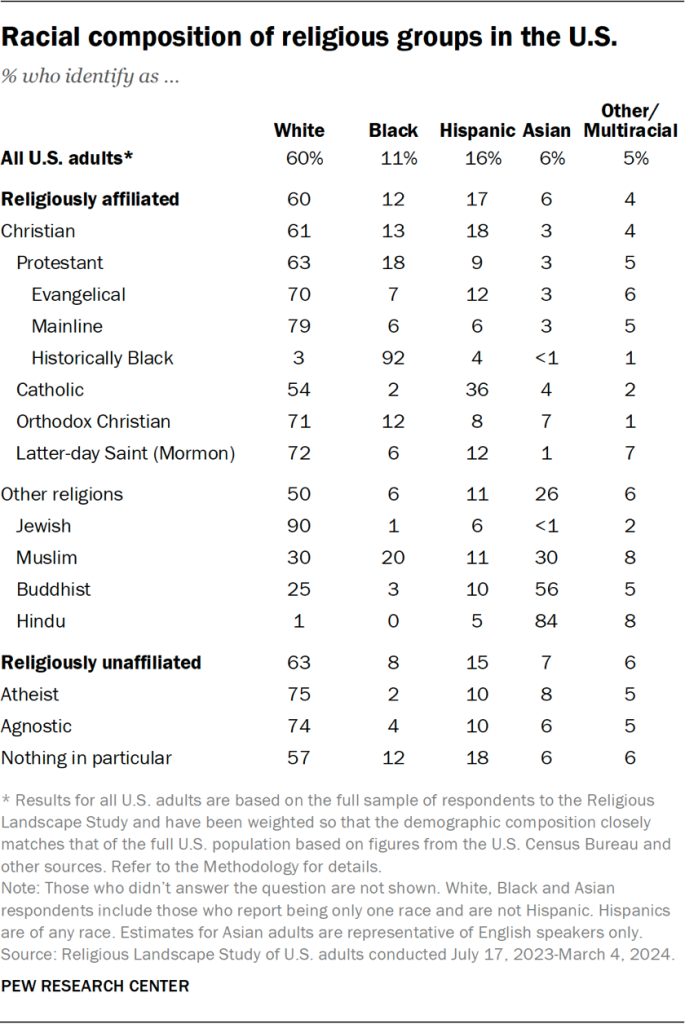
Nine-in-ten Jewish respondents in the new survey are White. Among Hindu respondents, 84% are Asian, as are 56% of Buddhists in the survey.
Muslim respondents in the new study include 30% who are White, 30% who are Asian, 20% who are Black and 11% who are Hispanic.
Roughly three-quarters of atheists (75%) and agnostics (74%) in the new survey are White; fewer people who describe their religion as “nothing in particular” are White (57%).
(For a detailed discussion of the racial and ethnic composition of religious groups, refer to Chapter 24.)
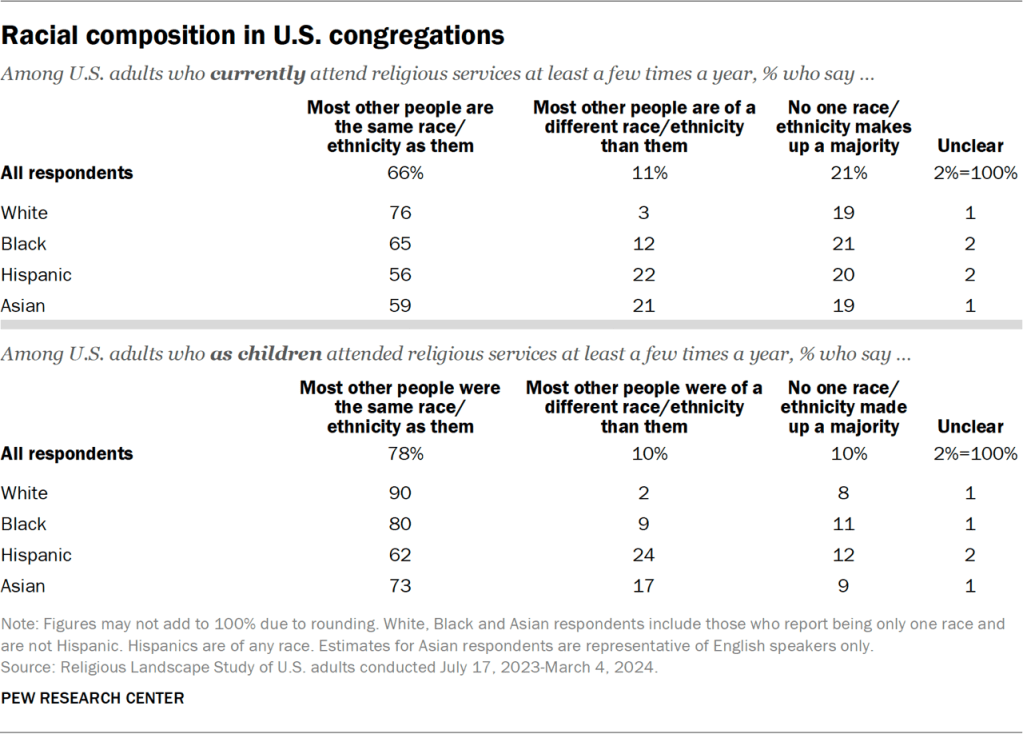
The survey asked people who attend religious services at least a few times a year about the racial and ethnic makeup of the congregation they attend. And it asked a similar question about the racial and ethnic composition of the congregation that respondents attended as children.
Among people who attend religious services, roughly one-third currently attend a congregation where they, themselves, are not part of a racial or ethnic majority. This includes 11% who say that most of their fellow worshippers have a different race or ethnicity than they do and 21% who say that no one racial or ethnic group makes up a majority.
Fewer people (roughly one-fifth of respondents) say they grew up attending a congregation where they, themselves, weren’t in a racial or ethnic majority. This includes 10% who grew up going to religious services at least a few times a year at a house of worship where most people belonged to a different race or ethnicity than they did, and an additional 10% who say that no single racial or ethnic group predominated at those services.
For more on race in religious congregations, refer to Chapter 9.
The narrowing gender gap in American religion
Recent news accounts suggest that among the youngest Americans, men are more religious than women. This would be a major reversal from the past. Historically, U.S. women consistently have exhibited higher levels of religiousness (on average) than men.14
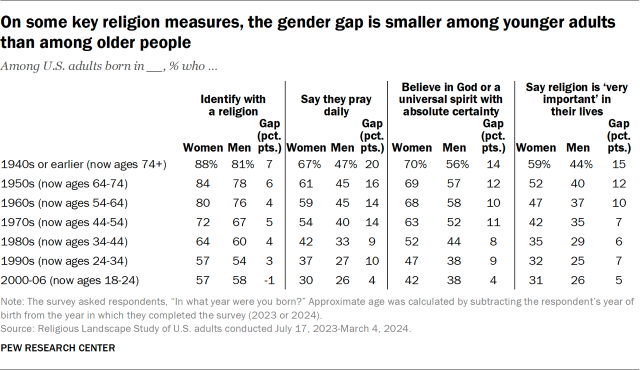
In the new RLS, women continue to report higher levels of religious affiliation, belief and practice than men do. At the same time, there are signs that the gender gap in religion is narrowing, as it is smaller among younger people than among older Americans.
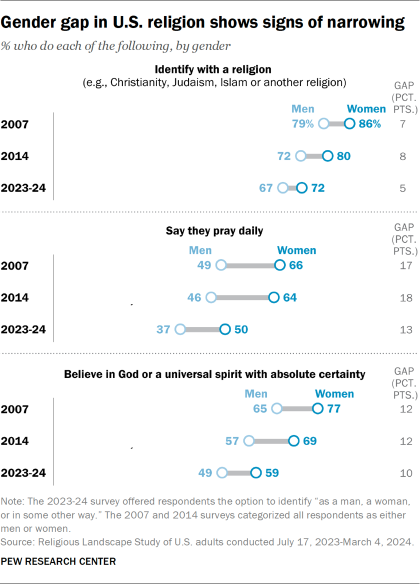
For example, in 2007, the share of women who said they pray every day exceeded the share of men who did so by 17 percentage points. In the new survey, women still report praying at higher rates than men. But the difference is slightly narrower, at 13 points.
Among the oldest adults in the new survey (ages 74 and older), the share of women who say they pray every day is 20 points higher than among men. By contrast, among the youngest adults (ages 18 to 24), the share of women who say they pray daily (30%) is similar to the share of men who say they do the same (26%); the 4-point gap is not statistically significant.
While the gender gap in American religion appears to be narrowing, there are still no birth cohorts in which men are significantly more religious than women. In every age group, women are at least as religious as men, and in many birth cohorts, women are significantly more religious than men.
Religion in childhood and adulthood
The survey shows that Americans’ current religious identities, beliefs and practices are strongly linked with their upbringing. People who say they were raised in religious homes are much more likely to be religious as adults.
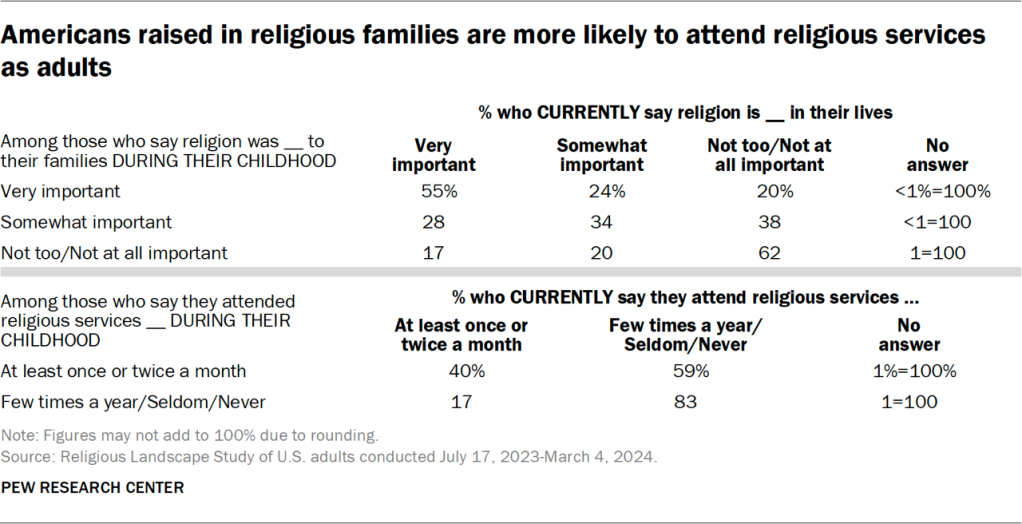
More than half of people who say religion was very important in their families while they were growing up also say religion is very important to them today. By contrast, among people who say religion was not too important or not at all important to their families during childhood, just 17% say religion is very important to them today.
The survey finds a similar pattern on questions about religious attendance. People who grew up attending religious services regularly (at least once a month) are more than twice as likely as those who didn’t grow up attending services regularly to say they now attend religious services at least monthly.
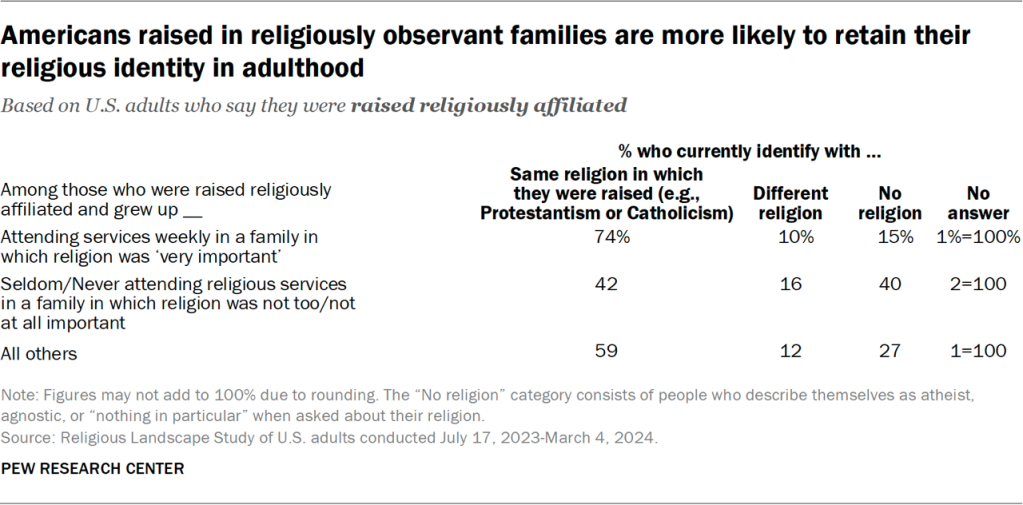
And among all respondents who were raised in a religion (i.e., among those raised Protestant, Catholic, Jewish, Muslim, or as adherents of another religious tradition), those who were raised in highly religious homes are much more likely to have retained their childhood religious identity.
Indeed, 74% of people who were raised in a religion and grew up attending weekly religious services in a family in which religion was very important still identify with their childhood religion today; 15% of respondents who grew up in this kind of environment now say they have no religion, and 10% identify with a religion different from the one in which they were raised. (Refer to the section on religious switching for details about retaining or leaving one’s childhood religion in adulthood.)
By contrast, among people who were raised in a religion but grew up seldom or never attending religious services – and in a family in which religion was not too important or not at all important – fewer than half still identify with their childhood religion. Instead, most now say they have no religion (40%) or identify with a religion different from the one in which they were raised (16%).
In short, for many people, a religious upbringing leads to a religious adulthood.15 But the survey also indicates that raising children in a religious environment is no guarantee that those children will grow up to be religious as adults.
Indeed, 40% of U.S. adults say they attend religious services less often today than they did as children. Just 5% say they attend religious services more often today than they did as kids.
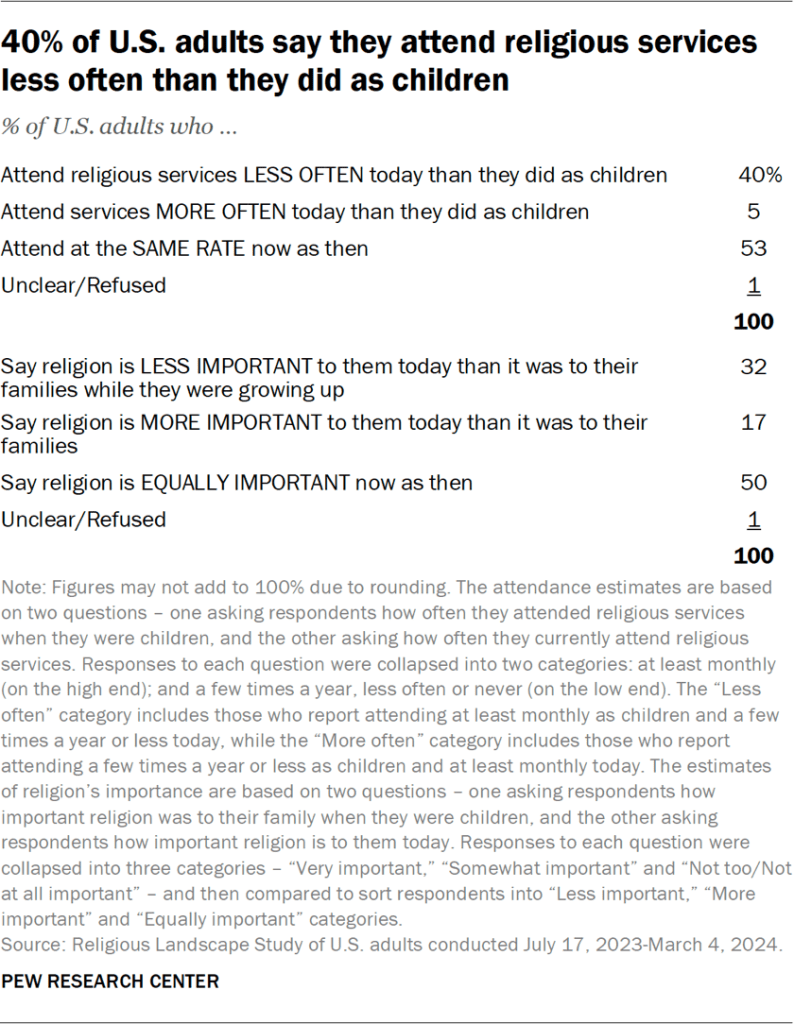
And 32% of U.S. adults say religion is less important to them today than it was to their families when they were growing up. By contrast, 18% say religion is more important to them today than it was to their families when they were children.
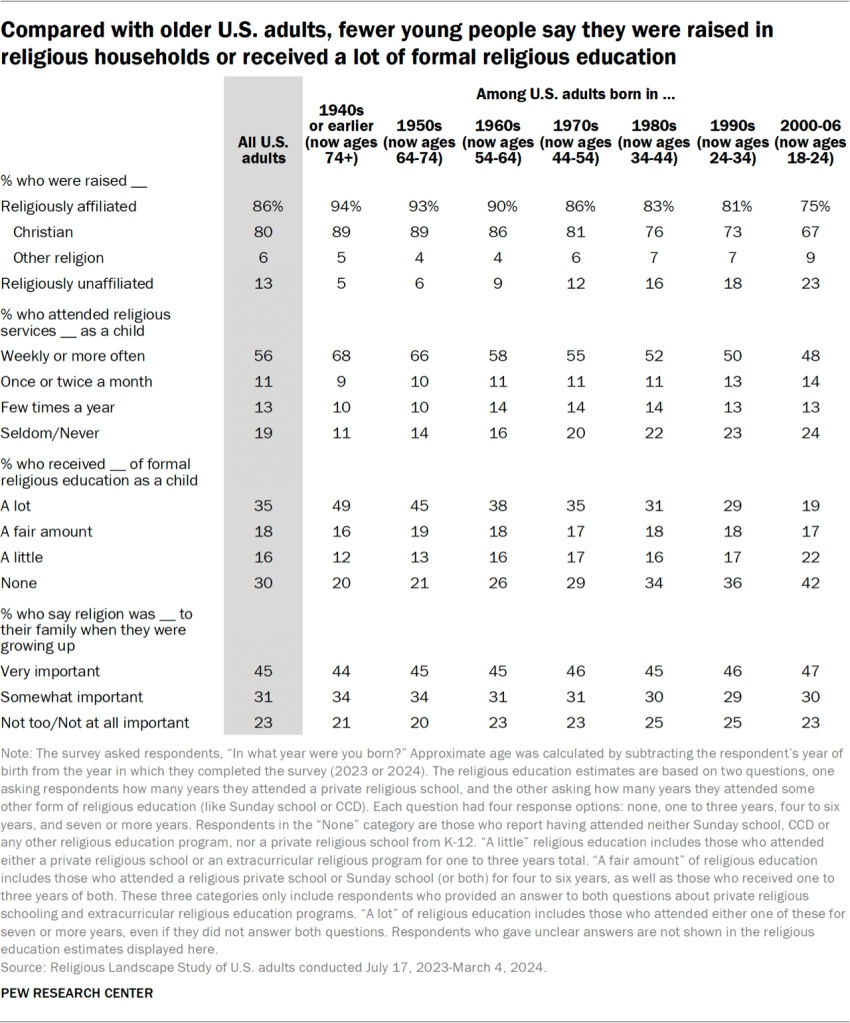
Compared with their elders, today’s youngest adults are less likely, by a variety of measures, to say they had a religious upbringing. For example, more than nine-in-ten adults ages 74 and older say they were raised in a religion, including 89% who were raised Christian. Among U.S. adults who were roughly between 18 and 24 when the survey was conducted, 75% were raised in a religion, including 67% who were raised Christian.
Two-thirds of the oldest Americans say they grew up going to religious services at least once a week. Only about half of the youngest adults say the same.
And while half of the oldest adults say that as children they received a lot of formal religious education (i.e., seven or more years), just 19% of today’s youngest adults say the same. People in the youngest age group are about twice as likely as those in the oldest age group to say they received no formal religious education at all (42% vs. 20%).
There is one exception to this pattern: Young adults are not less likely than older Americans to say religion was very important to their families when they were children. Among adults who were roughly between the ages of 18 to 24 when the new survey was conducted, 47% say religion was very important to their families when they were growing up. Among adults ages 74 and older, 44% say the same.
Moreover, the persistence of a high level of religiousness from childhood into adulthood – the “stickiness” of a religious upbringing – appears to be declining, while the stickiness of a nonreligious upbringing seems to be increasing.
In the oldest cohort of U.S. adults (ages 74 and older), 51% of those who say they grew up attending religious services weekly in families for whom religion was very important are still highly religious in these ways (i.e., they still go to services weekly and still say religion is very important in their lives).
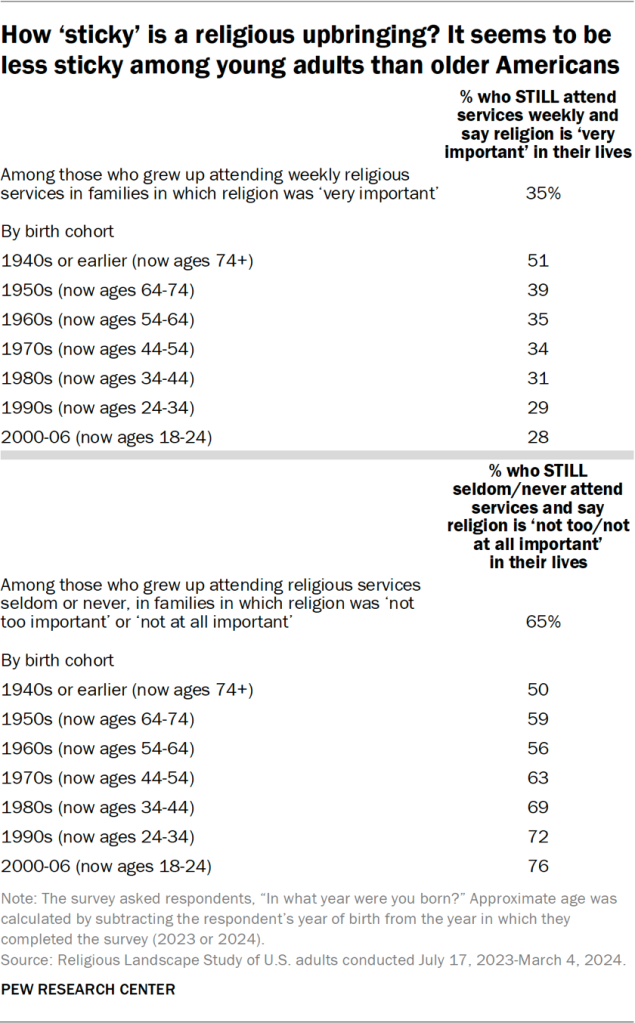
And among people in this oldest cohort, 50% of those who say they grew up seldom or never attending religious services in families in which religion was not too important or not at all important still describe themselves as nonreligious in these ways (i.e., they still rarely or never go to services, and still say religion is not important in their lives).
In other words, a highly religious upbringing has proved to be just as “sticky” as a nonreligious upbringing over the lifetimes of the oldest Americans (now 74 and older).
By contrast, among the youngest U.S. adults in the survey (now ages 18 to 24), just 28% of those raised in highly religious homes are, today, highly religious themselves. Meanwhile, 76% of young adults who grew up rarely or never attending services, in families in which religion was unimportant, still say they don’t attend religious services and that religion is not important to them. In other words, a highly religious upbringing has been much less persistent (or “sticky”) than a nonreligious upbringing so far in the lifetimes of the youngest U.S. adults.
Of course, it’s possible that the effect of a highly religious upbringing just needs time to develop. Maybe the people in the youngest cohort will grow more religious as they age, and if they are surveyed again in 20 or 30 years, a highly religious upbringing will appear stickier than it does now. However, there is no evidence in the three Religious Landscape Studies conducted since 2007 that any birth cohorts have grown more religious over the long term, as discussed below in the section on how religious beliefs change as people age.
For more information on Americans’ religious upbringing, refer to Chapter 4.
Religion in U.S. families today
Raising children
Among parents of minor children – i.e., people currently raising children under 18 in their homes – 40% say they send their child or children to some kind of religious education or private religious school.
By comparison, 51% of parents say they, themselves, received a fair amount or a lot of religious education as children, while 16% received a little, and 33% had none.
However, these questions about the respondent’s own religious education and the religious education of their kids are not exactly parallel. The survey asked respondents to report how many years of religious education they received as children, whereas parents were asked whether their minor children are currently enrolled in a religious private school or other religious education programs. Some parents may not have children enrolled right now but may enroll them later or may have enrolled them in the past.
Among parents living with minor children in their homes, 42% say they read scripture or pray with their children. The survey did not ask respondents whether (or how often) they used to read scripture with their parents or prayed with their parents when they were children themselves.
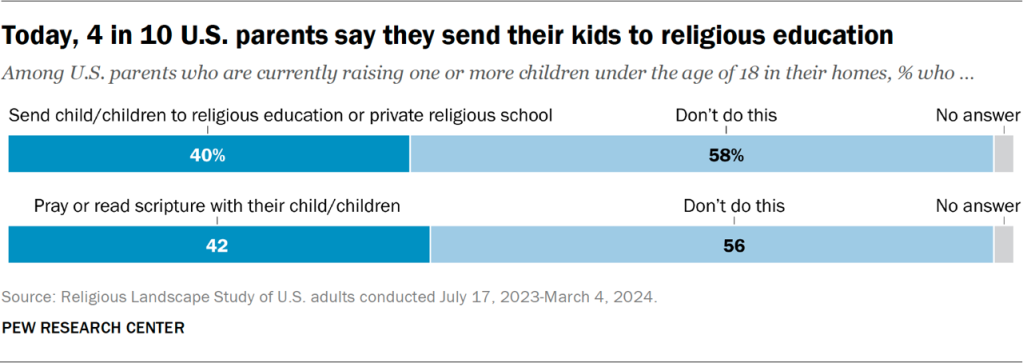
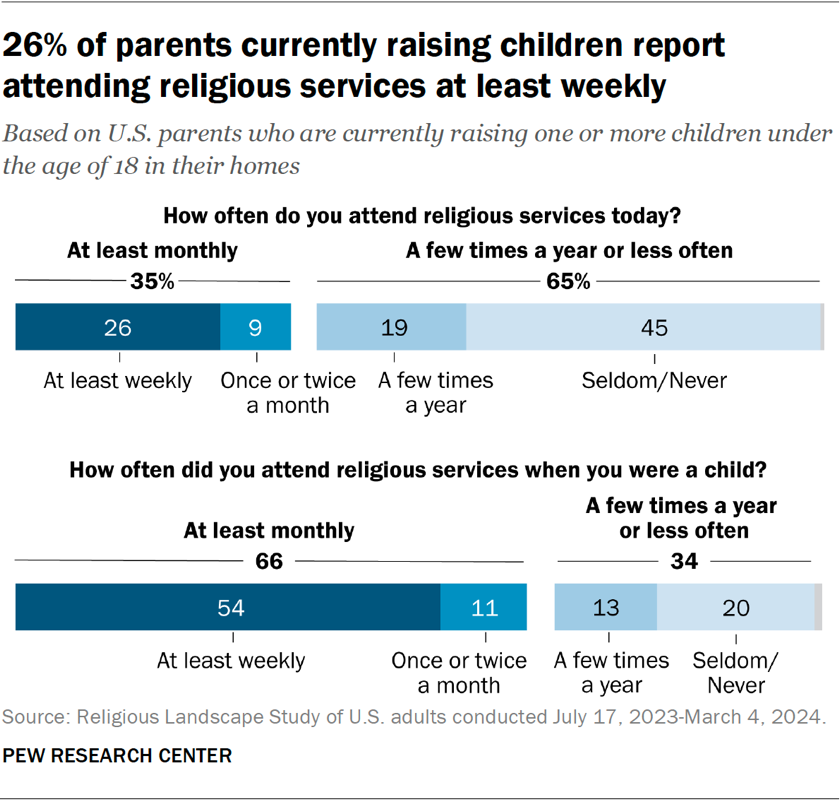
Overall, 26% of people who are currently raising children say they go to religious services at least weekly, and an additional 9% say they go to religious services once or twice a month. The survey did not ask current parents whether they take their children with them when they go to religious services. But, even if all 35% do take their children with them to services, this still would be a much smaller percentage than the roughly two-thirds of parents who say they went to services at least monthly when they were growing up.16
For more on how parents in different religious traditions are raising their children, refer to Chapter 6.
Religious intermarriage
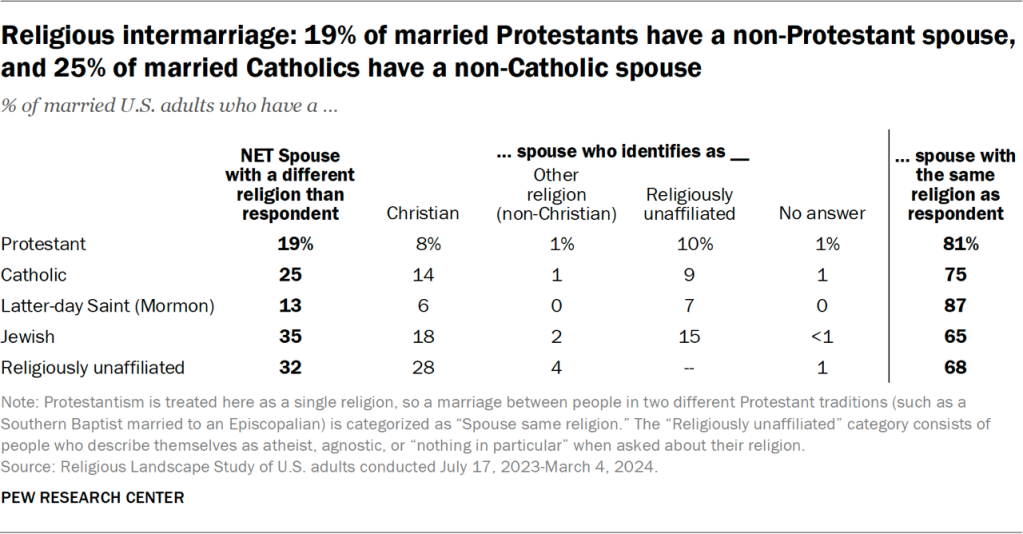
In the new survey, 26% of married adults say their spouse has a religious identity different from their own. That’s virtually identical to what we found in the 2014 RLS (25%).
One-quarter of married Catholics in the new survey say they are married to a non-Catholic spouse, including 14% who are married to a spouse from another Christian tradition and 9% who are married to a spouse with no religion.
About one-in-five married Protestants say they have a non-Protestant spouse, including 8% who have a spouse who identifies with another Christian faith and 10% whose spouse has no religion.
Roughly one-third of married “nones” say their spouse identifies with some religion, in most cases a branch of Christianity.
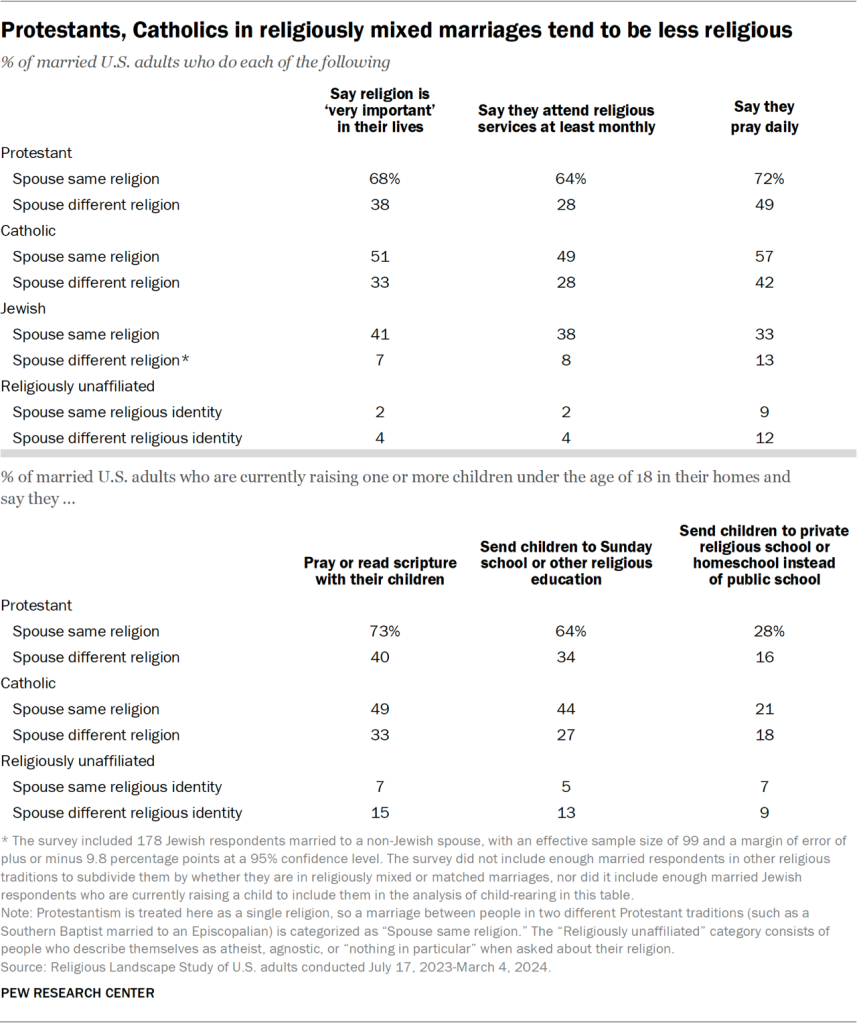
Protestants, Catholics and Jews who are in religiously mixed marriages are far less religiously active, on average, than those with spouses who share their religion.
For example, 68% of Protestants married to other Protestants say religion is very important in their lives, compared with 38% of Protestants married to non-Protestants who say this. And 49% of Catholics married to fellow Catholics say they go to church at least once or twice a month, compared with 28% of Catholics married to non-Catholics who say they attend this often.
These differences carry over into child-rearing. Among parents of minor children, Protestants married to fellow Protestants are significantly more likely than Protestants married to non-Protestants to say they pray or read scripture with their kids and send their children to religious education. For the most part, a similar pattern holds for Catholics.
These patterns raise an interesting question: Does being in a religiously mixed marriage make people less religious, or are nonreligious people more likely to enter religiously mixed marriages? The survey cannot answer this question; it’s possible that both things are at play.
Meanwhile, religiously unaffiliated people married to spouses who identify with a religion tend to be a little more religiously active, on average, than religiously unaffiliated people married to spouses who are also unaffiliated.
For instance, 12% of married “nones” whose spouses identify with a religion say they pray daily, compared with 9% of married “nones” who have a fellow “none” as a spouse. And 13% of religious “nones” who are currently parenting a minor child and who are married to a religiously affiliated spouse say they send at least one of their children to religious education, compared with 5% of religious “nones” who are married to a religiously unaffiliated spouse.17 The differences are quite small, though, as are the overall shares of “nones” who say they are religiously active in these ways – regardless of whether they are married to a fellow “none,” or not.
For more on religious intermarriage, refer to Chapter 4.
Religious switching
Overall, 35% of U.S. adults have switched religions between childhood and adulthood. That is, they say they currently identify with a religion (or with no religion) that is different from the religion in which they were raised.
This figure includes people who switched from one Christian religious tradition to another (e.g., those who say they were raised Protestant but now identify as Catholic or vice versa), as well as people who switched from one non-Christian religion to another (e.g., those who say they were raised Hindu and now identify as Buddhist or vice versa).18 It also includes people who switch from identifying with a religion to describing themselves as religiously unaffiliated (or vice versa).
The share of people in the new survey who say they switched religions is on par with the share who said this in 2014.
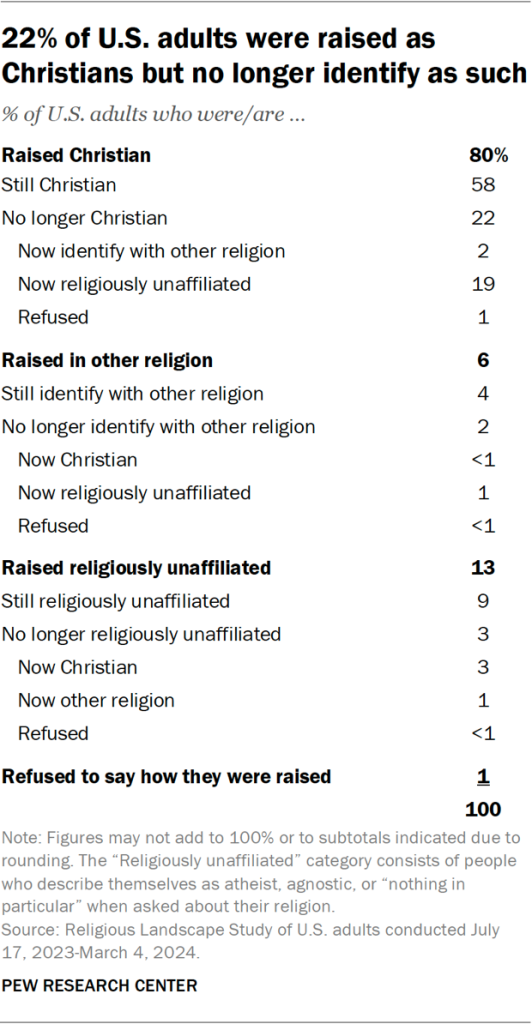
When we divide the data into just three categories – Christianity, other religions and no religion – it shows very clearly that Christianity loses far more people than it gains through religious switching. Fully 80% of U.S. adults say they were raised Christian, but upward of a quarter of them (22% of all U.S. adults) no longer identify as Christians.
By contrast, religious “nones” gain far more people than they lose through religious switching. Overall, 13% of U.S. adults say they were raised in no religion. But fully 20% of U.S. adults now say they are religiously unaffiliated after having been raised in a religion, including 19% who were raised Christian and 1% who were raised in other religions.
Expressed as a ratio, these figures mean that there are six former Christians for every convert to Christianity in the United States. The balance is especially lopsided for Catholicism (which loses 8.4 people through religious switching for every convert to the religion). But Protestants also lose more people than they gain through switching, by a ratio of 1.8 to one.
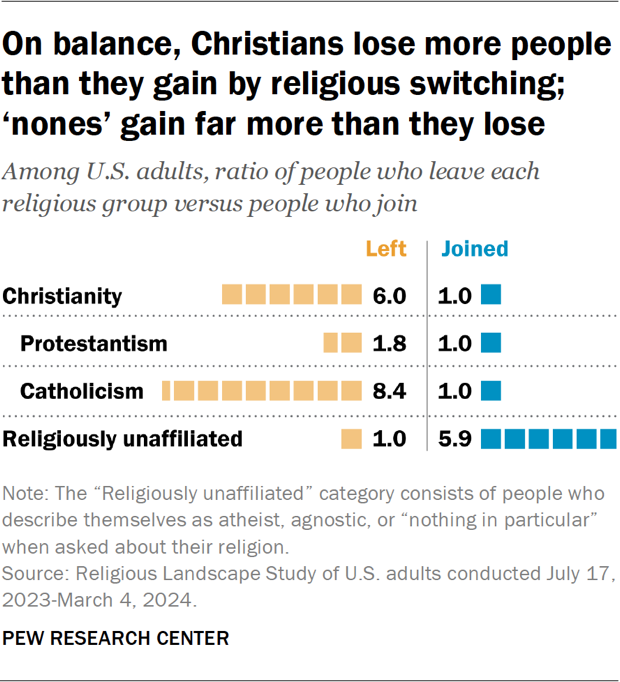
In stark contrast, the religiously unaffiliated gain nearly six people for every person they lose through religious switching. That is, there are about six times as many Americans who say they were raised in a religion and no longer identify with a religion than there are who say they were raised in no religion but now identify with one.
In the aggregate, religions other than Christianity gain about as many people as they lose through religious switching. Overall, 3% of the public identifies with a religion other than Christianity after having been raised Christian or with no religion (or they did not answer the question about their childhood religion). And 2% of U.S. adults say they were raised in a religion other than Christianity but no longer identify with it.
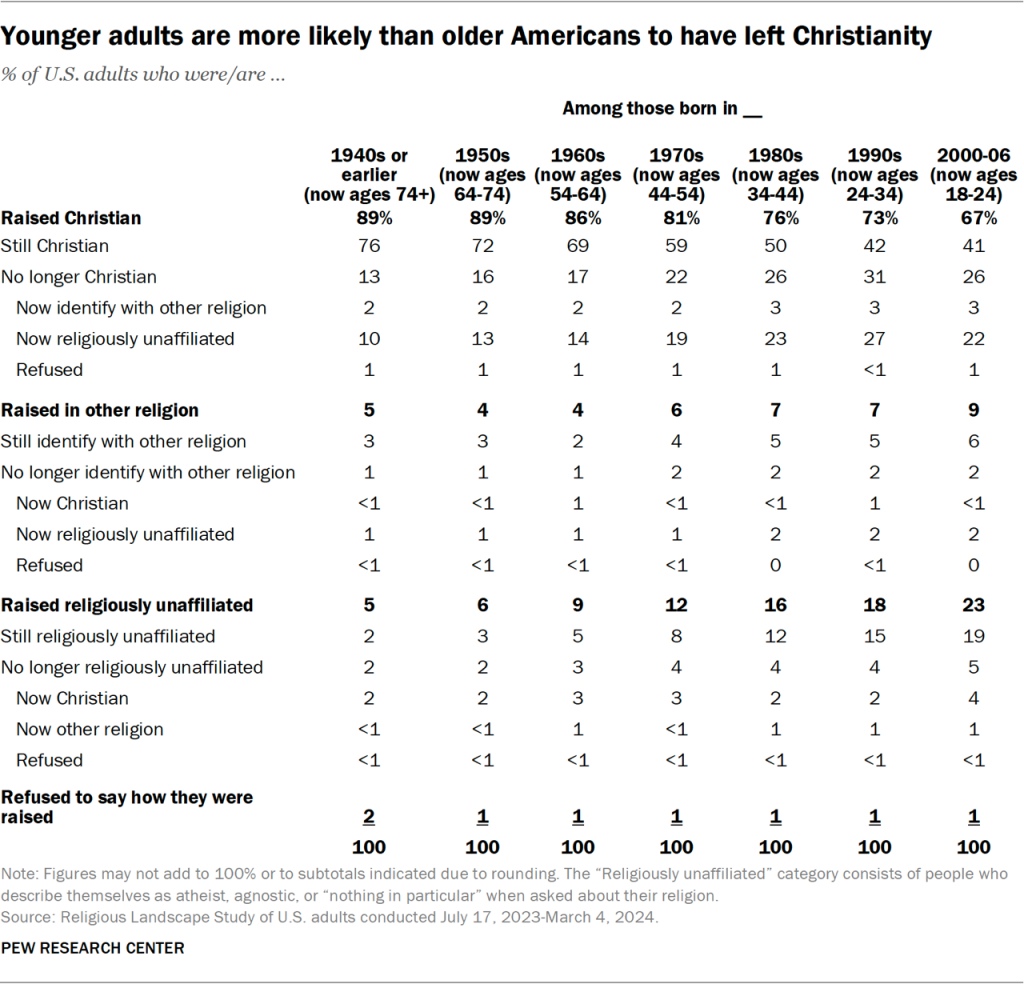
The survey shows big differences in religious switching patterns across age groups, which helps explain the long-term declines in religious affiliation, especially for Christianity. Vast majorities of older adults (89% of those born in the 1950s or earlier) say they were raised Christian, and most of them are still Christian today. Relatively few older adults say either that they were raised in no religion or that they have become religiously unaffiliated after having been raised as Christians.
Smaller majorities of young adults were raised as Christians, and fewer of them have retained their Christian identity in adulthood. Young people are more likely than older adults to have been raised in no religion and, also, more likely to have become religiously unaffiliated after having been raised as Christians.
Interestingly, among the youngest adults – those born between 2000 and 2006, who were ages 18 to 24 when the survey was conducted – the share who were raised Christian and are still Christian is about as high as among those born in the 1990s, who were 24 to 34 when the survey was conducted (41% vs. 42%). And the youngest cohort is slightly less likely than the second-youngest cohort to have left Christianity.
Jump to Chapter 2 to see the retention rates of different religious groups (i.e., what percentage of all the people raised in each group still identify with that group today).
Signs of strengthening spirituality
When asked how their levels of spirituality may have changed over the course of their lifetimes, Americans who say they have become more spiritual outnumber those who say they have become less spiritual by a roughly four-to-one margin (43% vs. 11%).
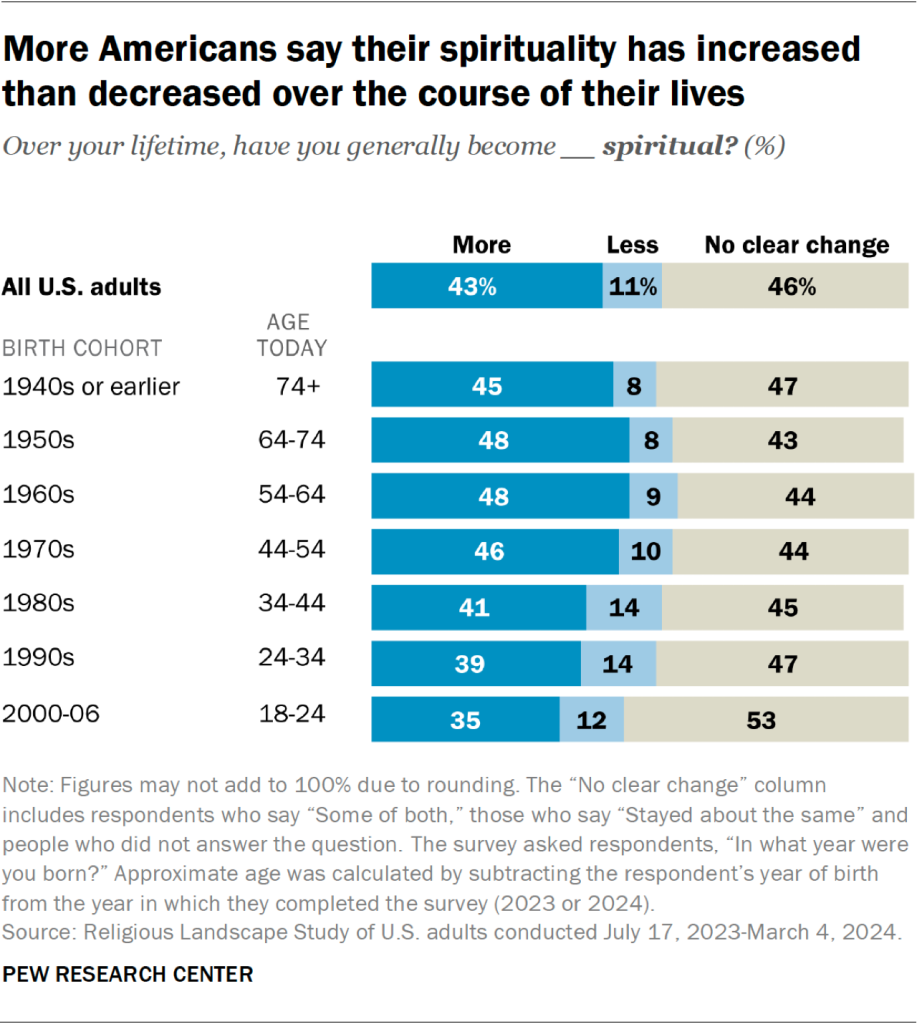
Moreover, the survey finds that Americans of all ages are more likely to say their spirituality has grown stronger than to say it has weakened.19
Large majorities of the U.S. public believe that people have a soul or spirit in addition to their physical bodies, that there is something spiritual beyond the natural world, and that there is an afterlife.
And although younger Americans are less traditionally religious than older adults (as measured by rates of prayer, identifying with a religious group, attending religious services, and some other beliefs and practices), the age gaps are much smaller on several of the survey’s questions about spirituality.20
For instance, 82% of adults who were roughly between the ages of 18 and 24 when the survey was conducted say they believe people have a soul or spirit in addition to their physical body – only slightly lower than the share of today’s oldest adults who affirm the same belief.
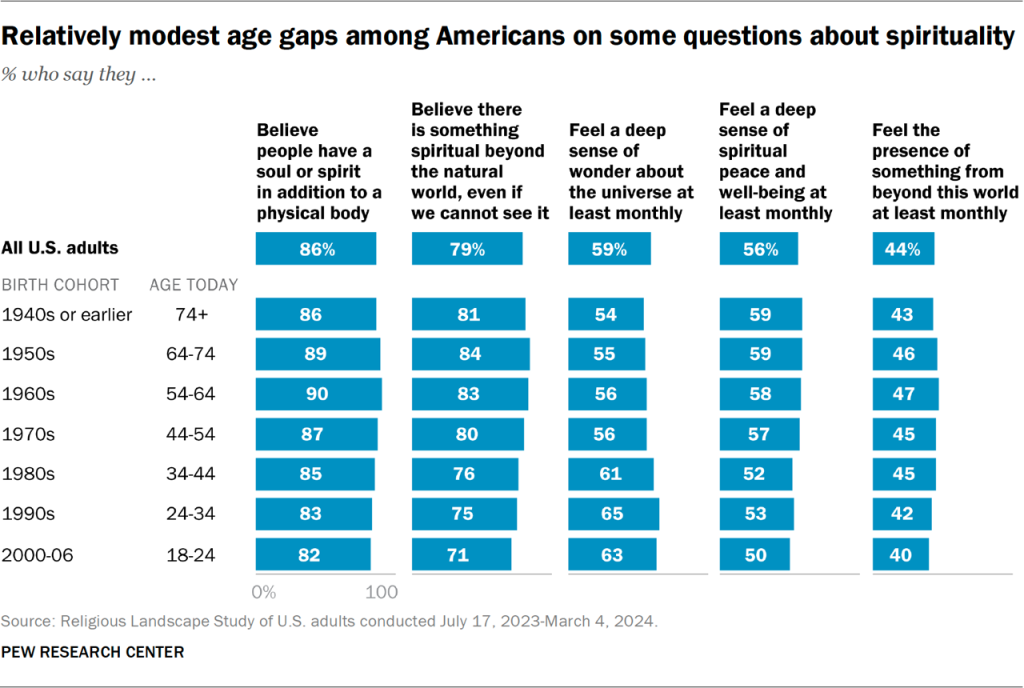
And 63% of today’s youngest adults say they feel a deep sense of wonder about the universe at least monthly, which is somewhat higher than the share of today’s oldest adults who say the same.
The survey finds that Americans who say their spirituality has increased are more likely than other adults (especially those who say their spirituality has declined) to say they regularly feel awe at nature’s beauty, feel a sense of spiritual peace, and experience the presence of something from beyond this world.
Americans who say their spirituality has grown also are more inclined than others to say they believe in God or a universal spirit, and to say they pray daily.
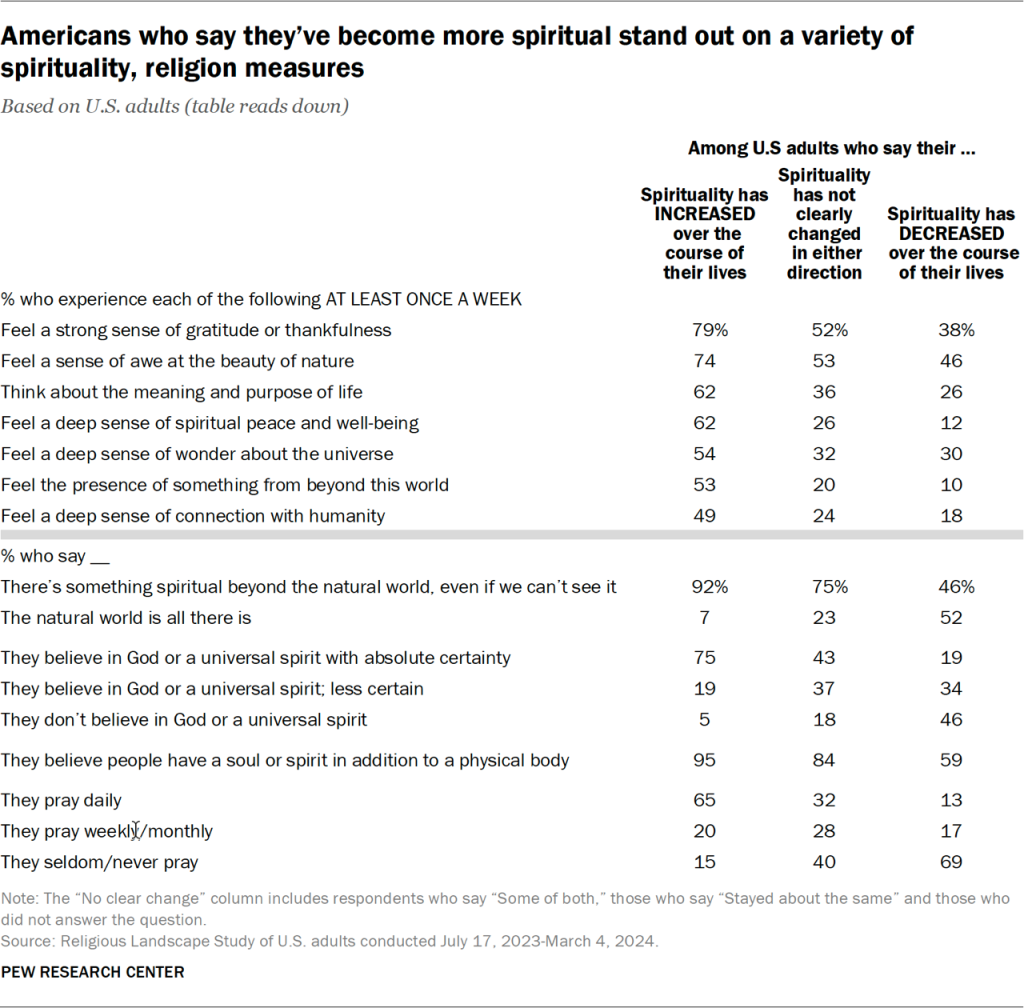
These results suggest that spirituality and religion are not necessarily in tension with each other. We know from previous research that many people view spirituality and religion as complementary; some see no difference between them.
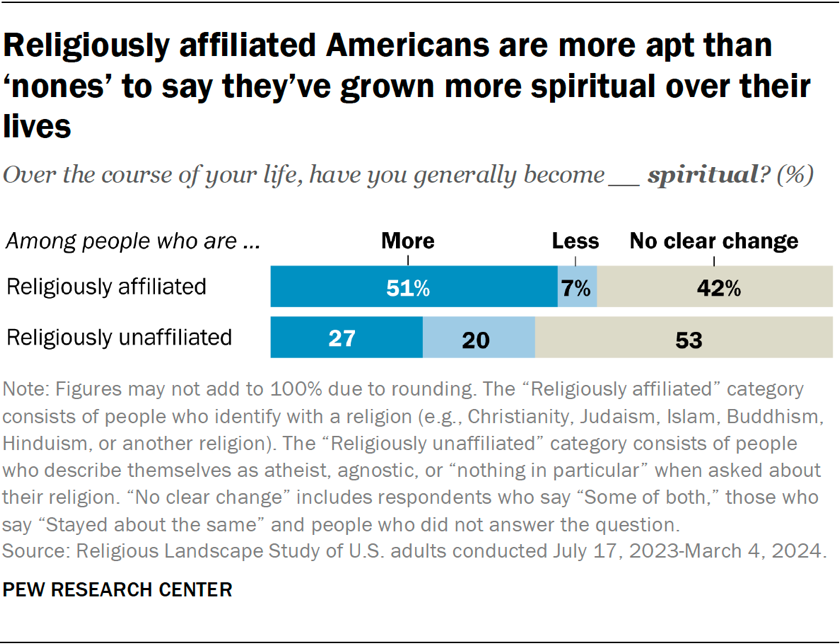
Indeed, the new survey finds that people who identify with a religion are more likely than religiously unaffiliated Americans to say they have grown increasingly spiritual during their lives.
Religiously affiliated people also are more inclined than religious “nones” to believe in God or a universal spirit, to pray daily, and to report that they experience a variety of spiritual sensations, such as “the presence of something from beyond this world.”
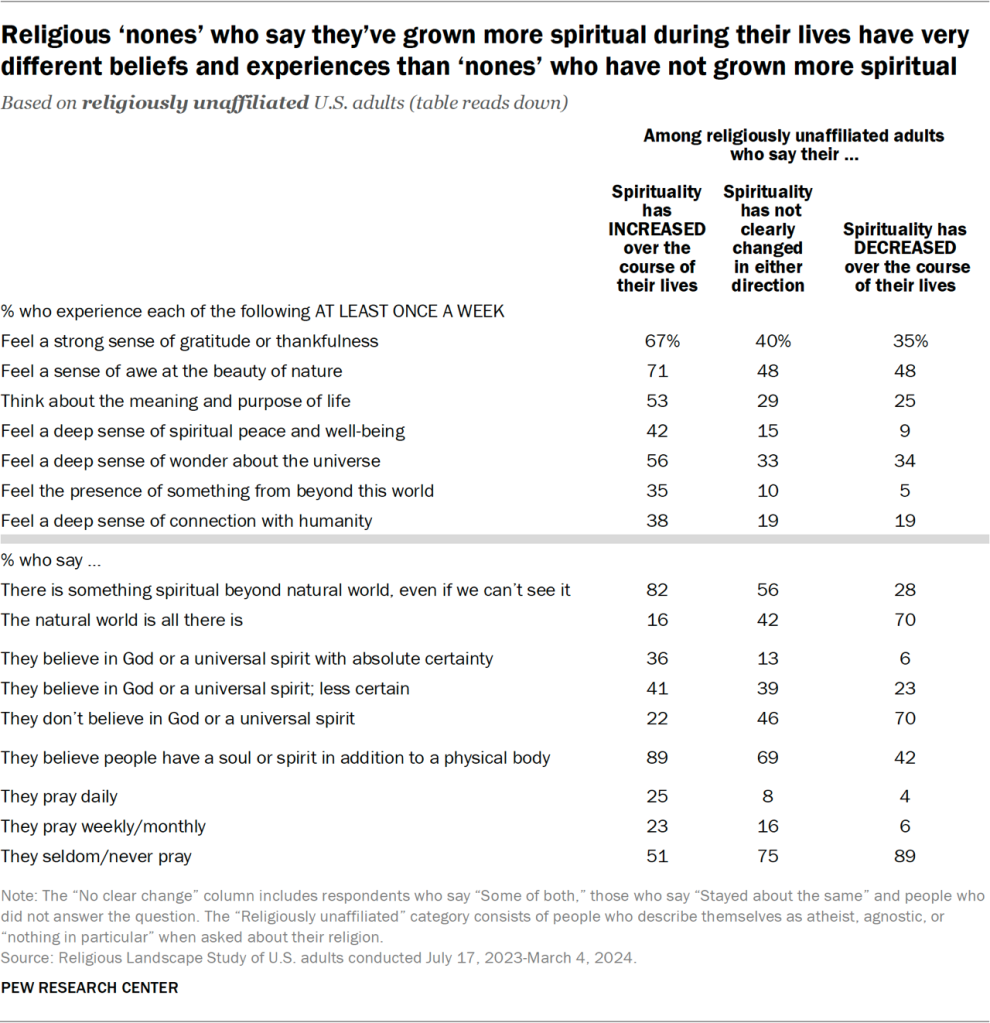
Among the “nones,” those who say they’ve grown more spiritual during their lives are more likely than other religiously unaffiliated people to say that people have souls or spirits in addition to their physical bodies, that there is something spiritual beyond the natural world, and that they regularly feel a sense of awe at the beauty of nature.
Attendance at religious services
The 2023-24 RLS finds a substantial age gap in attendance at religious services. Most young adults say they go to religious services no more than a few times a year. Indeed, among people born since the 1980s, about half or more say they seldom or never attend religious services.
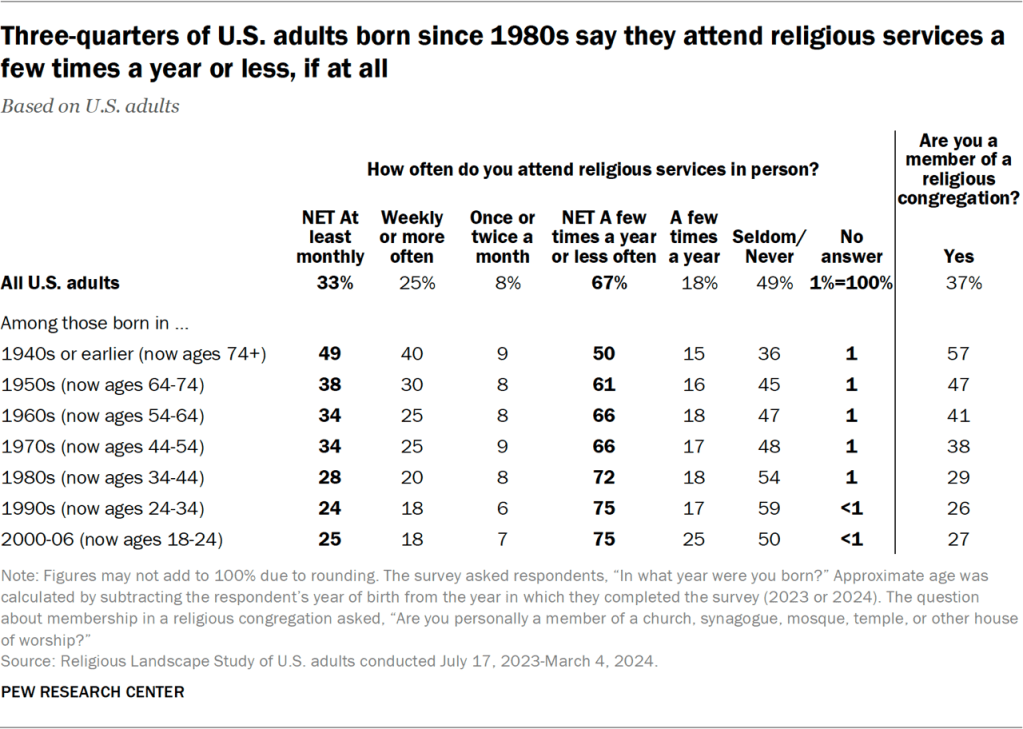
By comparison, older adults report attending religious services at far higher rates. Furthermore, 57% of people in the oldest cohort say they are members of a religious congregation, compared with 27% of the youngest adults.
Does this mean that attendance at religious services is declining? Not necessarily. The age gap, by itself, is not proof that fewer people are attending services, because it is theoretically possible that people participate in religious services at higher rates as they get older. Perhaps today’s young adults will go to a church, synagogue, mosque or other house of worship more often when they reach middle age or retirement age than they do today.
Moreover, we do not have a clear, long-term trend line for attendance at religious services because the new survey’s findings about rates of religious attendance cannot be directly compared with the previous landscape studies.
The earlier studies in 2007 and 2014 were conducted by telephone, while the new survey was conducted mainly online or on paper. Previous research shows that these different ways (or “modes”) of conducting surveys produce significantly different results on the question “How often do you attend religious services?” This makes it hard to determine, over the long term, how much religious attendance has changed.
However, the Center’s telephone surveys were showing a decline in religious attendance in the years before we switched to online/paper surveys. The share of Americans who reported attending religious services at least monthly dropped from 54% in 2007 to 50% in the 2014 Religious Landscape Study and had fallen to 45% by 2018-19 (which is when the Center last regularly conducted telephone surveys that asked about religious attendance).
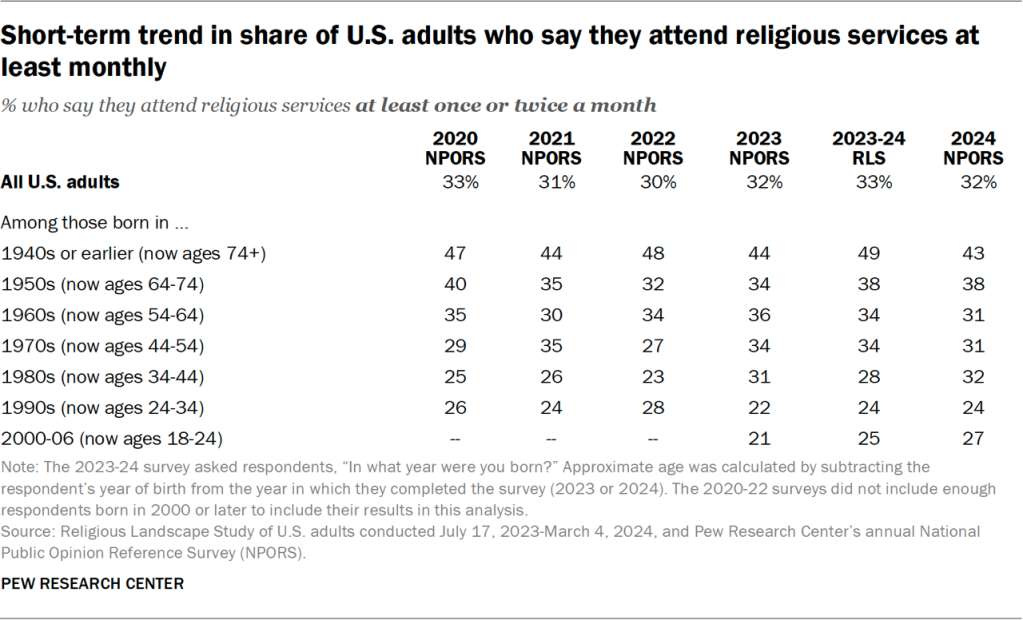
But the short-term trend line for the share of Americans who attend religious services at least monthly is pretty flat. In Pew Research Center’s 2020 NPORS, 33% of U.S. adults reported attending religious services at least once or twice a month. That’s identical to what we found in the 2023-24 RLS and very similar to the 32% measured in the 2024 NPORS.
How religious beliefs change as people age
When asked to describe how their own religiousness has changed over their lifetimes, the most common response people give is that there has been no clear change in either direction – up or down – over the course of their lives (44% of U.S. adults say this). This includes people who say they have sometimes grown more religious and other times less religious; people who say their level of religiousness has not changed very much; and people who don’t answer the question. This is the most common kind of response among respondents in every age category.
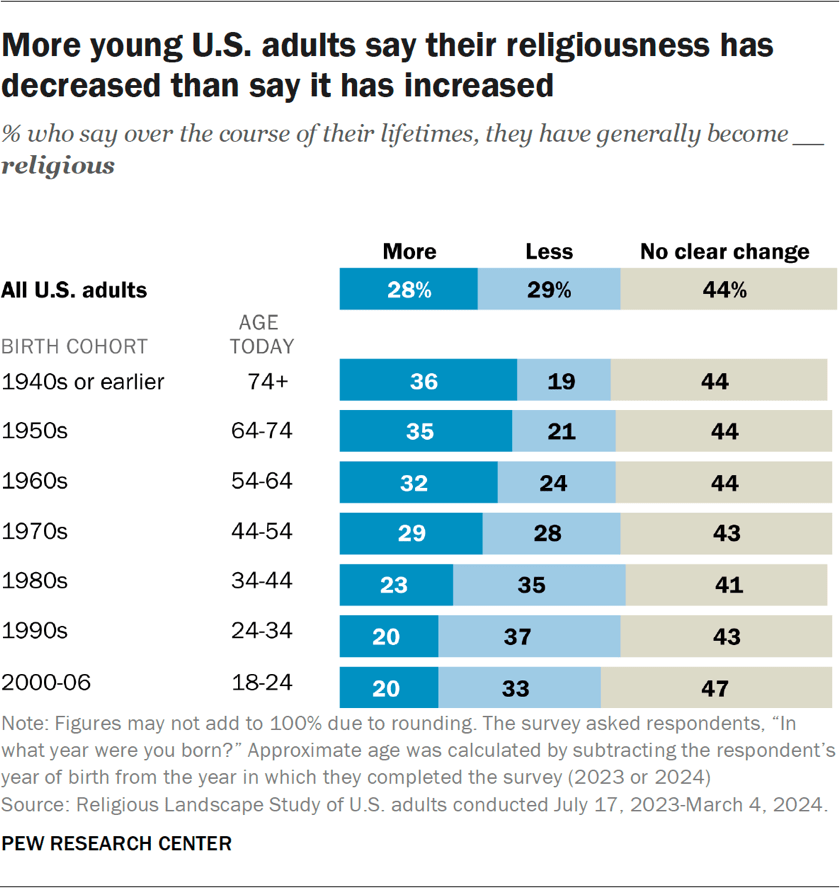
Among people who say their religiousness has changed over the course of their lives, about equal shares say they have become less religious (29%) and more religious (28%).
The new RLS also finds that more young adults say their religiousness has decreased than say it has increased. By contrast, older U.S. adults are more likely to say their religiousness has increased than that it has decreased.21
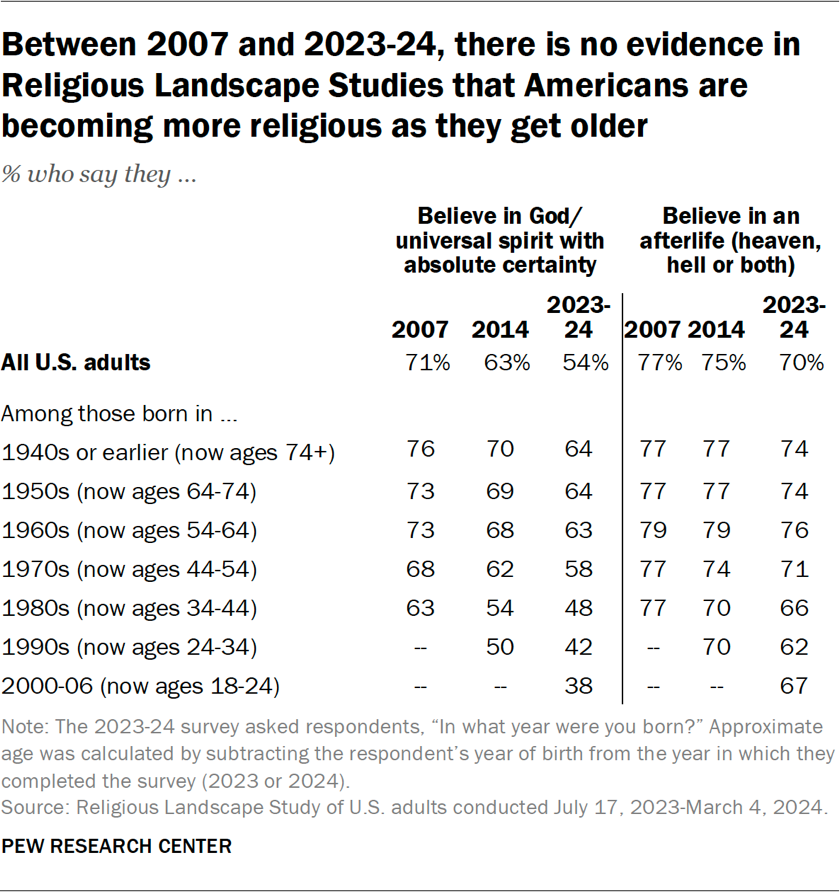
However, on the questions in the new survey that can be directly compared with the previous studies, there is no evidence that people in older birth cohorts have grown more religious between 2007 and today.
In the three Religious Landscape Studies conducted over the past 17 years, there are no birth cohorts – neither the oldest Americans, nor the youngest, nor any cohort in between – that have grown more prayerful, more certain in their belief in God, more likely to believe in an afterlife (heaven, hell or both), or more likely to identify with a religion, including Christianity.
This may seem at odds with the retrospective answers that survey respondents give to questions about how their own religiousness and spirituality have changed. As previously noted, about four times as many U.S. adults say they have become more spiritual (43%) as say they have become less spiritual (11%) over their lifetimes, while nearly equal shares say they have become more religious (28%) and less religious (29%).
But substantial numbers of Americans say they haven’t really changed spiritually (46%) or religiously (44%). And the answers people give to these questions may be shaped by many factors, such as how desirable they feel it is to be spiritual and/or religious, and how they understand the meaning of those terms.
Another limitation in understanding how religiousness tends to change as people age is that Pew Research Center’s data on many questions about religion goes back no further than the first Religious Landscape Study in 2007. That 17-year span may not be long enough to capture all the change that has occurred in older birth cohorts. For a longer perspective, we turned to the General Social Survey (GSS), a national survey that has been conducted every year or two since 1972.
The GSS shows that people do tend to become more prayerful as they get older. For example, when people born in the 1960s were just entering adulthood in the early 1980s, 36% said in the GSS that they prayed on a daily basis. By the late 2010s, when people in this birth cohort were in their late 40s and 50s, 64% said they prayed daily. The GSS also reports that people born in the 1950s and 1970s exhibited similar long-term increases in rates of daily prayer.
But the GSS suggests that people do not become more likely to identify with a religion as they get older. There is also little evidence in the GSS that as Americans get older, they tend to become more likely to believe in God or to attend religious services regularly.
For more analysis of GSS data on how the religiousness of people in different birth cohorts has changed or stayed the same over time, refer to Appendix C.22
What is happening to the ‘middle’ of American religion
As the Christian share of the U.S. adult population has declined in recent decades and the public has come to look less religious on a variety of measures, the question arises whether these changes are evidence of religious decline across the board or, instead, a hollowing out of the “religious middle.”
That is, are religious beliefs and practices declining all across the religious spectrum? Or is there a decline only in the share of the population with medium levels of religiousness, accompanied by stability or even growth at both ends of the spectrum of religiousness – resulting in more highly secular people, more highly religious people, and fewer people who are just moderately religious?
The new RLS indicates that the long-term changes in American religion are broad-based and not a hollowing out of the religious middle.
Perhaps the easiest way to illustrate this is by looking at trends in prayer frequency over time. This is the new study’s best indicator of religiousness that can safely and directly be compared with previous RLS results.23 The share of Americans who say they pray daily is clearly down. And the share of Americans who say they seldom or never pray is clearly up. Meanwhile, the share of Americans who say they occasionally pray (on a weekly or monthly basis) is relatively stable. There is no indication of a hollowing out of the “religious middle” on this key indicator.
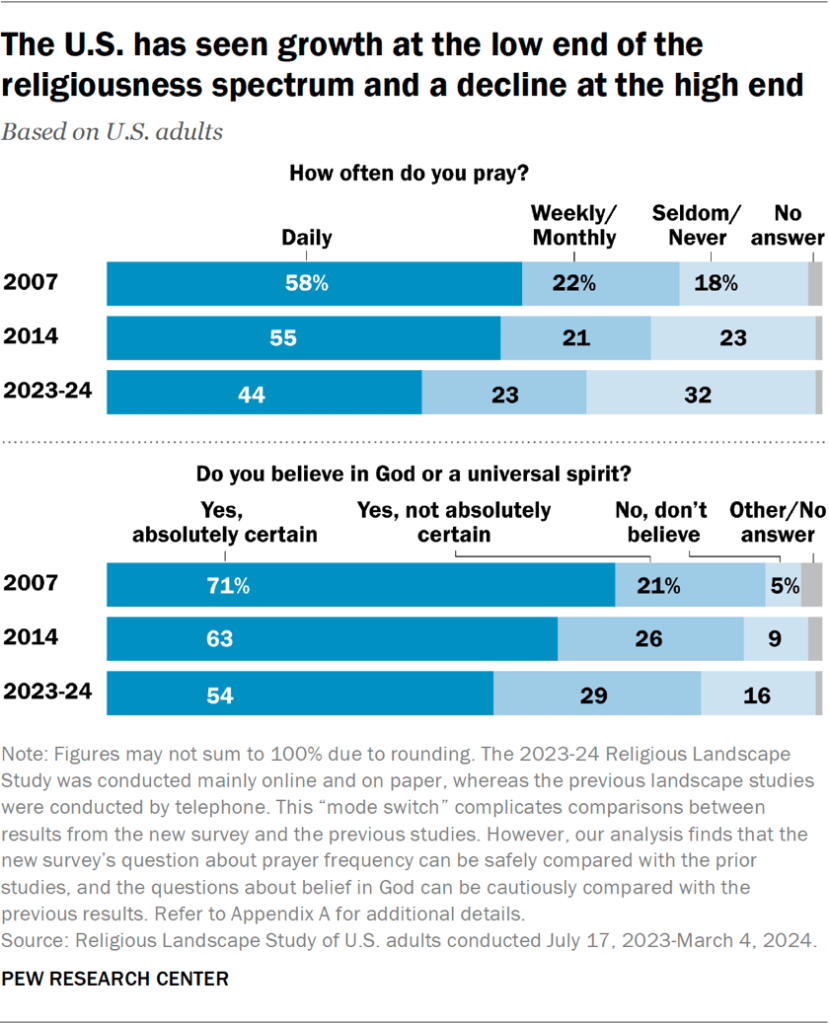
The survey finds a similar pattern in questions about belief in God. The share of Americans who say they believe in God or a universal spirit with absolute certainty has clearly declined, while nonbelief is trending upward. And the share of Americans occupying the middle ground on this question – saying they believe in God but with less than absolute certainty – shows no signs of hollowing out, but rather is rising. The share of adults in the new survey who believe in God but with less than absolute certainty is higher than it has ever been in an RLS survey.24
Another way to assess the evidence for a hollowing out of the religious middle is to look at differences across age groups within the new survey. This allows us to examine additional indicators of religiousness, because looking just at the results of the new survey sidesteps the difficulties posed by the change of survey modes between the previous two Religious Landscape Studies (conducted by telephone) and the new one (conducted mainly online and on paper).
For this analysis, we used four key questions: prayer frequency, belief in God and/or a universal spirit, religion’s importance, and religious service attendance. Responses to each question were assigned numbers from 0 (low) to 2 (high) as follows:
- Prayer frequency: Coded as 0 for those who seldom or never pray, 2 for those who pray daily, and 1 for everyone else.
- Belief in God or a universal spirit: Coded as 0 for those who do not believe in God or a universal spirit, 2 for those who believe with absolute certainty, and 1 for everyone else.
- Religion’s importance: Coded as 0 for those who say religion is not too important or not at all important in their lives, 2 for those who say religion is very important in their lives, and 1 for everyone else.
- Religious attendance: Coded as 0 for those who say they seldom or never attend religious services, 2 for those who attend religious services at least once a month, and 1 for everyone else.
We then added these indicators together to form a scale ranging from 0 (for people who scored 0 on all four measures) to 8 (for respondents who scored 2 on all four measures).25 And we subdivided the scale roughly into quartiles, as follows:
- Low religiousness: Scores of 0 to 1
- Medium-low religiousness: Scores of 2 to 4
- Medium-high religiousness: Scores of 5 to 6
- High religiousness: Scores of 7 to 8
Here again, there is no evidence that religious changes underway in America reflect a shrinking of the “religious middle.” The religious middle is not smaller among the younger cohorts than among the older cohorts, which is what one might expect if a hollowing out of the religious middle were occurring.
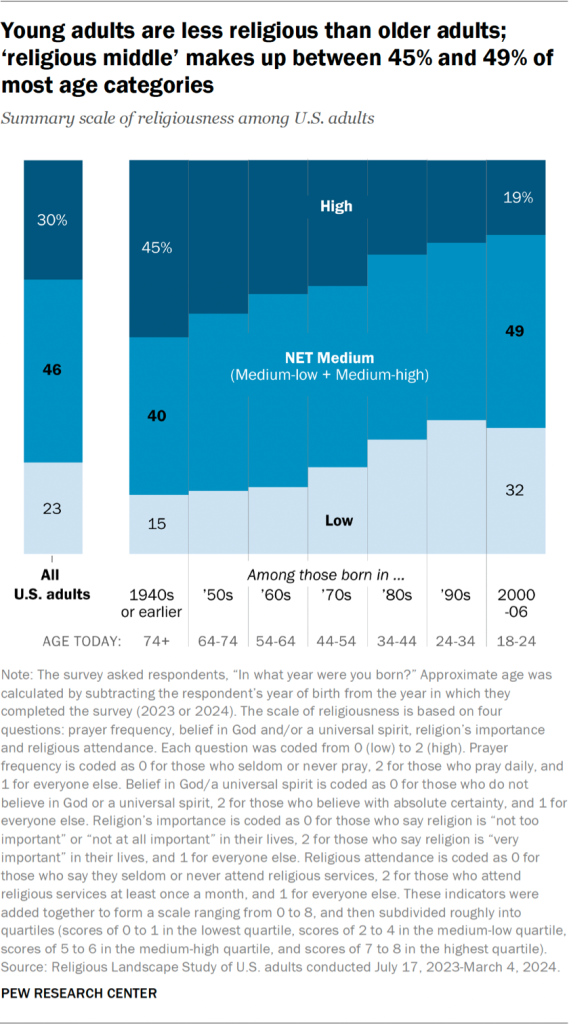
Rather, compared with older adults, younger Americans include far more people at the low end of the religiousness spectrum and far fewer people at the high end. The size of the middle categories of religiousness is in the same ballpark across most age groups. This is exactly the pattern that would be expected if broad-based religious decline (which some social scientists call a process of secularization) were underway.
Trends in the religiousness of Christians
We have already seen that over the long term (since 2007), the Religious Landscape Studies show a substantial rise in the percentage of U.S. adults who are religiously unaffiliated (sometimes called “nones”) and a substantial decline in the percentage who describe themselves as Christians – including declines in all three major Protestant traditions (evangelical, mainline and historically Black Protestant churches).
This raises the question: As the Christian share of the population has shrunk, have Christians become more religious, on average? One might expect that as some Americans leave Christianity and join the ranks of the unaffiliated, those who stay behind and remain Christian would become a smaller but more committed group, with rising average levels of religious belief and practice. Has this happened?
The new RLS offers a mixed answer, with a couple of indicators of religiousness holding steady or rising slightly among U.S. Christians, while two other indicators clearly have declined.
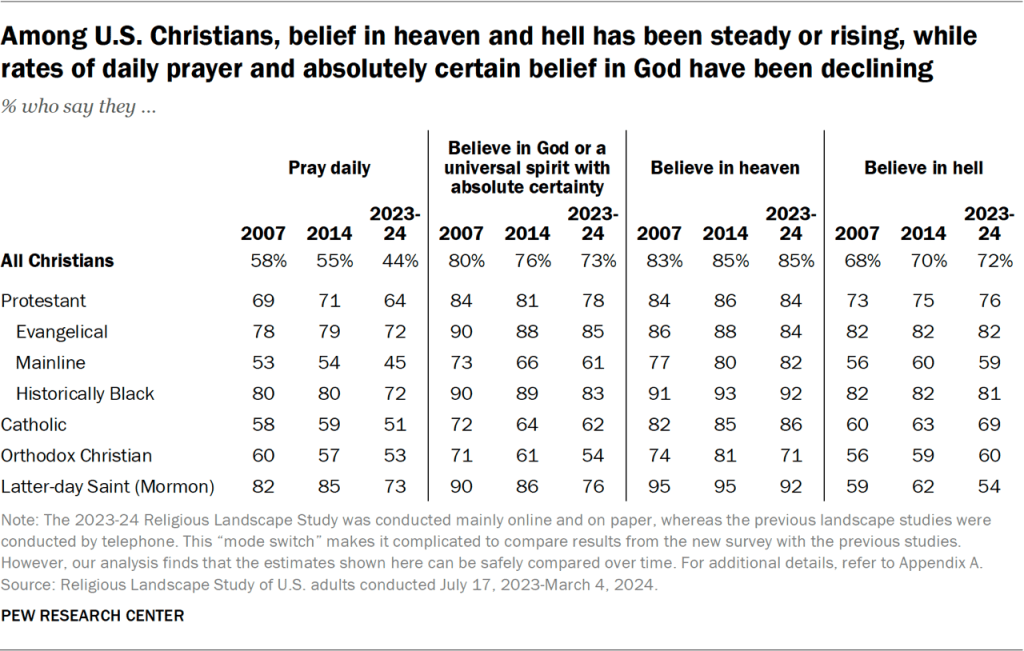
The four questions in the 2023-24 RLS about religious practice and belief that can most readily be compared with the prior studies ask about prayer frequency, belief in God or a universal spirit, belief in heaven and, separately, belief in hell.26
The new survey shows that among Christians, belief in heaven and hell is on par with or slightly higher than in 2007. Belief in heaven now stands at 85% among Christians, compared with 83% in 2007. Meanwhile, 72% of Christians now say they believe in hell, up slightly from 68% in 2007.
But there is no indication that Christians are any more prayerful today than they were in 2007. Indeed, the share of Christians who say they pray every day is markedly lower now (44%) than it was in 2007 (58%).
The share of Christians who say they believe in God with absolute certainty also is lower today than it was in 2007. In the new survey, 73% of Christians say they are absolutely certain God or a universal spirit exists, down from 80% in 2007.
Religion and political polarization
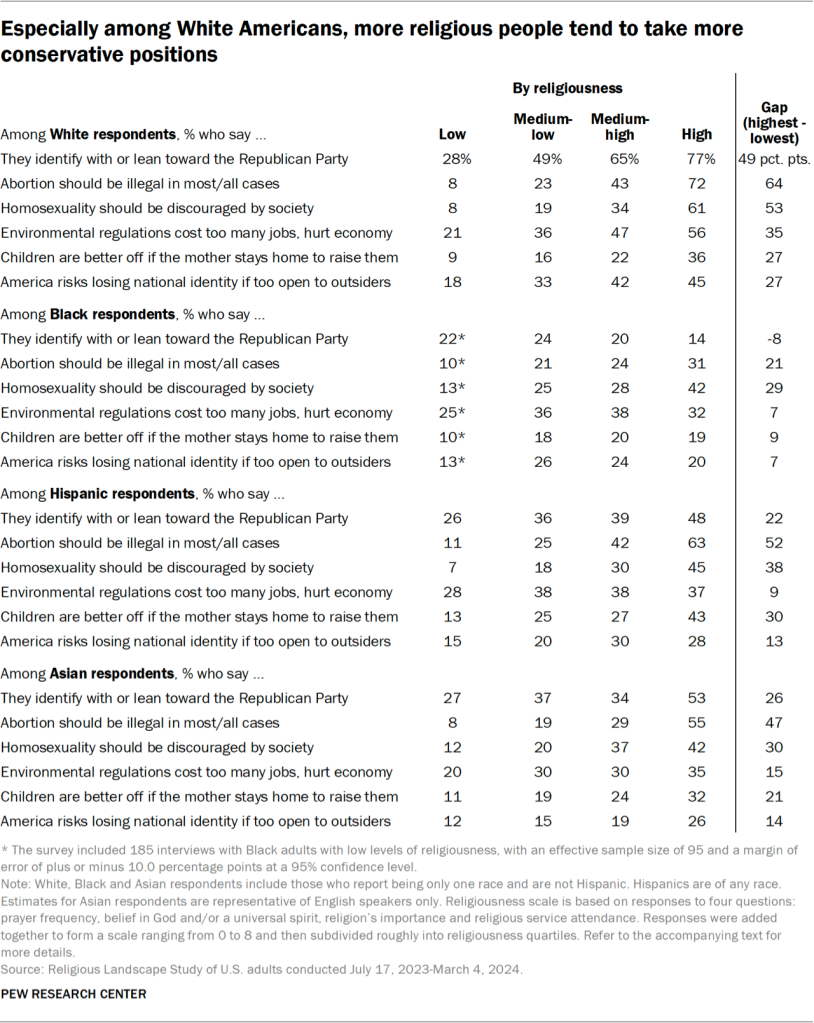
The U.S. is politically polarized, and religion is closely associated with the country’s political divisions. But the new Religious Landscape Study – which was conducted mostly in 2023 and the early part of 2024, before the 2024 presidential election – also finds that the connections between religion and political partisanship vary a lot by race and ethnicity, as described below.
In general, highly religious Americans tend to identify with or lean toward the Republican Party and express conservative views on a variety of social, political and economic questions at much higher rates than do the least religious Americans. Meanwhile, Americans with lower levels of religious engagement tend to identify with or lean toward the Democratic Party and express liberal views on the same gamut of social, political and economic issues.27
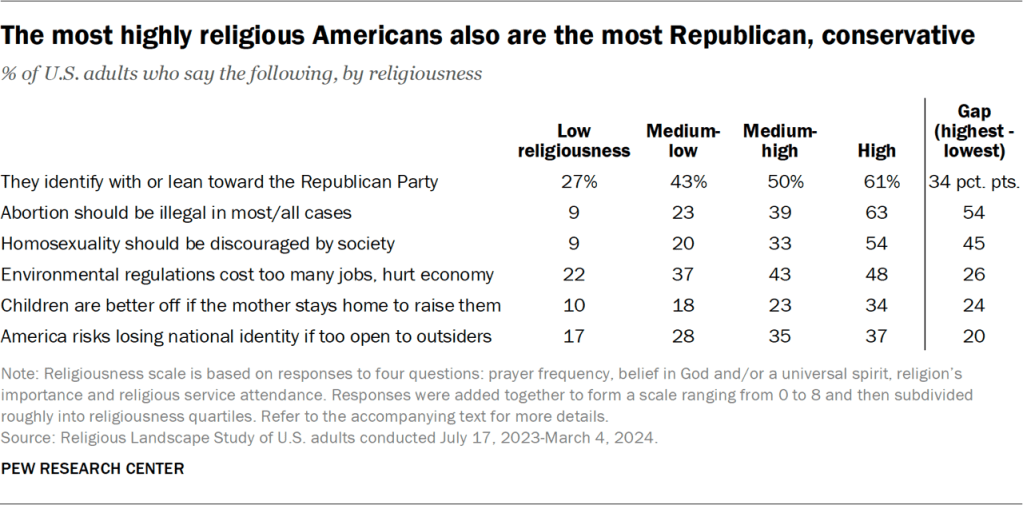
For example, a majority of people in the most highly religious quartile of the U.S. adult population (61%) say they identify with or lean toward the Republican Party. By contrast, in the least religious quartile of the population, just 27% say they identify with or lean toward the GOP.28
Highly religious U.S. adults also are far more likely than the least religious U.S. adults to say that abortion should be illegal, that homosexuality should be discouraged, and that children are better off if their mother doesn’t work and stays home to raise them instead.
There also are religious differences on questions that aren’t directly about sexuality or gender roles. Highly religious people are more inclined than the least religious people to say that environmental regulations cost too many jobs and hurt the economy, as well as to say that too much openness to people from other countries is a threat to America’s identity.
None of the foregoing discussion is meant to suggest that religiousness (or lack thereof) is the primary factor driving Americans’ political opinions. Numerous other factors can help shape political views, including age, gender, education, geography and socioeconomic status. And political partisanship is itself an important factor in people’s views about a host of issues.29
Moreover, the new RLS shows that the links between religion and politics vary quite a bit across racial and ethnic categories. The political differences between Americans with different levels of religiousness are especially large among White respondents. For example, compared with the least religious White Americans, the most highly religious White Americans are:
- 64 percentage points more likely to say abortion should be against the law in most or all cases (72% vs. 8%)
- 53 points more likely to say homosexuality should be discouraged by society (61% vs. 8%)
- 49 points more likely to identify with or lean toward the Republican Party (77% vs. 28%)
- 35 points more likely to say environmental regulations cost too many jobs and hurt the economy (56% vs. 21%)
In other racial and ethnic groups, there also is a relationship between religiousness and political views, with more highly religious people generally expressing more conservative views. However, the differences in political views between people with different levels of religiousness tend to be smaller in other racial and ethnic groups, and they are not seen on every issue.
For example, Black respondents who are highly religious are not more likely than the least religious Black respondents to identify with or lean toward the Republican Party; if anything, highly religious Black adults are somewhat less Republican than Black adults with the lowest levels of religious engagement.
Highly religious Hispanic respondents are, on average, more likely than the least religious Hispanics surveyed to identify with the Republican Party. But the gap in Republicanism among highly religious Hispanic adults and Hispanic adults in the lowest religiousness category is 22 points, much smaller than the 49-point gap among White adults.