Hispanic Americans face a number of challenges when it comes to access to health care and medical treatments. Overall, Hispanic adults are less likely than other Americans to have health insurance and to receive preventative medical care. Language and cultural barriers, as well as factors such as higher levels of poverty, particularly among recent Hispanic immigrants, are among the social and economic dynamics that contribute to disparate health outcomes for Hispanic Americans. The COVID-19 pandemic is a stark illustration of health disparities: Hispanic Americans are far more likely than White Americans to have been hospitalized or died because of the coronavirus.
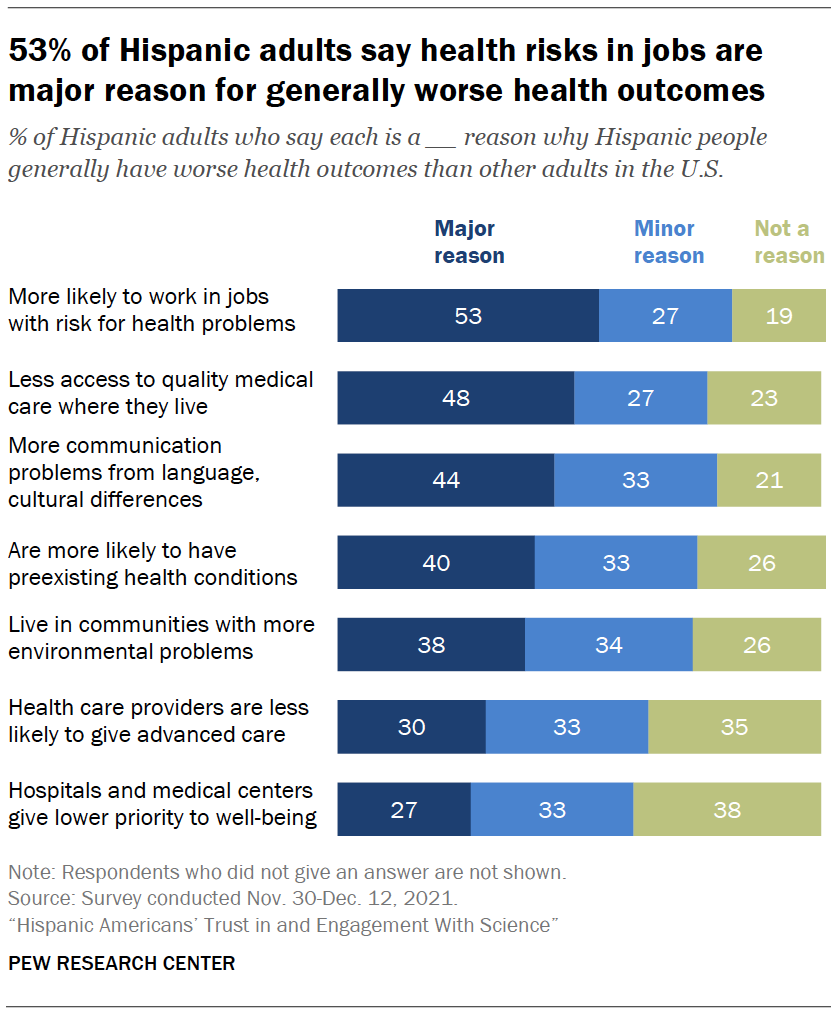
The Center survey asked people for their beliefs about the factors behind health disparities for Hispanic people.
Hispanic Americans cite working in occupations with health risks as the top factor for why Hispanic people generally have worse health outcomes than other U.S. adults. Overall, 53% say that working jobs that put them at risk for health problems is a major reason for health disparities among Hispanic people in the U.S.; another 27% say this is a minor reason and 19% say it is not a reason.
About half (48%) say less access to quality medical care where they live is a major reason for worse health outcomes among Hispanic people in the U.S., and 27% say this is a minor reason.
When it comes to navigating the health care system, 44% say that more communication problems from language or cultural differences is a major reason why Hispanic people have generally worse health outcomes than other adults in the U.S.
Preexisting health conditions are also seen as a factor: 40% say a major reason for worse health outcomes is that Hispanic people are more likely to have preexisting conditions.
Hispanic Americans are relatively less likely to see differential treatment as major factors: 30% say health care providers being less likely to give Hispanic people the most advanced medical care is a major reason for health disparities, while 27% say that hospitals and medical centers giving Hispanics’ well-being lower priority is a major reason. Still, for these two items – as for all items included in the list – majorities say each is at least a minor factor for why Hispanic people in the U.S. generally have worse health outcomes than other adults.
In focus group discussions, some participants shared their feelings that doctors may not always offer the best treatment options to Hispanic people. One participant talked about the assumptions health care providers make this way:
“I think a lot of times when they see us coming in or they see that they’re helping us out, they don’t feel like they have to give us the best medicine or they need to give us the best hope because they already feel like we probably come in with bogus insurance, if we even have insurance … So, they give us stuff that’s not as great or they don’t give us all the best information because they feel like we’re poor.” – Hispanic man, age 25-39
There are some differences in views about these factors between Democrats and Republicans. Hispanic Democrats are more likely to consider several of these options as major reasons for health inequities including the types of jobs Hispanic adults hold and limited access to quality medical care in their local community. Still, majorities of Hispanic Republicans see most of these issues as at least a minor reason for worse health outcomes for Hispanic Americans. See the Appendix for details.
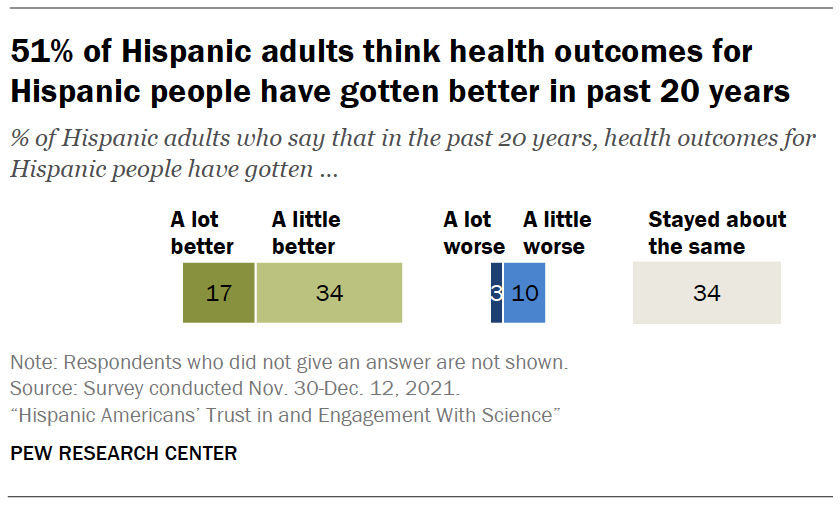
Hispanic Americans have mixed views on how much progress has been made in health outcomes for Hispanic people in the last 20 years. About half (51%) say health outcomes for Hispanic people have gotten a lot (17%) or a little (34%) better. However, 34% say they have stayed about the same, and 13% say they have gotten a lot or a little worse.
About half of recent Hispanic immigrants have a primary care provider
Regular access to health care is seen as essential for preventative care and treatment for conditions such as diabetes, a disease that Hispanic Americans are more likely to die from than other U.S. adults.
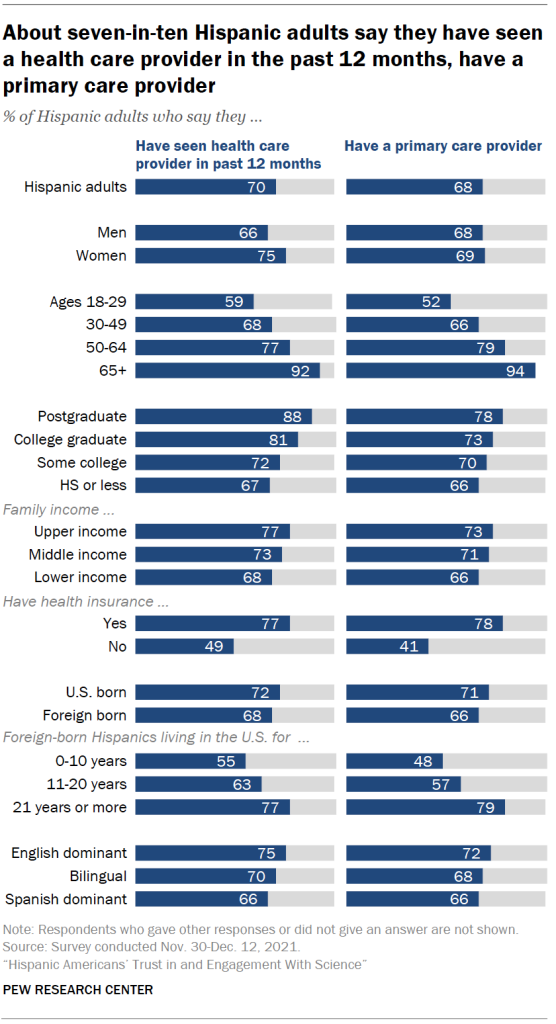
Seven-in-ten Hispanic adults say they have seen a doctor or other health care provider in the past 12 months. About three-in-ten (29%) say they have not done this. Hispanic adults are less likely than all U.S. adults to say they have seen a health care provider within the last year (70% vs. 82%).
Overall, 68% of Latinos say they currently have a person they think of as their primary care provider they usually see when they are sick. A somewhat higher share of all U.S. adults (76%) say they have a primary care provider.
Among Latinos, recent access to health care and having a primary care provider vary greatly by age and health insurance status; and among first-generation Latino immigrants, experiences differ by the number of years spent in the U.S.
A large majority (92%) of Hispanic adults ages 65 and older say they’ve seen a health care provider in the last 12 months. Smaller majorities of younger Hispanic adults – including 59% of those ages 18 to 29 – say they’ve seen a doctor or other health care provider recently.
Hispanics born in the U.S. are slightly more likely than those born in other countries to say they’ve seen a doctor or other health care provider within the last 12 months (72% to 68%).
There are wide differences among Hispanic immigrants: 55% of those who have been living in the U.S. for 10 years or less say they have seen a health care provider in the past year, compared with 63% of those who have been in the U.S. 11 to 20 years and 77% of immigrants who have been in the U.S. more than 20 years.
Hispanic adults with health insurance are 28 percentage points more likely than those without health insurance to say they’ve seen a doctor or other health care provider in the last 12 months (77% vs. 49%). Half of Hispanic adults without health insurance say they have not seen a provider within the last year.
The share of Hispanic Americans who are uninsured has declined over the last decade. According to a KFF analysis of data from the American Community Survey, 20% of Hispanic Americans under age 65 lacked health insurance in 2019. By comparison, in 2010 – before the implementation of the Affordable Care Act – 33% of Hispanic Americans under age 65 did not have health insurance.
Even so, Hispanic Americans remain more likely than other racial and ethnic groups – including White and Black Americans – to be uninsured.
There are similar patterns when it comes to having a primary care provider across these characteristics and experiences. About half (48%) of recent Hispanic immigrants (living in the U.S. 10 years or less) say they have a primary care provider. Those without health insurance (41%) and Hispanic adults under age 30 (52%) are also less likely than other Hispanic Americans to say they have a primary care provider.
Hispanic adults also report communication challenges in health care settings; just under half (46%) say they have a close friend or family member who needs a Spanish-speaking health care provider or translator.
Three-in-ten say they have a close friend or family member who worries about their legal status in the U.S. when thinking about going to see a health care provider. See Appendix for more details on these two questions.
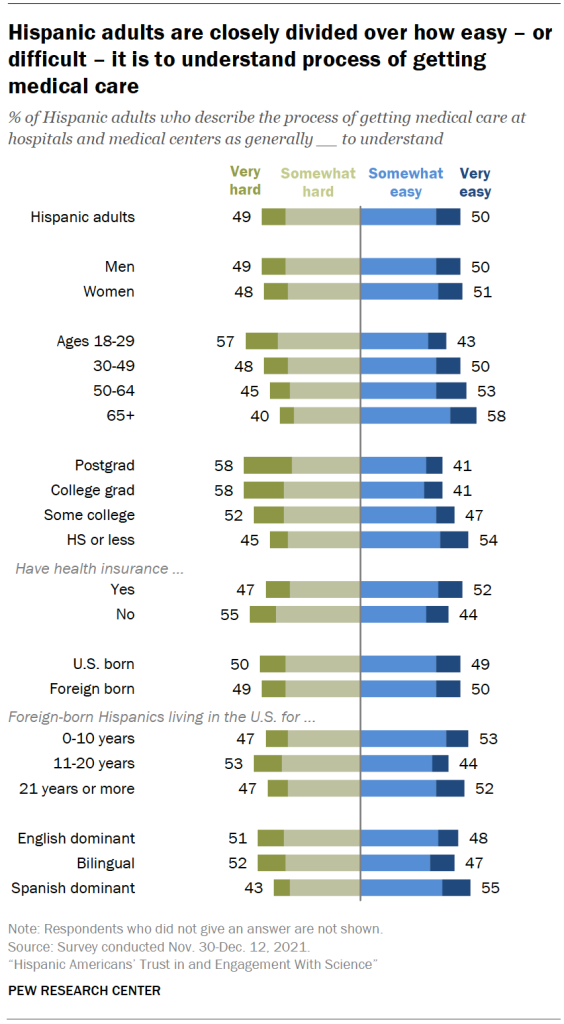
Hispanic Americans are evenly divided over how easy it is to understand the process for getting medical care: 50% say it’s very or somewhat easy to understand the process for getting medical care at hospitals and medical centers, while about as many (49%) say this process is very or somewhat hard to understand.
Views among Hispanic adults are similar to those of all U.S. adults, 51% of whom say it’s easy to understand the process of getting medical care.
Younger Hispanic adults, ages 18 to 29, are more likely than older adults to say it’s hard to understand the process of getting care.
Those who do not have health insurance are more likely to say the process is hard to understand (55%, compared with 47% of those insured).
Hispanic adults, across family income levels, are roughly divided over whether the process of getting medical care is easy or hard to understand.
Those with a high school diploma or less education are more likely than those with higher levels of education to say it’s easy to understand the process for getting medical care.
Latinos born in the U.S. and those born outside of the U.S. hold roughly the same views on this issue. And those who are Spanish-language dominant are no more likely than others to say the process of getting medical care is hard to understand; in fact, they are more inclined to say it is easy.1
When it comes to cost, half of Latinos say their out-of-pocket expenses for their most recent health care visit was about “what is fair,” 31% say they paid more than what is fair and 15% say their out-of-pocket expenses were less than what is fair. See the Appendix for details.
Hispanic Americans offer broadly positive ratings of the quality of health care they received most recently
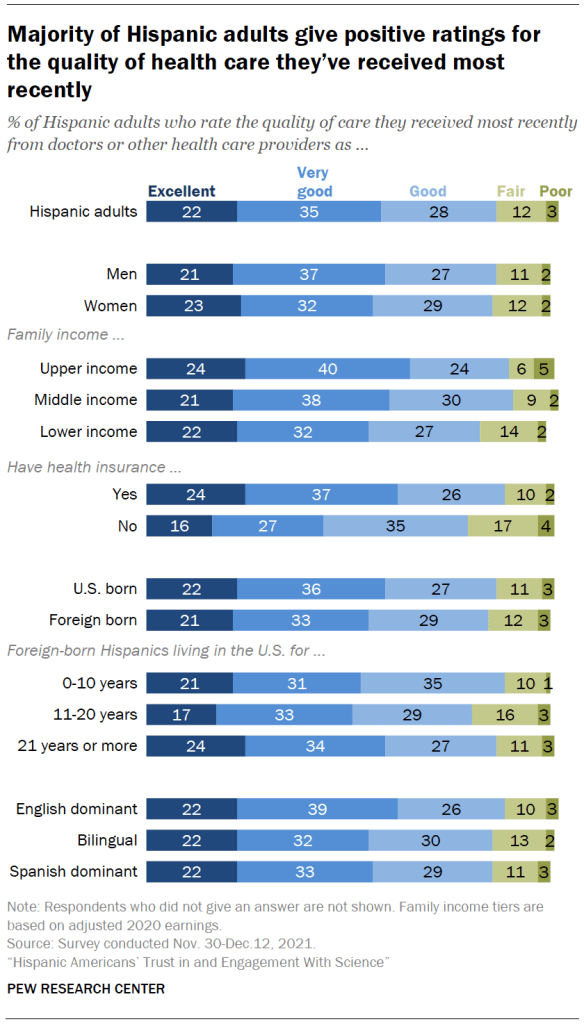
A majority of Hispanic Americans (56%) say the care they have received most recently from doctors or other health care providers has been excellent or very good; another 28% describe it as good. Fewer (14%) say the recent care they received has been fair or poor.
A 61% majority of Hispanic adults with health insurance say their recent care has been excellent or very good, compared with 43% of those without health insurance.
Those with lower family incomes are somewhat less likely than middle- and upper-income families to report recent positive experiences with health care. Still, 54% of lower-income Hispanics say they received excellent or very good care at their last health care visit.
Roughly half of Hispanic Americans say they have had negative health care experiences, difficulties getting the care they needed in the past
While most Hispanic adults offer positive ratings of the care they’ve received recently, negative experiences with the health care system are also fairly commonplace: 52% say they’ve had at least one of several negative experiences with health care providers at some point in their lives.
A third of Hispanic adults say they’ve had to speak up to get the proper care when dealing with doctors or other health care providers, either recently (10%) or at some point in the past (23%).
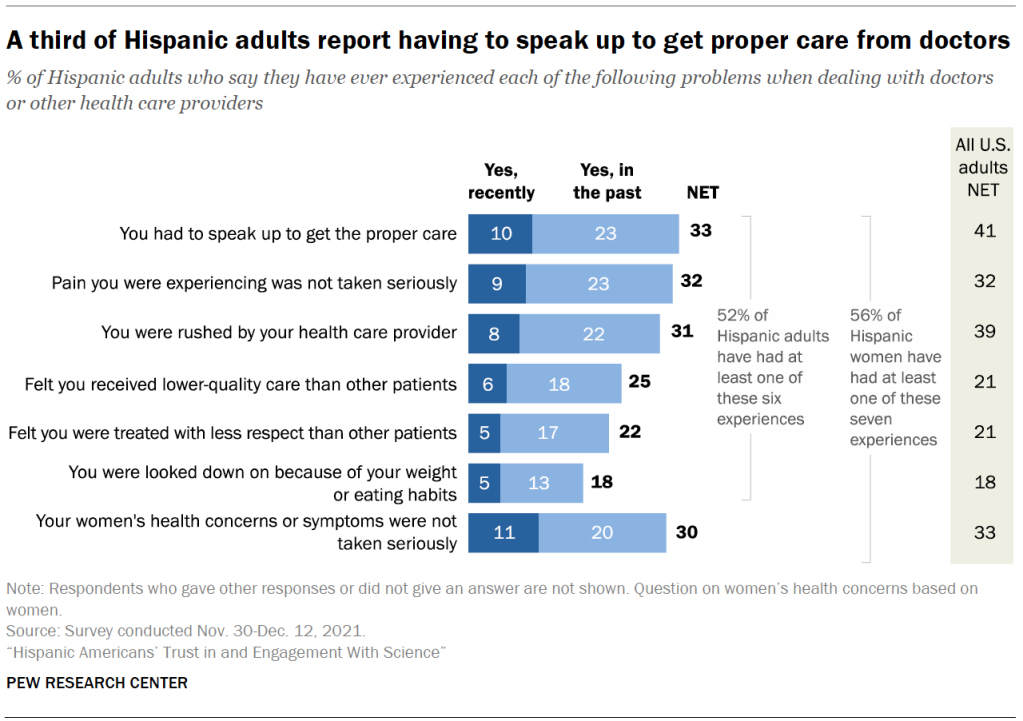
A similar share (32%) say they’ve felt the pain they were experiencing was not being taken seriously in recent or past interactions with health care providers, and 31% say they’ve felt rushed when receiving health care.
A quarter of U.S. Hispanics say they felt they received lower-quality care than other patients either recently or in the past; 74% say this has not happened to them.
When it comes to respect in health care settings, 22% of Hispanic adults say there’s been a time when they felt they were treated with less respect than other patients; 18% say they felt looked down on because of their weight or eating habits.
Among Hispanic women, 30% say their women’s health concerns or symptoms were not taken seriously, either recently or in past interactions with doctors or other health care providers.
Hispanic adults are about as likely as all U.S. adults to report having had these types of negative health care experiences. For example, the same shares of Hispanic adults and all U.S. adults say the pain they were experiencing was not taken seriously by health care providers in either recent or past experiences receiving medical care (32% each). When the six negative experiences asked of both men and women are taken together, Hispanic adults (52%) are slightly less likely than all U.S. adults (58%) to say they’ve had at least one of these negative experiences at some point in the past.
Of the six items asked of both men and women, Latinas are a bit more likely than Latinos to say they had at least one of these negative health care experiences in the past (55% vs. 49%).
Younger Latino adults are more likely than older adults to say they have had at least one of these negative experiences when seeking health care. In particular, younger Latinas are especially likely to report negative health care experiences when compared with both older women and men across age groups. See the Appendix for details.
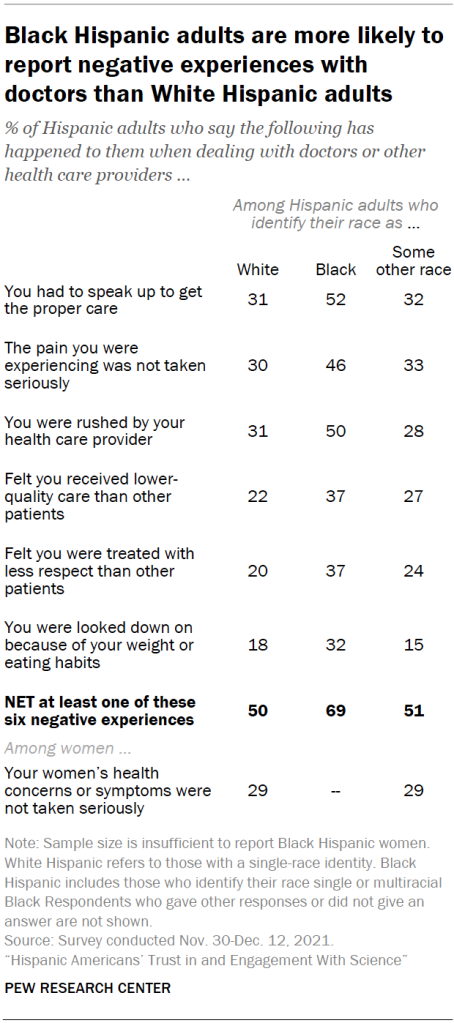
Hispanic Americans who identify their race as Black (3% of all Hispanic adults) are particularly likely to say they have had trouble getting health care in the past. Among this group, about half (52%) say they have had to speak up to get proper care, compared with roughly three-in-ten among Hispanic adults who identify as White (31%) or as some other race (32%). Across the six questions, 69% of Black Hispanic adults say they have experienced at least one of these difficulties getting appropriate care, compared with about half of other Hispanic adults.
Preference for Spanish-speaking or Hispanic health care providers
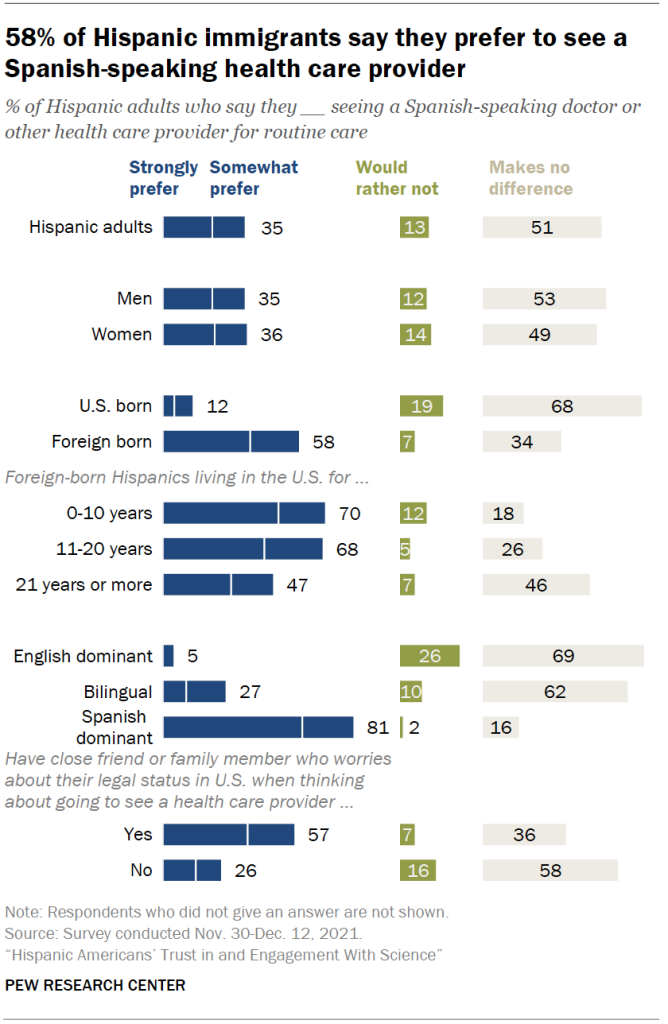
About a third of Hispanic adults say they prefer to see a Spanish-speaking doctor or other health care provider, while 51% say it doesn’t make a difference to them and 13% would rather not see a Spanish-speaking provider.
Just 7% of all physicians and surgeons are Hispanic and just 9% of all health care practitioners and technicians are Hispanic, according to Center analysis of federal government data.
About eight-in-ten (81%) Hispanic adults who are Spanish language dominant prefer to see a Spanish-speaking health care provider, underscoring the potential for communication issues in receiving medical care. Much smaller shares of bilingual (27%) or English dominant (5%) Hispanics prefer a Spanish-speaking provider.
Among Hispanic immigrants – about half of whom mostly speak and read in Spanish – 58% say they prefer a Spanish speaking doctor or other health care provider. Preference for a Spanish-speaking health care provider is more widespread among Hispanic immigrants who have been in the country for less than 21 years than among those who have been in the U.S. longer.
Many focus group participants who primarily speak Spanish talked about their preference for a health care provider who could communicate with them in Spanish. One shared,
“It’s easier to explain the discomfort and understand the indications. Although, if you have an interpreter, it is not the same in my opinion … I feel more comfortable when my doctor speaks Spanish.” – Hispanic woman, age 40-65
In focus group conversations, one participant described the challenges of assessing medical information in this way:
“There’s always doubt when you’re receiving information. Especially if you’re first-generation here coming from a different country. You have your reservations. You always want to go back for a second opinion or ask somebody that you know.” – Hispanic man, age 25-39
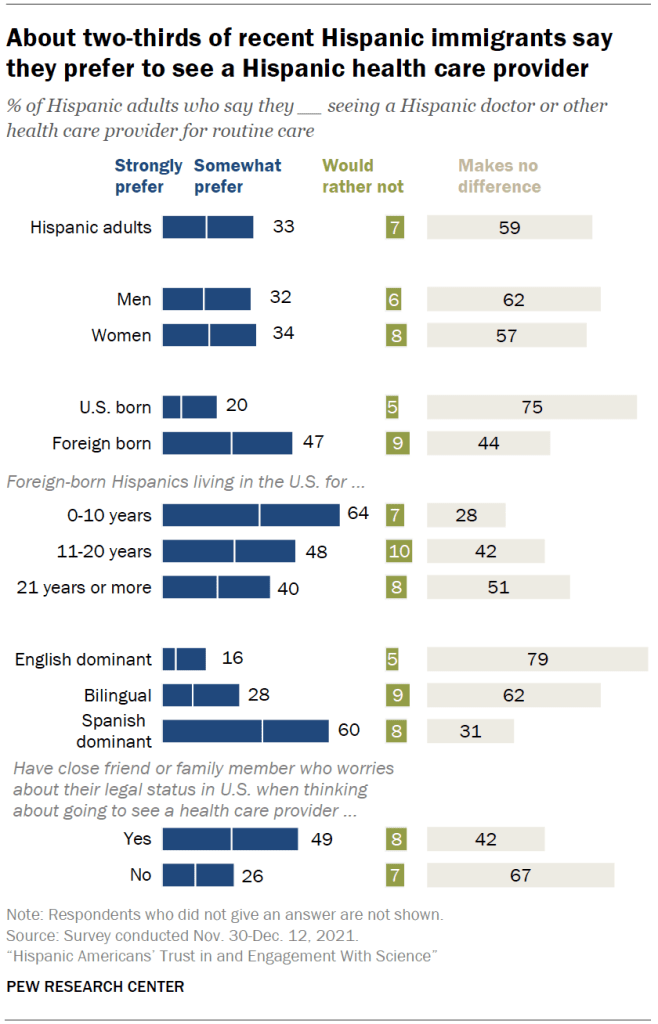
Preferences for seeing a Hispanic health care provider are similar to preferences for a Spanish-speaking provider.
A third of Hispanic adults say they prefer to see a Hispanic health care provider, while 59% say it makes no difference and 7% say they would rather not see a Hispanic provider.
Spanish-dominant Hispanic adults and Hispanic immigrants – especially more recent immigrants – are again among those most likely to say they prefer to see a Hispanic doctor or other health care provider.
One focus group participant explained the reasons he preferred to have a Hispanic health care provider this way:
“And if someone is just like you from the same race, they would probably be more prone to understand and know the illnesses that we deal with because we’re the same. So they might be more able to help you maybe on a more personal kinship level then as somebody who doesn’t understand illnesses or something like Hispanics go through because they’re white or something else.” – Hispanic man, age 25-39
Other participants also felt that a Hispanic health care provider would understand them better than others:
“And I think it is important to me, just the representation of it being a Hispanic doctor … I just feel maybe they’re going to understand me more than me going to another doctor of color.” – Hispanic woman, age 40-65
“It’s important that they know if we have … We’re prone for more diseases based on race and ethnicity, so I want someone to know that for myself and my kids. That, for me, is very important, for sure. If they’re not the same race as I am, then they have to have some sort of understanding cultural-wise or something like that. But I do look for that.” – Hispanic woman, age 25-39
Even so, when asked to consider how Hispanic health care providers compare with others, large majorities of Hispanic Americans say they think a Hispanic doctor or other health care provider is about the same as others at providing them with quality care.
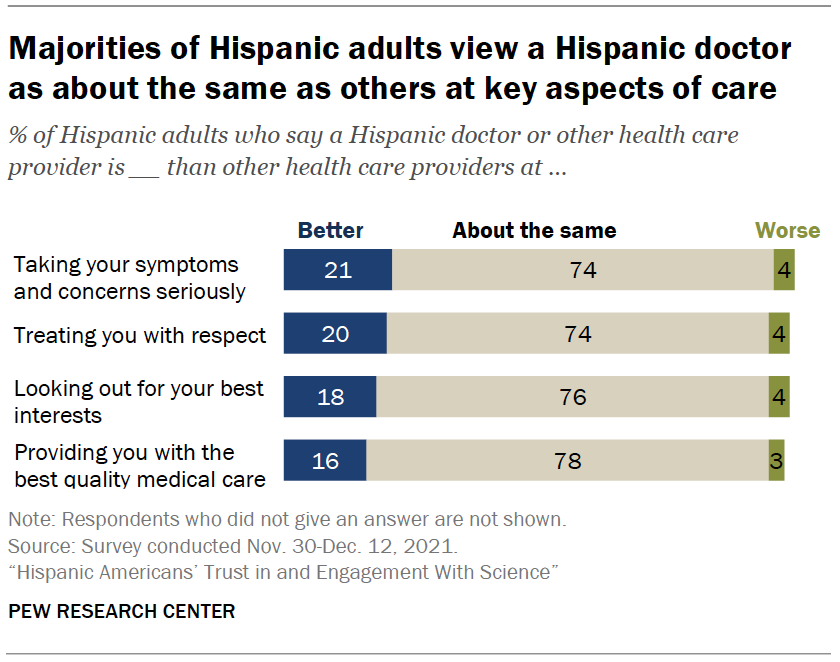
About eight-in-ten (78%) Hispanic Americans view a Hispanic health care provider as about the same as other providers when it comes to getting the best quality medical care. Of those who see a difference, more say a Hispanic health care provider is better (16%) than worse (3%) than others at providing them with quality care.
Views are similar when it comes to other aspects of care, including being treated with respect, concern for their best interests and taking their medical concerns seriously. Large majorities of Hispanic adults say a Hispanic health care provider is about the same as others in these regards. About two-in-ten say a Hispanic health care provider is better than others in each of these three areas.
A 56% majority of Hispanic Americans say they have seen a health care provider of the same ethnicity in the past. There is hardly any difference in the view that a Hispanic health care provider is better than others at providing key elements of care between those who have seen a Hispanic health care provider in the past and those who have not.
In focus group discussions, some participants said that they did not see a difference in quality of care between Hispanic health care providers and other providers:
“I mean, for me, it doesn’t matter, but if maybe you asked the generation before us, then maybe. Like my parents, I want to think that they would like someone that spoke their language that maybe had some kind of a similar background. I could care less what you look like, my mentality in my life is full of every ethnicity, every gender. I’m very open.” – Hispanic woman, age 25-39
“I don’t feel like the provider has to look like me … The reviews, where you really look into it. To me, that’s not important. If it’s Hispanic, fine, if it’s not, it’s fine as well.” – Hispanic woman, age 40-65
Majorities of Hispanic adults across most demographic groups, language and immigration characteristics view a Hispanic health care provider as about the same as others at providing key aspect of medical care.
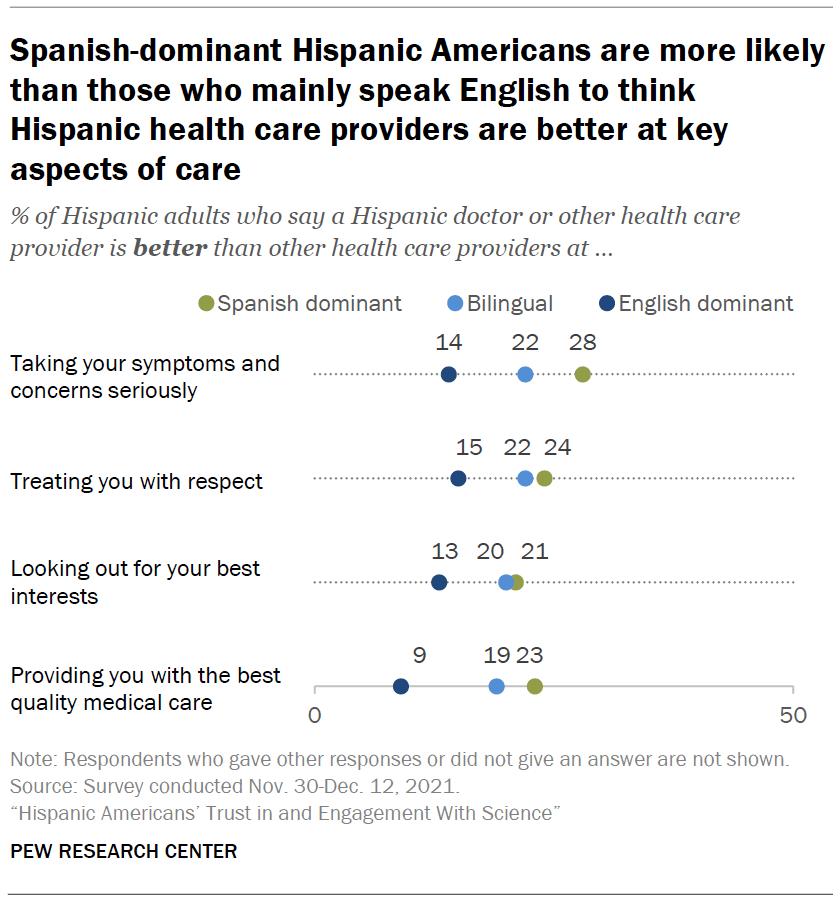
Still, there are some differences in views: Somewhat higher shares of Spanish-dominant than English-dominant Hispanics view a Hispanic health care provider as better than others across key aspects of care.
For instance, 28% of Spanish-dominant Hispanics say a Hispanic health care provider is better than others at taking their symptoms and concerns seriously; English-dominant Hispanics are half as likely to express this view (14%).
Younger Hispanic adults ages 18 to 29 are more likely than older adults to view Hispanic health care providers as better than others at meeting their needs. For instance, 27% of Hispanic adults ages 18 to 29 say a Hispanic health care provider is better than others at treating them with respect. Among older Hispanic adults ages 65 and older, just 11% express this view. Still, the majority across all age groups say that Hispanic health care providers are about the same as others in this regard. See Appendix for details.


