Joe Biden and Donald Trump each have enough delegates in the 2024 presidential primaries to secure their parties’ nominations for president. However, a sizable share of Americans are not particularly fond of either one.
Pew Research Center conducted this analysis to understand the American public’s opinion on presidential candidates Joe Biden and Donald Trump. Most of the data for this analysis comes from a survey of 12,693 respondents from Feb. 13 to 25, 2024.
Most of the respondents (10,642) are members of the American Trends Panel (ATP), an online survey panel recruited through national random sampling of residential addresses. This gives nearly all U.S. adults a chance of selection.
The other 2,051 respondents are members of three other panels: the Ipsos KnowledgePanel, the NORC AmeriSpeak panel and the SSRS opinion panel. All three are national survey panels recruited through random sampling (not “opt-in” polls). We used these additional panels to ensure that the survey would have enough respondents to report on the views of additional subgroups of adults.
For the part of the analysis focusing on the views of Republican primary supporters, we used the responses from a subset of the 4,792 U.S. adults who completed both the February survey and another ATP survey fielded from Nov. 27 to Dec. 3, 2023.
The surveys are weighted to be representative of the U.S. adult population by gender, race, ethnicity, partisan affiliation, education and other categories. Read more about the ATP’s methodology.
Here are the questions used for this analysis and its methodology.
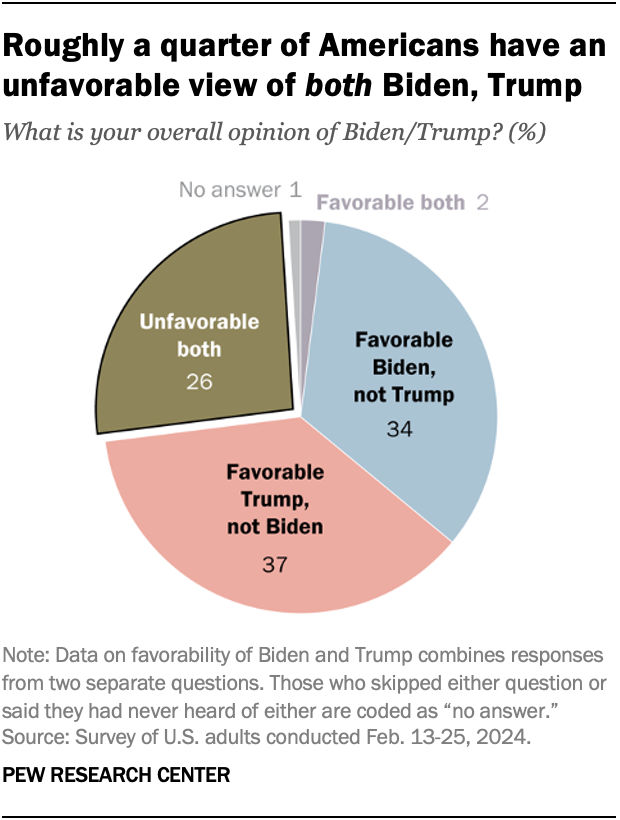
Roughly a quarter of Americans (26%) hold unfavorable views of both Trump and Biden. This “double negative” sentiment is more common among younger adults than older adults. Those who reject partisan labels – identifying as independent or “something else” and instead leaning toward a party – are also more likely to hold this combination of views.
Most Americans view only one of the two men favorably: 37% have a favorable view of Trump and an unfavorable view of Biden, while 34% have a favorable view of Biden and an unfavorable view of Trump. Just 2% of Americans say they have a favorable view of both, according to a Pew Research Center survey of 12,693 adults conducted Feb. 13-25.
‘Double negatives’ are more common among some demographic groups
Age
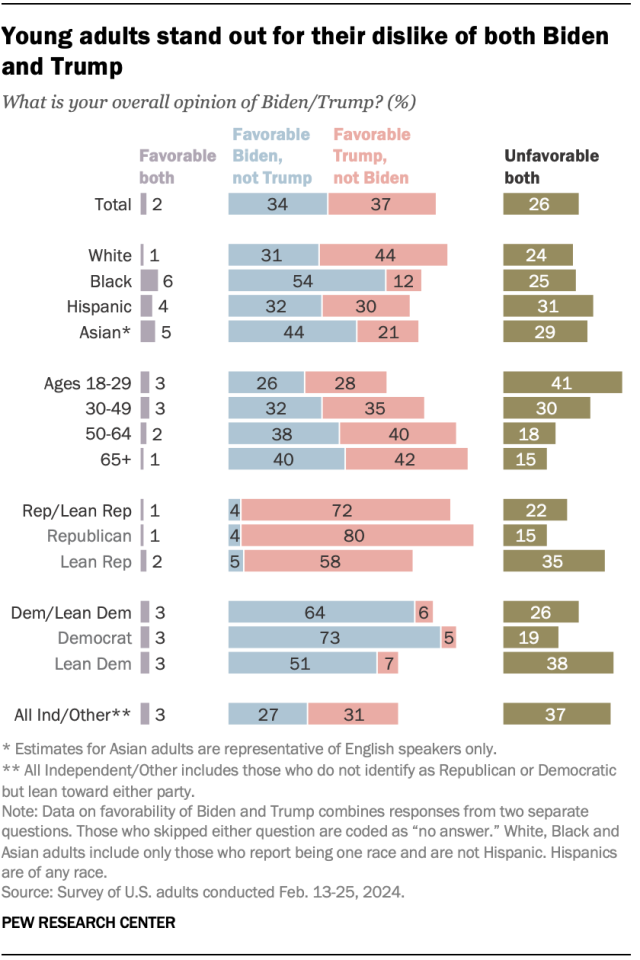
Younger adults are particularly likely to be “double negatives.” About four-in-ten adults ages 18 to 29 (41%) have an unfavorable opinion of both Biden and Trump. In comparison, three-in-ten adults ages 30 to 49 and fewer than two-in-ten of those 50 and older dislike both men.
Partisanship
Among Republicans and Republican-leaning independents, 72% have a favorable view of Trump only, while 4% have a favorable view of Biden only. About two-in-ten (22%) have unfavorable views of both.
But there are differences between those who identify as Republican and those who lean toward the Republican Party.
While Republican leaners are no more likely than Republican identifiers to view Biden favorably, they have less favorable views of Trump.
As a result, about a third of Republican leaners (35%) are double negatives, with an unfavorable view of both Biden and Trump. In comparison, just 15% of Republican identifiers are double negatives.
There is a similar dynamic among Democrats. About two-thirds of Democrats and Democratic-leaning independents say they have a favorable view of Biden and an unfavorable view of Trump. But among Democratic leaners, 38% have negative views of both Trump and Biden. That drops to 19% among those who identify as Democrats.
How many Haley, DeSantis supporters are ‘double negatives’?
Republican and Republican-leaning registered voters who supported a GOP candidate other than Trump for the 2024 presidential nomination are less favorable to the former president than those who backed him.

Nikki Haley’s primary supporters are especially likely to say they dislike both Trump and Biden. Among Republican and Republican-leaning registered voters who said in a December survey that they supported Haley for the Republican nomination, roughly half (53%) currently have unfavorable opinions of both Biden and Trump.
About four-in-ten (38%) of Haley’s supporters say they have a favorable view of Trump and not of Biden, while 9% say they have an unfavorable view of Trump but a favorable view of Biden.
Among Ron DeSantis’ December supporters, about three-in-ten are double negatives. Seven-in-ten have a favorable view of Trump and an unfavorable view of Biden.
An overwhelming majority of Trump’s primary supporters (96%) say they have a favorable view of Trump and an unfavorable view of Biden.
Biden and Trump favorability ratings
Overall, 62% of Americans have an unfavorable view of Biden – nearly identical to the 60% of Americans who view Trump negatively. (Read more about how Americans view Biden and Trump.)
Biden
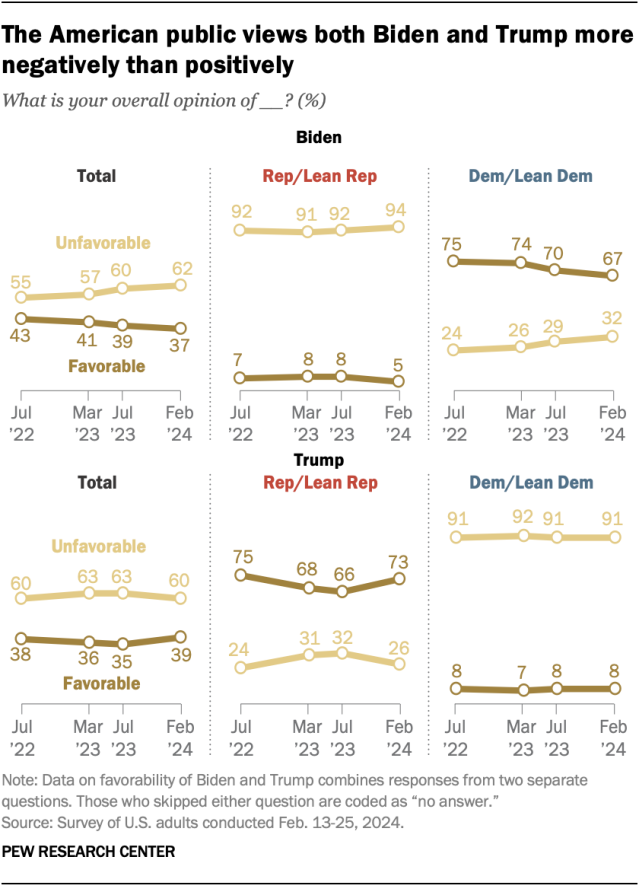
While Biden’s favorability ratings are little changed over the last year, they are more negative than they were in 2022. This shift has largely been within his own party: In July 2022, 75% of Democrats and Democratic leaners rated him positively. Today, 67% do.
Republicans’ negative views of Biden have held steady over that time. Today, 94% say they have an unfavorable view of him.
Trump
Trump’s ratings are largely the same as they were in 2022. However, they are somewhat less negative than in 2023, as Republicans’ views have grown more positive.
Today, 73% of Republicans and Republican leaners hold a favorable view of the former president, up from 66% in July 2023.
Democrats continue to overwhelmingly view Trump negatively: 91% say they have an unfavorable view of him.
Views of Trump and Biden among racial and ethnic groups
There have been only modest changes in views of Biden and Trump over the past two years among Black, Asian and White adults.
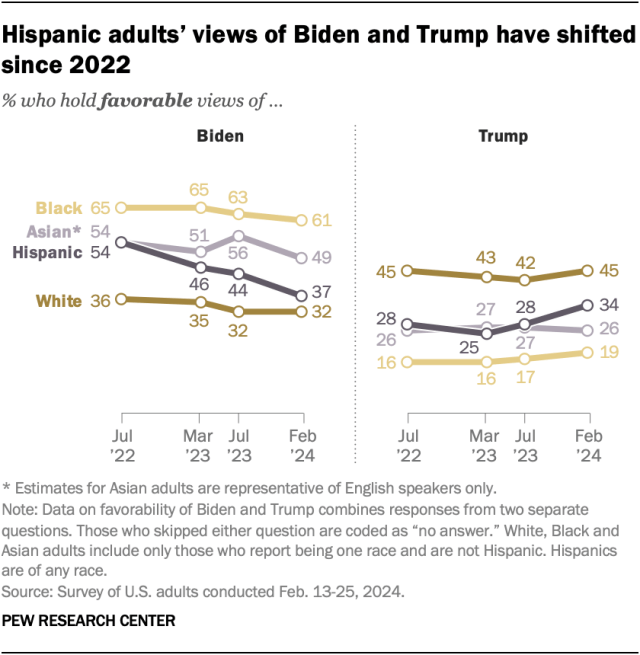
Among Hispanic adults, however, there are bigger changes. Hispanics are less likely to hold favorable views of Biden now than they were two years ago, and they are slightly more positive about Trump.
In July 2022, 54% of Hispanic adults held a favorable view of Biden. Today, that share has dropped to 37%.
At the same time, Trump’s favorability among Hispanic adults has ticked up, from 28% in July 2022 to 34% now.
Favorability by age
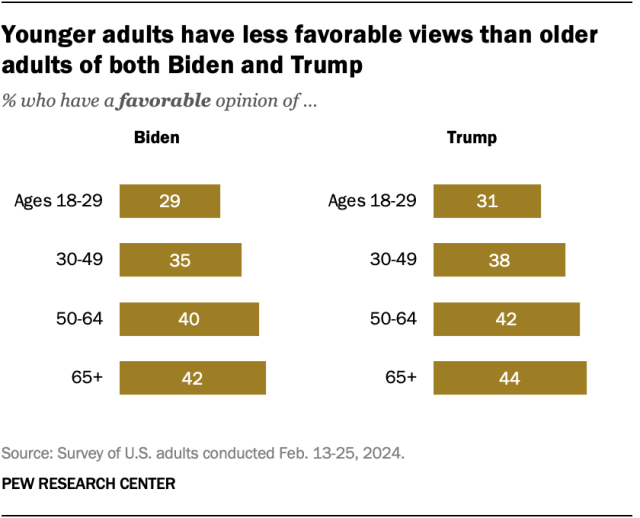
As has generally been the case for the past several years, younger Americans are less likely than older Americans to have favorable views of Biden or Trump.
Today, about three-in-ten adults under 30 say they have a favorable view of Biden (29%), while a nearly identical share (31%) have a favorable view of Trump.
Note: Here are the questions used for this analysis and its methodology.
