Issues of economic inequality have pushed their way back into the national and global conversation – from Pope Francis and Sen. Bernie Sanders to Thomas Piketty and ongoing debates about raising the minimum wage. Surveys, though, show a wide partisan gap in views of whether inequality is a problem that should be addressed. For instance, an NBC News/Wall Street Journal poll in January found that, while 67% of Democrats identified reducing income inequality as an “absolute priority,” just 19% of Republicans did.
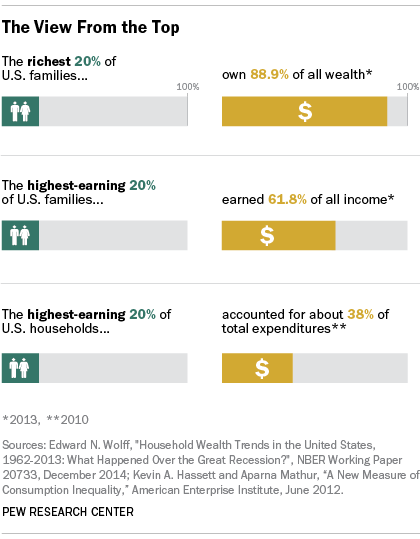
And economists are also divided on just how to define and measure inequality. As Federal Reserve economist Arthur Kennickell wrote in a 2009 paper, “‘Inequality’ may seem a simple term, but operationally it may mean many different things, depending on the point of view.” Most researchers agree that wealth is more unevenly distributed than income, while consumption is less concentrated at the upper end than either wealth or income.
The most-cited measures of inequality involve income. In a recent report, for instance, the Organization for Economic Cooperation and Development noted that “in OECD countries, the richest 10% of the population earn 9.6 times the income of the poorest 10%.”
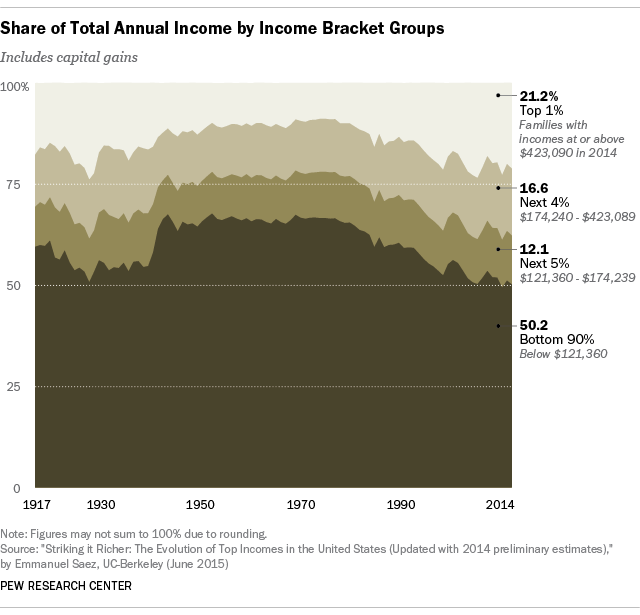
The U.S. Census Bureau publishes two measures of income inequality each year. According to the most recent report, the top 5% of households received 21.8% of “equivalence-adjusted” aggregate income in 2014, while the bottom 60% received just 27.1%. (Equivalence-adjusted estimates factor in different household sizes and compositions.)
The Census Bureau also reports the Gini index, a summary statistic that measures the dispersion of incomes on a scale of zero (everyone has exactly the same income) to one (one person has all the income). The income Gini for the U.S. has been rising for decades: On an equivalence-adjusted basis, the Gini was 0.362 in 1967 and 0.464 last year. (Other researchers, such as University of California, Berkeley’s Emmanuel Saez, have tracked income inequality over long periods using somewhat different measures and reached similar conclusions.)
But some economists say income data have too many flaws to be the primary measure of inequality. For one thing, many income-inequality measures use income before accounting for the impact of taxes and transfer payments (such as Social Security, food stamps and unemployment benefits), which act to reduce inequality. According to the OECD, taxes and transfers cut the United States’ 2013 income Gini from 0.509 to 0.401 (although that latter figure still is among the highest in the OECD and has risen over time – it was 0.307 in 1980).
In addition, critics of the income-based approach note that an individual’s (or household’s) income can vary considerably over time, and may not reflect all available economic resources – such as credit availability, government assistance or accumulated family wealth. They argue that consumption is a better measure of economic well-being.
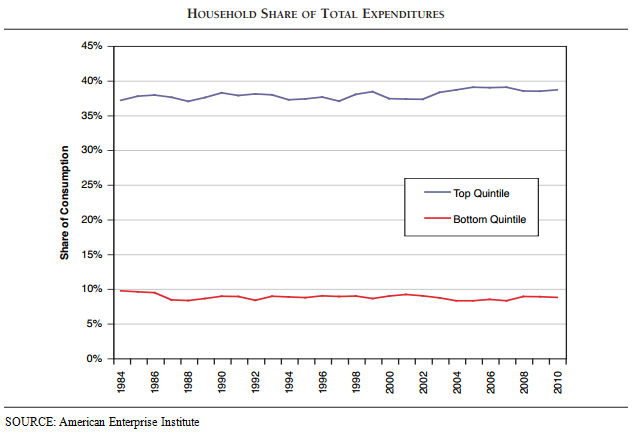
Such studies typically find that consumption inequality is less than income inequality, though still significant. A 2012 study from the American Enterprise Institute, using data from the Consumer Expenditure Survey (CES), found that the top 20% of households by income accounted for nearly 40% of total expenditures, while the bottom 20% accounted for less than 10% of expenditures. As the chart shows, the gap between the top and bottom has remained relatively constant – a finding that echoes those of other consumption-oriented researchers.
But other economists have looked at consumption data and reached different conclusions. One recent study, prepared by two Census Bureau researchers and University of Wisconsin economist Timothy Smeeding and presented at the 2013 annual meeting of the American Economic Association, found that consumption inequality grew about two-thirds as much as income inequality between 1985 and 2010.
[had]
A third way to look at economic inequality involves household wealth. People with great accumulated wealth may not receive much in the way of income (trust income and capital gains on stocks and other investments, for example, often are excluded from income analyses), while people who earn a lot but also have high expenses (such as child care or tuition) may not consider themselves especially wealthy.
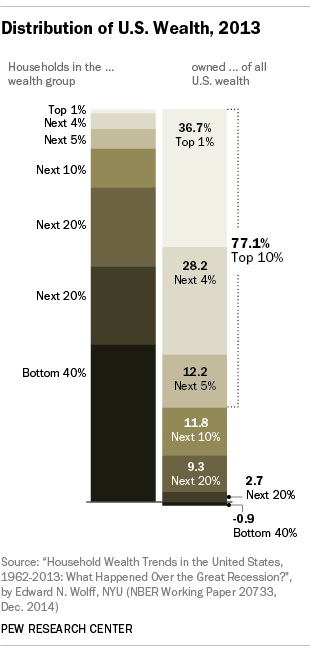
Wealth inequality tends to be much higher than either income or consumption inequality, but it also tends to not vary as much over time. New York University economist Edward Wolff, for instance, has used data from the Survey of Consumer Finances and similar prior surveys to track household net worth over time.
Wolff found that in 1962, the top 1% of households held 33.4% of all wealth; in 2013 their share was 36.7%. The biggest increase came in the next-wealthiest tier, representing 4% of households: Their share of wealth rose from 21.2% in 1962 to 28.2% in 2013. As for the bottom 40%? Their share fluctuated between 1.5% and -0.9% (i.e., negative net worth) for the entire five-decade period Wolff studied.
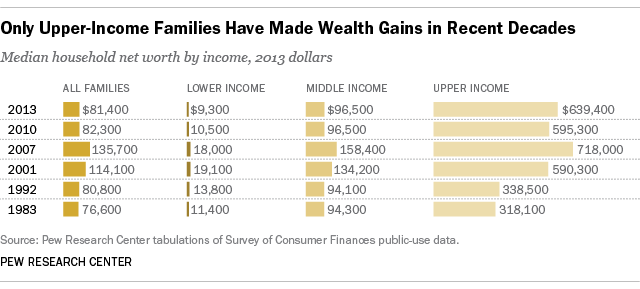
A Pew Research Center analysis last year found that the wealth gap between upper-income people and the rest of America was the widest on record: In 2013, the median net worth of the nation’s upper-income families was 6.6 times that of middle-income families, and nearly 70 times that of lower-income families. The analysis also found that since 1983, virtually all of the wealth gains made by U.S. families have gone to the upper-income group.
Note: This post has been updated since its original publication on Dec. 18, 2013.
