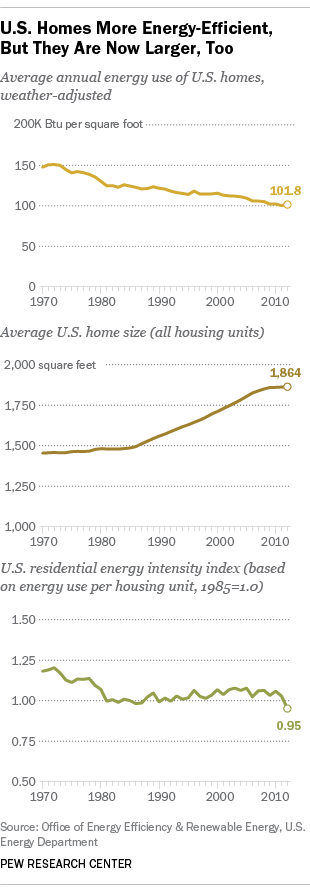
U.S. homes have become considerably more energy-efficient over the past four decades, according to government data. But homes also are a lot bigger than they used to be, and their growing girth wipes out nearly all the efficiency gains.
According to preliminary figures from the Department of Energy’s Office of Energy Efficiency and Renewable Energy, the average U.S. home used 101,800 British thermal units (Btu) of energy per square foot in 2012, the most recent year with available data. That’s 31% less than in 1970, after adjusting for weather effects and efficiency improvements in electricity generation.
And while the total number of housing units rose by 80% over the past four decades, collectively they used just 45% more Btu than in 1970. (The government uses Btu – the amount of heat needed to raise a pound of water 1 degree Fahrenheit – as a single common measure for electricity, heating fuel and other forms of household energy.)
All of this is good news for energy conservation. After all, a new Pew Research Center survey found that two-thirds of Americans say people will have to make major changes in the way they live to reduce the effects of global climate change. And many such changes can be made right at home.
But like Americans’ waistlines, U.S. homes have been expanding steadily over the years: The average home in 2012 was estimated at 1,864 square feet, 28% bigger than in 1970.
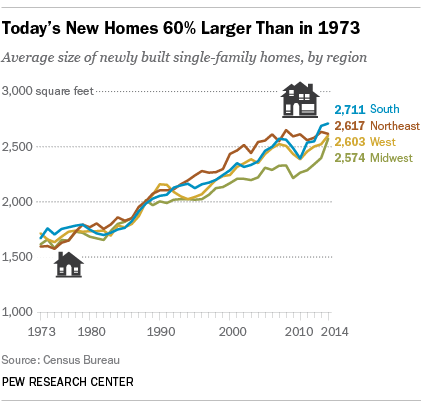
While some homeowners do add onto their existing structures, the trend is driven largely by new construction. According to the Census Bureau, the average new single-family house completed last year was 2,657 square feet – 57% larger than four decades earlier. While the biggest new homes are being built in the South (an average of 2,711 square feet last year), home sizes have grown the most in the Northeast: a 64% increase in average new-home size over the past four decades.

What all of this means is that, after dropping sharply during the 1970s, the overall energy intensity of U.S. homes has changed little over the past three decades. Energy intensity is a metric that compares the amount of energy used against some unit of economic activity – households, in the case of the residential sector.
The average home used 183 million Btu in 1981 and 188.7 million in 2011; energy intensity did fall in 2012, to a preliminary read of 174.7 million Btu, but that was mainly due to weather. (Other factors, including geographic population shifts and changes in housing type, have had relatively little impact on overall energy intensity.) Think of someone scarfing down a chili cheeseburger and fries after an hour on the elliptical, and then wondering why he never seems to lose weight.
What has changed, though, is how households use energy. According to the Energy Department’s quadrennial Residential Energy Consumption Survey, in 1993 more than half (53.1%) of total household energy consumption went to heating living spaces, versus 41.5% in 2009 (those are the earliest and latest years, respectively, for which comparable data are available). Conversely, the share of energy consumption that goes to appliances, electronics and lighting rose from 24% to 34.6% over that same period. (The energy shares for water heating and air conditioning didn’t change much.)
