More older Americans – those ages 65 and older – are working than at any time since the turn of the century, and today’s older workers are spending more time on the job than did their peers in previous years, according to a new Pew Research Center analysis of employment data from the federal Bureau of Labor Statistics.
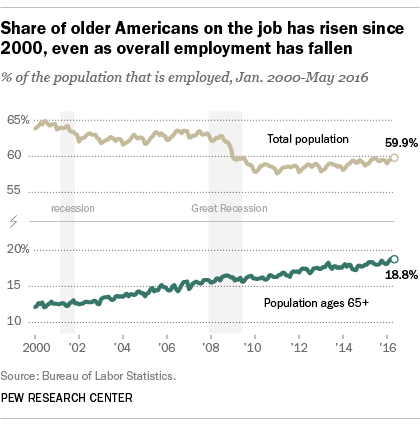
In May, 18.8% of Americans ages 65 and older, or nearly 9 million people, reported being employed full- or part-time, continuing a steady increase that dates to at least 2000 (which is as far back as we took our analysis). In May of that year, just 12.8% of 65-and-older Americans, or about 4 million people, said they were working.
We used the employment-population ratio – the employed percentage of a given group’s total population (including those not actively looking for work) – to measure employment among different age groups. The steady increase in the share of working older Americans contrasts with the adult population as a whole, whose employment-population ratio fell sharply during the Great Recession and has yet to recover to pre-slump levels. In May 2000, according to the BLS’ seasonally unadjusted data, 64.4% of all adults had jobs, a figure that had drifted down to 62.5% by May 2008 as the recession took hold. The ratio bottomed out at 57.6% in January 2011, and as of last month stood at 59.9%.

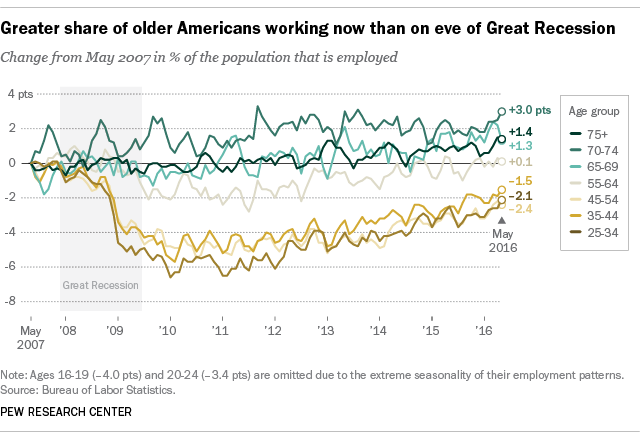
The relatively strong presence of 65-and-older workers is found across age brackets: 65- to 69-year-olds, 70- to 74-year-olds, and those 75 and older. All are working at higher rates than they did in May 2008, the only age groups about which that can be said.
Though we took the current analysis only back to 2000, an earlier Center report noted that the labor force participation rate (that is, workers and those actively seeking employment as a share of a group’s total population) among older adults began rising in the mid-1980s, after declining for more than three decades.
Not only are more older Americans working, more of them are working full-time. In May 2000, 46.1% of workers ages 65 and older were working fewer than 35 hours a week (the BLS’ cutoff for full-time status). The part-time share has fallen steadily, so that by last month only 36.1% of 65-and-older workers were part-time.
The share of both older men and older women who are working has grown over time, but working during what are commonly thought of as retirement years remains a largely male phenomenon: Although less than 45% of the total 65-and-older population are men, they represent more than 55% of older workers. Older Asians (20.2%) and whites (19%) are somewhat more likely to be working than older blacks (16.7%).

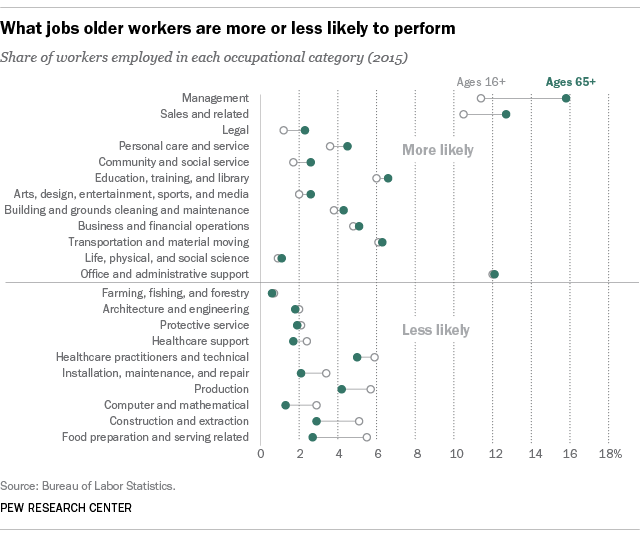
Older Americans work in the various sectors of the U.S. economy in broadly similar patterns as the workforce as a whole, with a few notable exceptions. For instance, they’re less likely to work in the accommodations/food service sector (only 3.4% did so last year, versus 7.1% of all workers). And older workers are more likely to be in management, legal and community/social service occupations than the overall workforce, and less likely to be in computer and mathematical, food preparation, and construction-related occupations.
