Note: Updated statewide Hispanic voter registration totals that reflect final book-closing numbers have been published here.
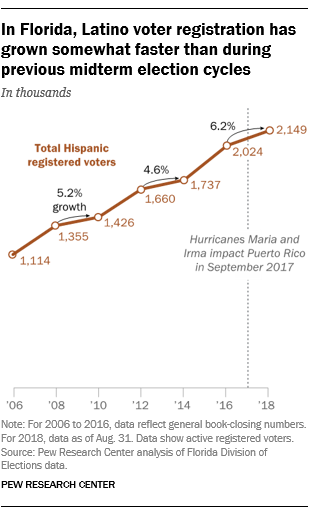
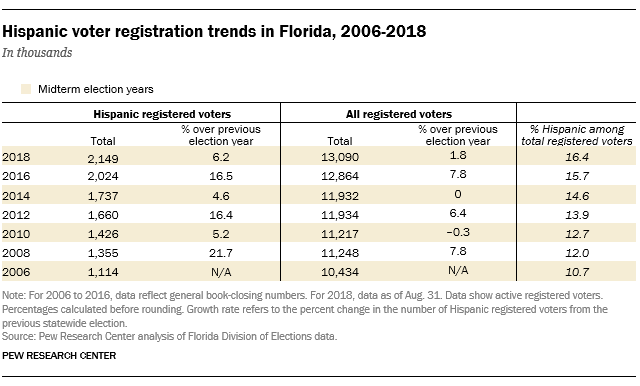
The number of Hispanic registered voters in Florida has increased 6.2% since the 2016 presidential election, to a record 2.1 million people. This is slightly faster growth than during the 2014 and 2010 midterm cycles, which saw 4.6% and 5.2% increases over the prior presidential election year, respectively, according to a Pew Research Center analysis of Florida state government data.
Hispanics now make up a record 16.4% of Florida’s registered voters, up from 15.7% in 2016. The number of Hispanic registered voters has grown more than three times as fast as the overall number of registered voters in the past two years (6.2% growth vs. 1.8% growth, as of Aug. 31). Floridians had until Oct. 9 to register to vote, so the number of registered voters for this midterm cycle is likely to have increased further since August. (While the growth in Hispanic voters this year exceeds that of the past two midterm election years, it still trails the growth in recent presidential election years.)
Puerto Ricans have been the state’s fastest-growing Hispanic-origin group over the past decade, and thousands more arrived from the island following Hurricanes Maria and Irma in 2017 – part of a broader movement of island residents to the U.S. mainland in recent years. Between 2005 and 2016, about a third of these migrants settled in Florida, in an area between the Orlando and Tampa Bay metro areas known as the Interstate 4 corridor. The state’s Puerto Rican population now rivals that of New York, the main destination of the mid-20th century’s migration from the island.
However, it is unclear to what extent recent migration from Puerto Rico accounts for the uptick in Hispanic registered voters this election cycle. The state’s data on Hispanic registered voters don’t include the origins of these voters (Puerto Rican, Cuban, Dominican, etc.) – and data on eligible voters, as well as registered voters at the county level, tell a mixed story.
Puerto Ricans now represent nearly a third of Hispanic eligible voters in Florida
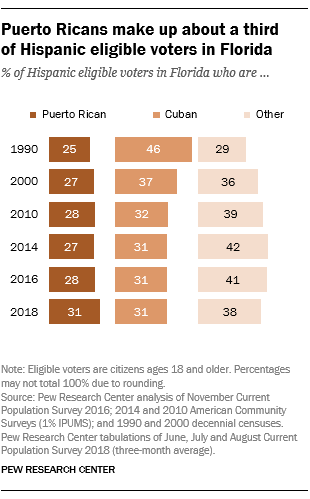
Puerto Ricans account for a rapidly increasing share of Florida’s Hispanic eligible voters – U.S. citizens who are 18 years or older, regardless of whether they have registered to vote. Puerto Ricans now make up about a third (31%) of these adults, a similar share to that of Cubans (31%), according to a separate Pew Research Center analysis of U.S. Census Bureau data.
The number of island-born Puerto Ricans eligible to vote in Florida has increased 30%, or about 126,000 people, since 2016. The number born in the U.S. mainland grew only 3%, or about 10,000 people. (Puerto Rican residents are U.S. citizens by birth and can register to vote once they move to the U.S. mainland.) Meanwhile, the number of Cuban eligible voters increased 4%.
Overall, the number of Hispanics eligible to vote in Florida has reached a high of nearly 3 million this year, up from 2.9 million from 2016.
Island-born Puerto Ricans make up nearly a fifth (18%) of Hispanic eligible voters in Florida, up from 15% in 2014 and 2016. They also account for the majority (59%) of all Puerto Rican eligible voters, up from 53% in 2016.
Not all U.S. adults eligible to vote take the step to register as voters. In 2016, about 57% of Hispanic eligible voters nationwide reported having registered to vote, compared with 70% of all U.S. eligible voters.
Voter registration growth varies in counties with large Puerto Rican populations
While Hispanic voter registration is up statewide in Florida, there has been uneven growth at the county level, including in the counties that have large Puerto Rican populations (i.e., with at least 10,000 Puerto Ricans).
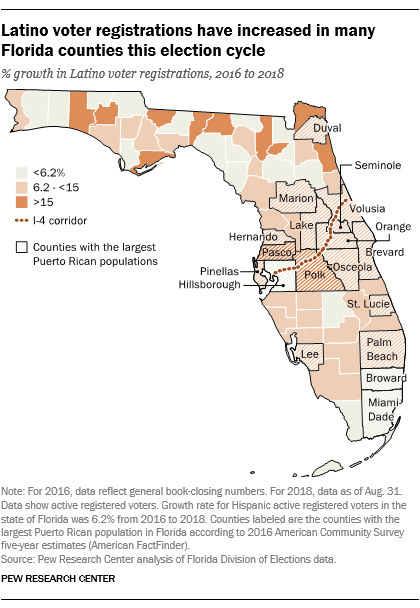
Hispanic voter registration has grown faster than the statewide average of 6.2% in 14 of 18 Florida counties with the largest Puerto Rican populations. Most are in central Florida, with many of them along the I-4 corridor: Polk (16.8% growth since 2016), Pasco (15.9%), Osceola (14.9%), Lake (14.1%), Volusia (13.8%), Hernando (12.4), Pinellas (9.3%) and Seminole (8.8%) counties. These 14 counties accounted for nearly half (45%) of Florida’s Puerto Rican population in 2016.
These 14 counties also accounted for more than half (51.9%) of the growth in the state’s Hispanic registered voters since 2016. Overall, more than a quarter of Florida’s Hispanic registered voters (27.5%) live in these counties.
At the same time, the four counties with the largest Puerto Rican populations in Florida had relatively slower Hispanic voter registration growth during the current midterm cycle: Orange (6.2%), Broward (3.6%), Hillsborough (3.6%) and Miami-Dade (2.8%). Together, these four counties hold 64.9% of all Hispanic registered voters.
Only five counties with large Puerto Rican populations have seen faster Hispanic voter registration growth this year than in 2014: Seminole (9% vs. 0% in 2014), Marion (14% vs. 5%), Volusia (14% vs. 6%), Pasco (16% vs. 8%) and Osceola (15% vs. 7%). However, these fast-growing counties account for just 21% of the statewide Puerto Rican population and only 11% of all Hispanic registered voters.
Florida Hispanics more likely to be registered as Democrats or no party than as Republicans
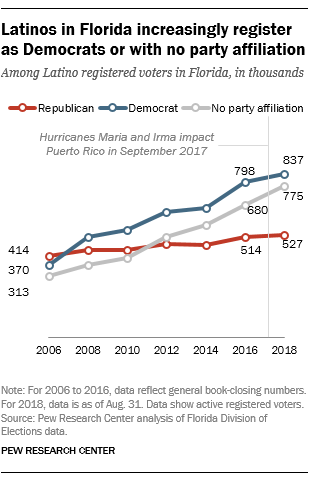
Democrats and those without party affiliation far outnumber Republicans among Hispanic registered voters in Florida so far this year. There are about 837,000 registered Democrats and 775,000 unaffiliated voters, compared with 527,000 Republicans (again as of Aug. 31).
Since the 2016 election, the number of Hispanics registered as Democrats has increased by 5%, approximately twice the 2% growth rate for Hispanics registered as Republicans. The number of Hispanic registered voters with no party affiliation has grown the fastest (14%).
In the midterm election of 2006, the party affiliations of Hispanic registered voters in Florida looked drastically different. At the time, more Hispanics were registered as Republicans (414,000) than as Democrats (370,000) or with no party (313,000).
