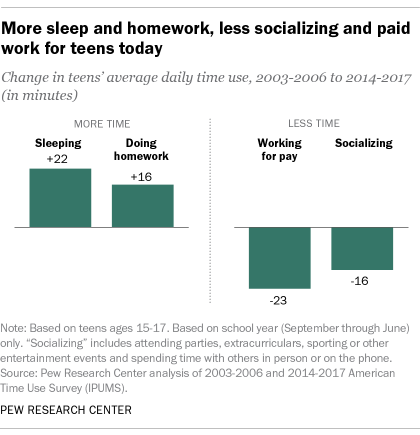
Teens today are spending their time differently than they did a decade ago. They’re devoting more time to sleep and homework, and less time to paid work and socializing. But what has not changed are the differences between teen boys and girls in time spent on leisure, grooming, homework, housework and errands, according to a new Pew Research Center analysis of Bureau of Labor Statistics data.

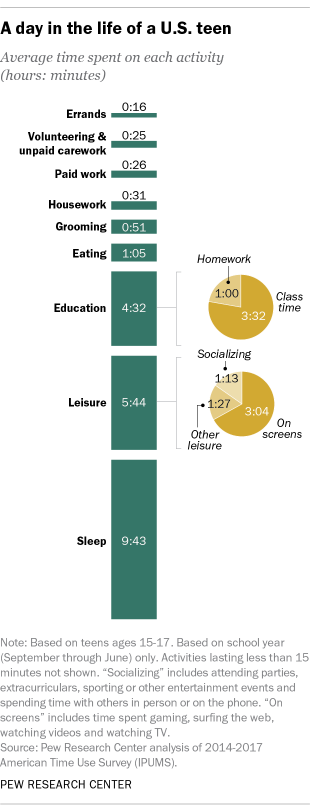
Overall, teens (ages 15 to 17) spend an hour a day, on average, doing homework during the school year, up from 44 minutes a day about a decade ago and 30 minutes in the mid-1990s.
Teens are also getting more shut-eye than they did in the past. They are clocking an average of over nine and a half hours of sleep a night, an increase of 22 minutes compared with teens a decade ago and almost an hour more than those in the mid-1990s. Sleep patterns fluctuate quite a bit – on weekends, teens average about 11 hours, while on weekdays they typically get just over nine hours a night. (While these findings are derived from time diaries in which respondents record the amount of time they slept on the prior night, results from other types of surveys suggest teens are getting fewer hours of sleep.)
Teens now enjoy more than five and a half hours of leisure a day (5 hours, 44 minutes). The biggest chunk of teens’ daily leisure time is spent on screens: 3 hours and 4 minutes on average. This figure, which can include time spent gaming, surfing the web, watching videos and watching TV, has held steady over the past decade. On weekends, screen time increases to almost four hours a day (3 hours, 53 minutes), and on weekdays teens are spending 2 hours and 44 minutes on screens.

Time spent playing sports has held steady at around 45 minutes, as has the time teens spend in other types of leisure such as shopping for clothes, listening to music and reading for pleasure.
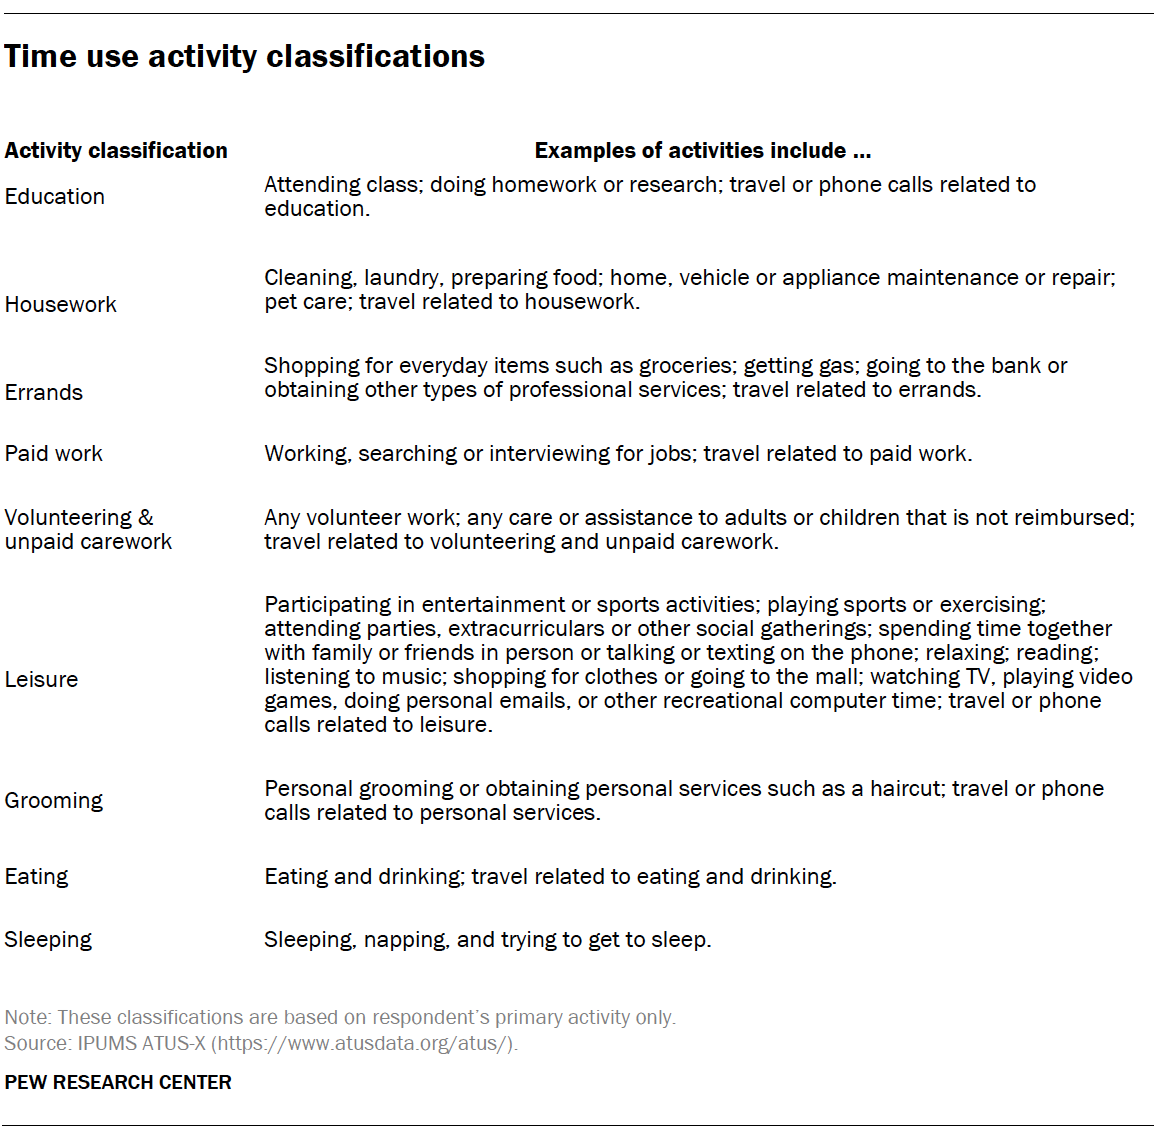
Time spent by teens in other leisure activities has declined. Over the past decade, the time spent socializing – including attending parties, extracurriculars, sporting or other entertainment events as well as spending time with others in person or on the phone – has dropped by 16 minutes, to 1 hour and 13 minutes a day.
Teens also are spending less time on paid work during the school year than their predecessors: 26 minutes a day, on average, compared with 49 minutes about a decade ago and 57 minutes in the mid-1990s. Much of this decline reflects the fact that teens are less likely to work today than in the past; among employed teens, the amount of time spent working is not much different now than it was around 2005.
While the way teens overall spend their time has changed in a number of ways, persistent gender differences in time use remain. Teen boys are spending an average of about six hours a day in leisure time, compared with roughly five hours a day for girls – driven largely by the fact that boys are spending about an hour (58 minutes) more a day than girls engaged in screen time. Boys also spend more time playing sports: 59 minutes vs. 33 minutes for girls.

On the flip side, girls spend 10 more minutes a day, on average, shopping for items such as clothes or going to the mall (15 minutes vs. 5 minutes).
Teen girls also spend more time than boys on grooming activities, such as bathing, getting dressed, getting haircuts, and other activities related to their hygiene and appearance. Girls spend an average of about an hour a day on these types of tasks (1 hour, 3 minutes); boys spend 40 minutes on them.
Girls also devote 21 more minutes a day to homework than boys do – 71 minutes vs. 50 minutes, on average, during the school year. This pattern has held steady over the past decade, as the amount of time spent on homework has risen equally for boys and girls.

When it comes to the amount of time spent on housework, the differences between boys and girls reflect gender dynamics that are also evident among adults. Teenage girls spend 38 minutes a day, on average, helping around the house during the school year, compared with 24 minutes a day for boys. The bulk of this gap is driven by the fact that girls spend more than twice as much time cleaning up and preparing food as boys do (29 minutes vs. 12 minutes). There are not significant differences in the amount of time boys and girls spend on home maintenance and lawn care.
Girls also spend more time running errands, such as shopping for groceries (21 minutes vs. 11 minutes for boys).
In addition to these differences in how they spend their time, the way boys and girls feel about their day also differs in some key ways. A new survey by Pew Research Center of teens ages 13 to 17 finds that 36% of girls say they feel tense or nervous about their day every or almost every day; 23% of boys say the same. At the same time, girls are more likely than boys to say they get excited daily or almost daily by something they study in school (33% vs. 21%). And while similar shares of boys and girls say they feel a lot of pressure to get good grades, be involved in extracurricular activities or fit in socially, girls are more likely than boys to say they face a lot of pressure to look good (35% vs. 23%).
This analysis is based primarily on time diary data from the American Time Use Survey (ATUS), which has been sponsored by the Bureau of Labor Statistics and annually conducted by the U.S. Census Bureau since 2003. The ATUS produces a nationally representative sample of respondents, drawn from the Current Population Survey.
Most of the analyses are based on respondents in the 2003-2006 and the 2014-2017 ATUS samples (referred to in the text as “2005” and “2015”). Data regarding time use in the mid-1990s is based on 1992-1994 data from the American Heritage Time Use Survey (AHTUS). For all time points, multiple years of data were combined in order to increase sample size. Because time use among teens can vary so much between the summer and the school year, only data for September through June are used for these analyses. Although focused on the school year, the data also reflect time use during school holidays, such as spring break.
These time diaries track in detail how Americans spend their time, focusing on each respondent’s primary activity (i.e., the main thing they were doing) sequentially for the prior day, including the start and end times for each activity.
All data were accessed via the ATUS-X website made available through IPUMS.
