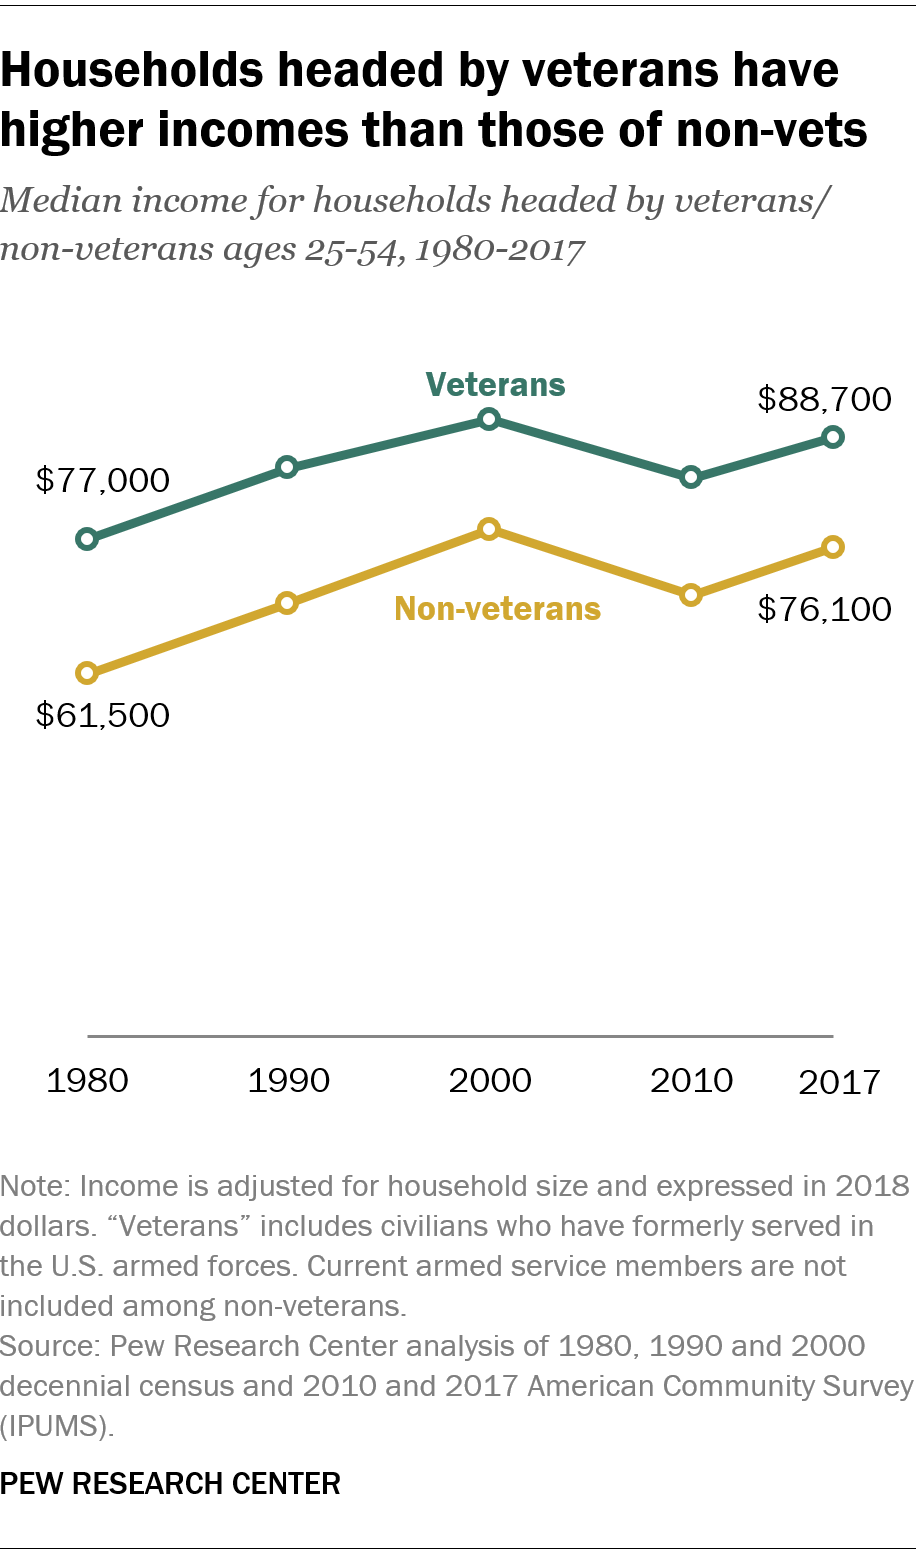
U.S. military veterans and their families have consistently had higher standards of living than non-veterans over the past 40 years, according to a new Pew Research Center analysis of U.S. Census Bureau data. Households headed by veterans have higher incomes and are less likely to be in poverty, on average, and this is especially the case for veterans in racial or ethnic minority groups and those with less education.

In 2017, the median annual income for veteran households was about $88,700, compared with roughly $76,100 for non-veteran households, a difference of more than $12,000. Both groups have experienced income growth since 1980, when the median income was roughly $77,000 for veteran households and about $61,500 for non-veteran households. Still, the gap between the two groups has persisted over about four decades.
Incomes in this analysis are adjusted for household size, scaled to reflect three-person households and expressed in 2018 dollars. The analysis is restricted to people during their prime working years between ages 25 and 54 to control for the fact that veterans tend to be much older than non-veterans: 46.9% of veterans are 65 and older compared with 19.1% of non-veterans.
See also: How veterans and non-veterans fare in the U.S. job market
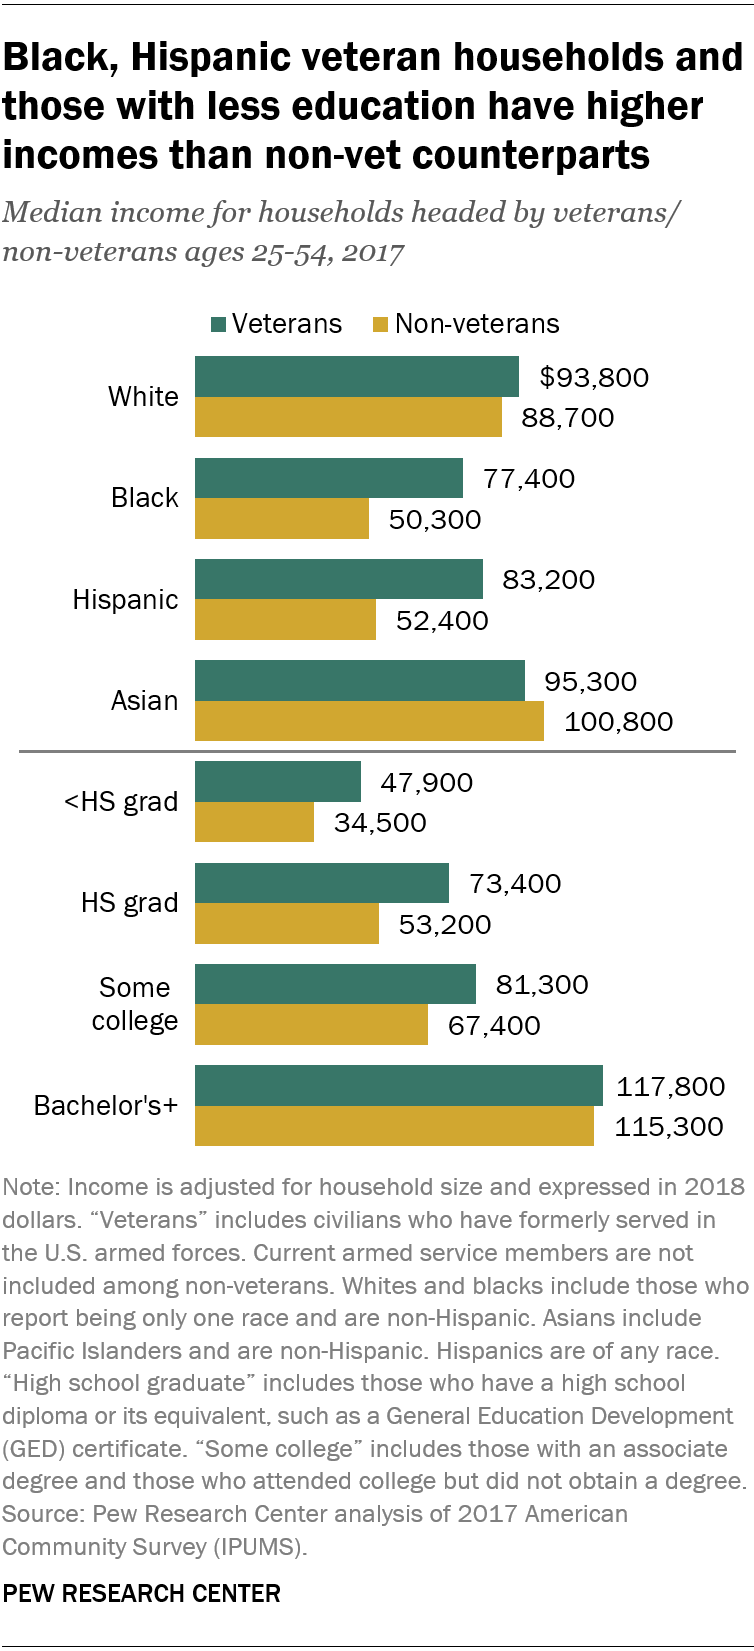
Not only do veteran households fare better overall economically, households headed by racial or ethnic minority veterans and those with lower levels of education have significantly higher standards of living than their non-veteran counterparts. In 2017, the median incomes of non-Hispanic black and Hispanic veteran households were more than $20,000 greater than those of black and Hispanic non-veteran households. Among non-Hispanic whites, by comparison, the gap in median income between households headed by veterans and non-veterans was only about $5,100.

Income differences between veteran and non-veteran households are also large when examined by education level. The median income is roughly $20,000 higher for households headed by a veteran with a high school diploma, compared with non-veteran households with the same level of education. As education increases, the income gap between the two groups decreases to only about $2,500.
Veteran households also fare better than non-veteran households when looking at other economic measures, including poverty. In 2017, the poverty rate for non-veteran households was 6.4 percentage points higher than the rate for veteran households (13.0% vs. 6.6%). However, the poverty rate has grown more for veterans since 1980. The rate increased slightly from 12.7% to 13.0% in 2017 for non-veteran households during that span, while it has increased from 4.4% to 6.6% for veteran households.
The poverty rate is defined as the percent of a population that falls below the income threshold established by the U.S. Census Bureau ($19,985 for a family of three in 2018). The poverty status for veteran heads of household is determined by the poverty status of their family.
As with median incomes, poverty rates for black and Hispanic veteran households are much lower than those of their non-veteran counterparts. In 2017, black veteran households had a poverty rate of 9.6%, versus 23.2% for black non-veteran households, a difference of 13.7 percentage points. The rate for Hispanic veteran households was 7.6%, compared with 18.6% for Hispanic non-veteran households. The difference was less stark between households headed by white veterans and white non-veterans: 5.8% vs. 9.4%, respectively.
A previous Pew Research Center study looked at the attitudes and experiences of veterans both while on active duty and during the transition to civilian life. It found that 38% of veterans who have been deployed reported that their deployments had a positive impact on their financial situation. A larger share (47%) said deployments had no impact, while 13% said they had a negative impact.