After months of campaigning, debating, polling, fundraising and eating fried food, Democratic presidential candidates face their first real-world test on Feb. 3, when Iowa voters have their say in the state’s caucuses. Here’s a rundown of important things to know about Iowa and its first-in-the-nation vote.
What is a caucus, and how is it different from a primary?
While primaries are run much like general elections – lots of polling places, a secret ballot, many hours to vote – Iowa’s caucuses are more like neighborhood meetings. Starting at 7 p.m. in each of the state’s 1,678 voting precincts (and, new this year, 99 satellite locations in Iowa, around the country and overseas), Democratic voters will gather, debate issues and candidates with each other, and eventually cluster in “preference groups” to elect delegates to their county conventions. The precinct caucuses kick off a process which, several months from now, will result in 41 delegates being chosen to represent Iowa at the Democratic National Convention. The whole caucus process, which can take more than an hour, is nicely illustrated here.
Iowa’s Democratic caucuses are open only to registered party members, not unaffiliated voters or those registered as Republicans or with other parties. However, people can register or change their party affiliation on caucus night if they want to participate.
How we did this
For this analysis, we gathered information from a variety of sources that track procedure, participation and outcomes for the Iowa caucuses. These include the Iowa Caucus Project of Drake University, the Iowa secretary of state’s office and various news reports. Demographic and employment data is drawn from the U.S. Census Bureau.
How many people turn out for the caucuses?
For a long time, that was a surprisingly difficult question to answer. Until recently, the parties didn’t report attendance figures, only “state delegate equivalents,” using complex formulas to translate the caucus-night results into state convention delegates. Individual precincts didn’t always keep close counts of how many people caucused, or if anyone left early. Add in that 17-year-olds can caucus if they’ll turn 18 by Election Day, and the difficulties in reliably calculating turnout become clear.
Notwithstanding all that, the Iowa Caucus Project of Drake University estimated that in the 2004 Democratic caucuses and the 2008 and 2012 Republican caucuses, roughly 20% of registered party members participated. In the 2008 Democratic caucus, nearly 40% of eligible Democrats took part.
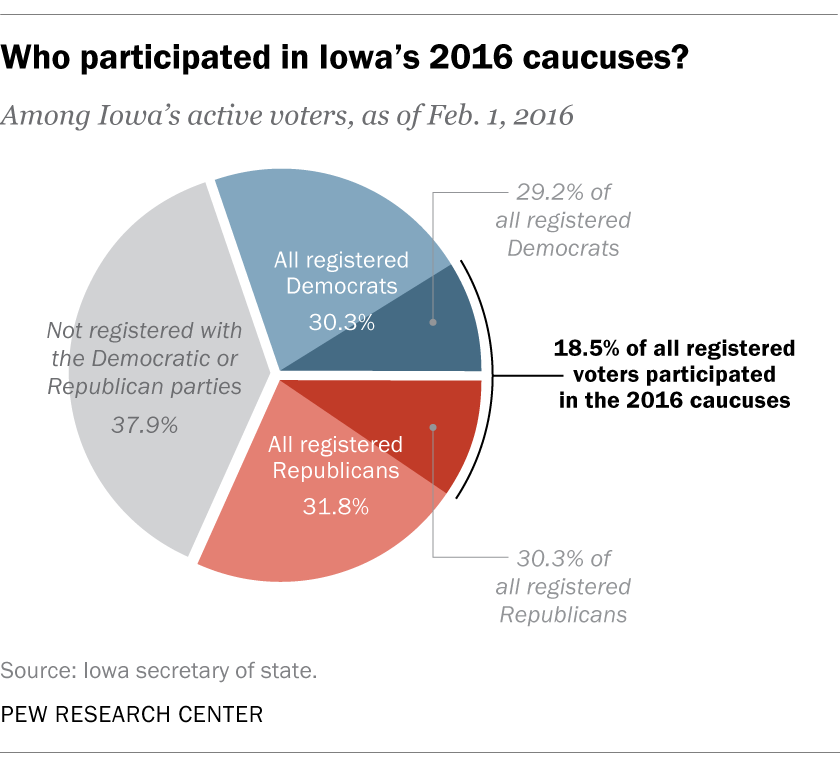
In 2016, 186,874 Iowans participated in the Republican caucus and 171,109 participated in the Democratic caucus, both held on Feb. 1. On that date, according to the Iowa secretary of state’s office, there were 586,835 active registered Democratic voters and 615,763 active Republican registered voters. That works out to 30.3% of eligible Republicans and 29.2% of eligible Democrats participating in the caucuses, or 18.5% of the state’s total 1,937,317 active registered voters. (By comparison, in 2016, turnout averaged 29.3% across all the Democratic and Republican primaries.)
As of Jan. 2, 2020, according to the secretary of state’s office, there were 2,017,205 active registered voters in Iowa. 614,519 (30.5%) were registered Democrats, 639,969 (31.7%) were registered Republicans, and the rest were independents or members of other parties.
How will we know who wins?
That can also be confusing. Consider the Republican caucuses, which historically have combined a nonbinding secret preference vote along with the delegate-selection process. In 2012, state GOP officials first declared Mitt Romney the winner of the preference vote by eight votes, then two weeks later said Rick Santorum had won by 34 votes. In the end, though, Ron Paul won a majority of Iowa’s national convention delegates, despite finishing third in the preference vote.
This year, the Iowa Democratic Party will report three sets of caucus results: the initial count of candidate support (called the “first alignment”), the final alignment (after backers of “nonviable” candidates have had a chance to shift their support to someone else), and state delegate equivalents. That means that theoretically, three different candidates may be able to plausibly claim to have “won” the caucus.
How reliably do the Iowa caucuses predict the ultimate nominee?
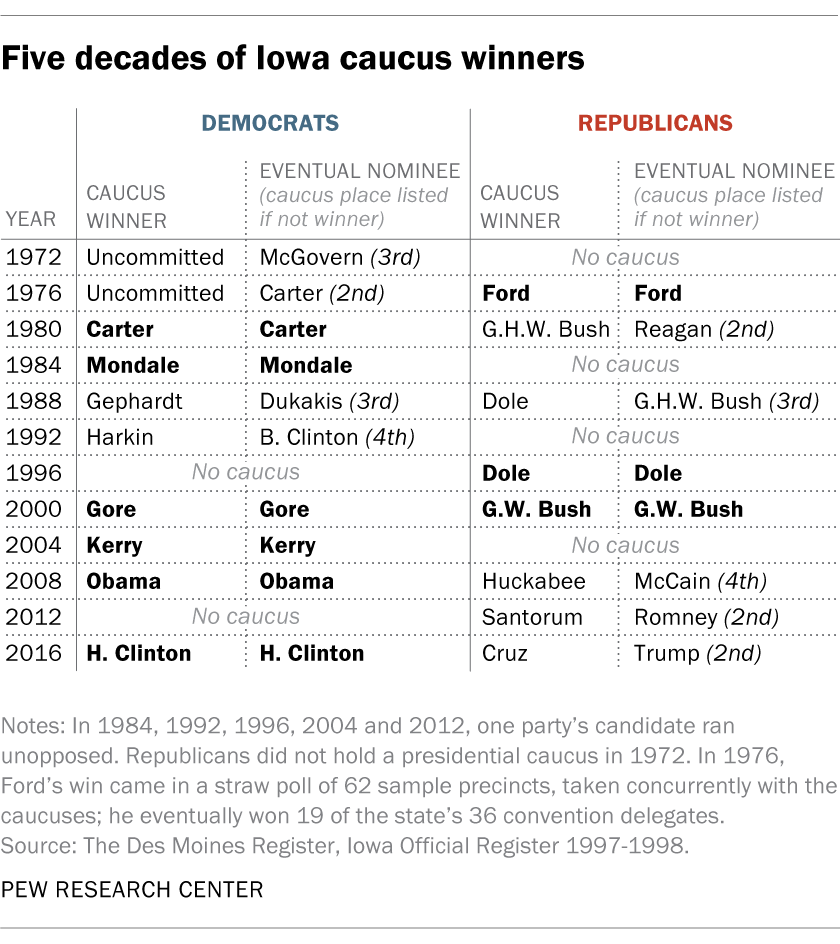
Like so much else with the caucuses, that depends on how you look at it. Since 1972, there have been 10 contested Democratic caucuses; in six of them, including the four most recent, the declared caucus winner ultimately was nominated. On the Republican side, there have been eight contested caucuses in that span, but in only three cases was the caucus winner ultimately the nominee.
For many years, there’s been a saying among caucus-watchers that “there are only three tickets out of Iowa.” That refers to the fact that since 1972 (and excluding years when incumbent presidents ran unopposed for renomination), the eventual nominee has nearly always been one of the top three finishers in the caucuses. The exceptions were Bill Clinton, who placed fourth in 1992, and John McCain, who came in fourth in 2008. Both of those were special cases, though: In 1992 Iowa’s own Sen. Tom Harkin was the overwhelming caucus favorite, so the other Democratic contenders mostly ignored the state. And McCain was just 424 votes behind third-place finisher Fred Thompson.
How many other states and territories use caucuses?
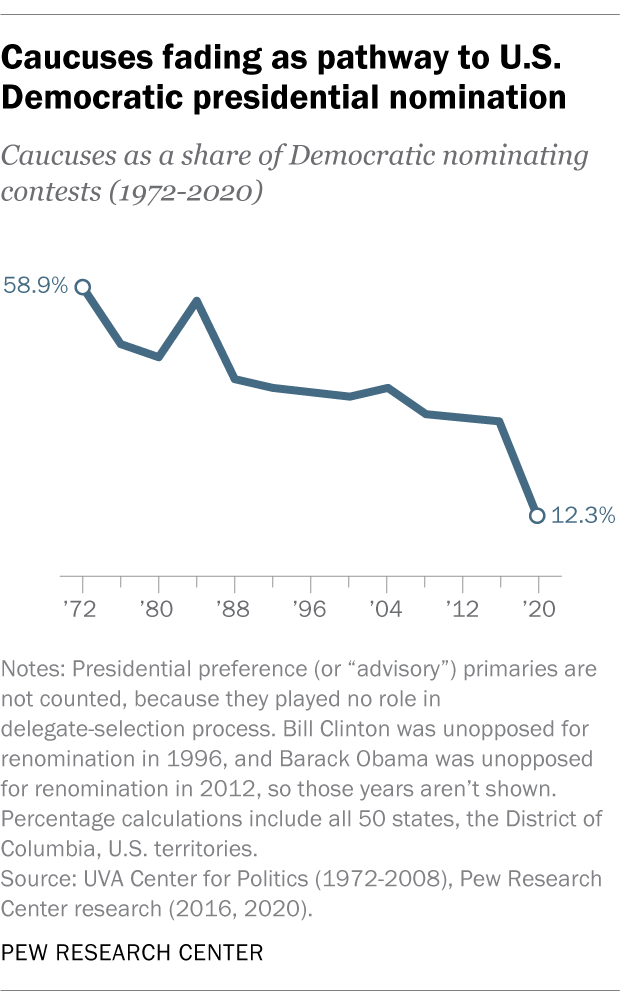
Not as many as used to. This year, besides Iowa, only two other states (Nevada and Wyoming) and four U.S. territories will pick their Democratic convention delegates through caucuses, 11 fewer states than in 2016. In 2018, the national Democratic Party adopted a package of changes to its nominating process, including a rule encouraging state parties to use government-run primaries whenever possible.
Caucuses have been on the decline for a long time. On the Democratic side in 1972, 33 states and territories used them to pick convention delegates, and, as late as 1984, 32 still did. By 2016, however, only 14 states and four territories were still using them. (As a side note, the Republican and Democratic parties in each state can, and often have, choose different methods to select their convention delegates, with one party holding a primary and the other a caucus. We’ve focused on the Democratic side in this post because that’s where the active nomination battle is.)
Why does Iowa vote first?
Caucuses have been features of Iowa politics since the 19th century, but, as one historian wrote, they attracted no national attention before 1972: “Generally, caucus attendance was poor, and often a handful of party regulars were the only persons present.”
That changed after the national Democratic Party revamped its nominating process in the wake of its chaotic 1968 convention. As a consequence of those changes, the Iowa party moved its precinct caucuses – which typically had been held in late March or early April – to Jan. 24, somewhat inadvertently making them the first step on the long road to the national convention. In 1972, George McGovern campaigned in Iowa to raise his profile ahead of the New Hampshire primary; even though McGovern came in third in Iowa, he ultimately won the nomination. In 1976, the Republican and Democratic parties agreed to hold their caucuses on the same day, and both attracted substantial attention from candidates and the media. Since then, the state has zealously defended its first-in-the-nation status.
But this status has not come without opposition. Among registered voters who identify as Democrats or as independents who lean toward the Democratic Party, 26% say it’s a bad thing that Iowa’s caucuses (and the New Hampshire primary) go before other states, versus 9% who say it’s a good thing, according to a new Pew Research Center report. (The majority say it’s neither a good nor bad thing.) Opposition was strongest among liberals and those who said they’ve thought a lot about the candidates.
How does Iowa compare demographically with the U.S. as a whole?
Many observers and pundits say that Iowa’s de facto gatekeeper role is unfair because it is in many ways so unlike the United States as a whole (although others argue that, depending on which metric you use, the state is more representative than it’s often given credit for being).
White adults account for a much larger share of Iowa’s population than is the case for the U.S. as a whole. Among Iowa’s 18-and-older population, 91.6% are white, versus 73.8% of all 18-and-older Americans, according to 2018 Census data. Black Americans make up 12.4% of the 18-and-older population but just 3.2% in Iowa; Hispanics, who can be of any race, are 16.2% of the U.S. 18-and-older population but only 4.8% in Iowa.
Despite the acres upon acres of corn and soybean fields you may have seen on TV, only 3.3% of employed Iowans work in agriculture and related industries. That’s still more than double the share among all Americans (1.3%). Around one-in-six employed Iowans (15.1%) work in manufacturing, compared with 10% in the nation as a whole. In 2018, 7.2% of Iowa families had incomes below the poverty level, versus 9.3% of all U.S. families.
Iowa is less urban than most states. The 2010 census found that 64% of Iowans live in urban areas, ranking it 39th out of the 50 states. (Nationwide, 80.7% of Americans live in urban areas.)
In terms of educational attainment, 29% of Iowans ages 25 and older have a bachelor’s degree or more, compared with 32.6% among all Americans in that age range.
