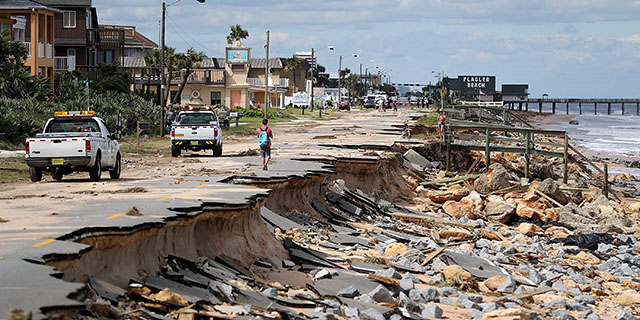
More than six-in-ten Americans (63%) say climate change is currently affecting their local community either a great deal or some, according to a Pew Research Center survey conducted April 29-May 5, 2020 – similar to the share who said this in surveys from 2019 and 2018.
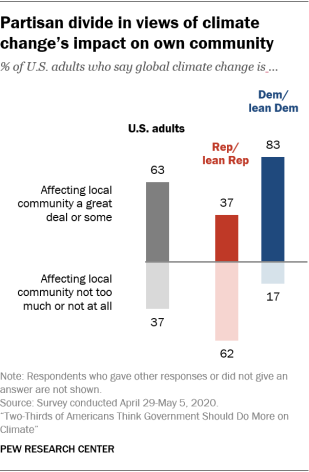
As is the case on many climate-related issues, perceptions of whether and how much climate change is affecting local communities are closely tied with political party affiliation. More than eight-in-ten Democrats and independents who lean to the Democratic Party (83%) say climate change is affecting their local community at least some, compared with 37% of Republicans and Republican leaners.
How we did this
Pew Research Center conducted this study to understand how Americans view climate, energy and environmental issues, and how attitudes vary by where Americans live. This analysis is based on a survey of 10,957 U.S. adults conducted from April 29 to May 5, 2020.
Everyone who took part is a member of Pew Research Center’s American Trends Panel (ATP), an online survey panel that is recruited through national, random sampling of residential addresses. This way nearly all U.S. adults have a chance of selection. The survey is weighted to be representative of the U.S. adult population by gender, race, ethnicity, partisan affiliation, education and other categories. Read more about the ATP’s methodology.
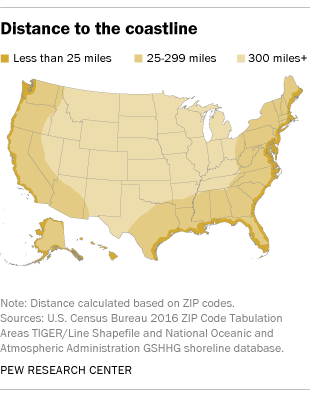
To calculate the distance to the nearest point on the U.S. coastline, respondents with valid ZIP codes were located at the ZIP code centroid (from the 2016 definition of the ZIP code tabulation areas provided by the Census Bureau). The minimum distance between each respondent’s ZIP code and the nearest point on the coastline was calculated using the spherical law of cosines approximation. You can learn more about this kind of analysis in this explainer.
Here are the questions used for this analysis, along with responses, and its methodology.
Democrats are more likely than Republicans to live within 25 miles of a coastline (37% vs. 25%), but in both party coalitions, those who live closer to a coast are more likely to perceive greater impacts from climate change in their local area.
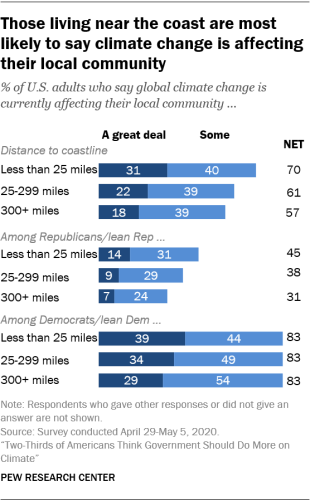
Among Republicans and GOP leaners, 45% of those who live within 25 miles of a coastline say climate change is affecting their local community at least some, compared with 31% of Republicans who live 300 miles or more from a coastline.
Large majorities of Democrats – both near and far from a coast – say climate change is affecting their local community at least some. But Democrats who live within 25 miles of a coastline are more likely than Democrats who live 300 miles or more inland to say climate change is impacting their community a great deal (39% vs. 29%).
When asked what specific effects of climate change they see in their local communities, Americans who live near a coast are far more likely than those who live inland to point to rising sea levels that erode beaches and shorelines as a major impact in their community. About three-quarters (73%) of those who live near a coastline and see at least some effect of climate change point to rising sea levels, compared with 45% of those who live farthest away. That perspective is shared among both Democrats (75%) and Republicans (73%) living near a coast.
A 2019 United Nations report warned that climate change is warming oceans, resulting in more severe flooding and storms. Rising seas could have major economic implications for coastal communities.
Americans living close to a coast also stand out when it comes to their views toward increased oil and gas drilling. Those living within 25 miles of a coastline are less likely than those living 300 miles or more away to favor expanding drilling for oil and natural gas (32% vs. 44%). This difference is especially pronounced among Republicans: Those living near the coast are 13 percentage points less likely than those living further away to favor expanding offshore oil and gas drilling (55% vs. 68%). Regardless of where they live, large shares of Democrats oppose more offshore oil and gas drilling.
Note: This is an update of a post originally published on May 16, 2018. Here are the questions used for this analysis, along with responses, and its methodology.
