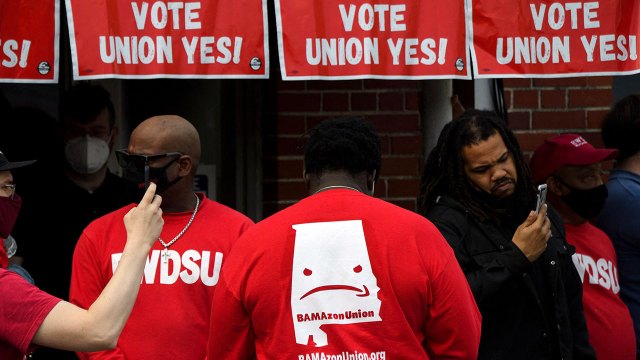
One of the most closely watched union representation elections in years wraps up today, as some 5,800 workers at an Amazon warehouse outside Birmingham, Alabama, decide whether to unionize. The all-mail vote has drawn attention to both the employer and the state involved, neither of which has much reputation for being receptive to organized labor.
Unions hope a win in Alabama will offer a road map for successful organizing campaigns elsewhere at Amazon, which employed nearly 1.3 million people worldwide, both full- and part-time, at the end of 2020.
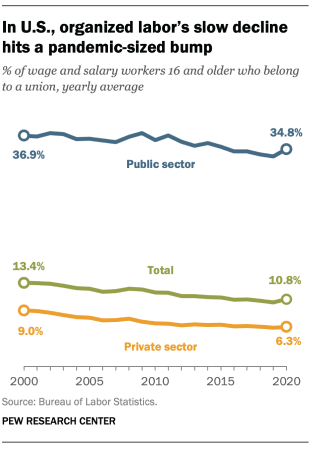
The election comes as the long-running decline of U.S. organized labor, especially in the private sector, has had a somewhat unexpected – but likely temporary – turnaround amid the coronavirus pandemic.
This analysis was based on the Bureau of Labor Statistics’ annual report on union membership and the historical data included in it. The BLS collects union membership data as part of the monthly Current Population Survey. Rates are calculated as a percentage of all wage and salary workers in a given state, industry, occupation or other category. Self-employed workers are excluded. All figures represent annual averages.
Although union membership estimates are available going back to 1983, until 1999 they excluded agricultural workers, making the data from those years not directly comparable to later years. For consistency, we chose to begin our analysis with the year 2000.
The COVID-19 pandemic and the efforts to contain it, including the mandatory shutdowns of large parts of the U.S. economy for all or part of 2020, had disparate impacts on union members and nonmembers, as explained in the post. The BLS suggests interpreting the 2020 figures with caution.
An estimated 10.8% of U.S. wage and salary workers reported being members of a labor union in 2020, up from 10.3% in 2019, according to the federal Bureau of Labor Statistics. That’s the biggest one-year increase in the unionization rate in the nearly four decades the BLS has been tracking the subject.
At the same time, the number of union members continued to fall last year, to just under 14.3 million nationwide, or 321,000 fewer than in 2019. How can this be?
It turns out that, while millions of U.S. workers lost their jobs in 2020 due to the coronavirus pandemic, nonunion workers were hit much harder. Based on our analysis of the BLS data, the nonunionized portion of the wage and salary workforce shed more than 9.2 million jobs last year, a decline of 7.3% compared with 2019. The unionized workforce, by contrast, fell by just 2.2%. As a result, the overall unionized share of the wage and salary workforce increased.
There was also a noteworthy distinction among union members. The number of unionized private-sector workers fell by 5.7% last year, while the number of unionized public-sector workers rose slightly – by 1.5%, or about 107,000 workers. Those gains came mainly at the federal and state levels.
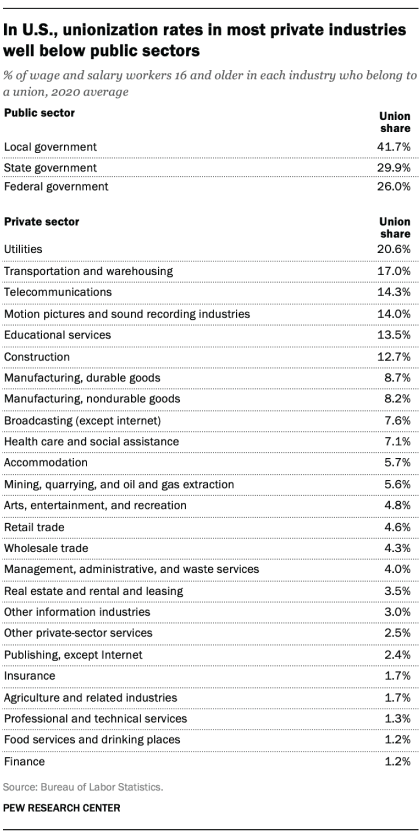
Overall, 6.3% of private-sector wage and salary workers reported belonging to a union last year. Utilities had the highest unionization rate among the 25 private-sector industries and sub-industries we examined: Last year, 20.6% of wage and salary workers in the utilities industry belonged to unions. The next-highest rates were in transportation and warehousing (17%), telecommunications (14.3%) and the movie and music business (14%).
The lowest unionization rates were in professional and technical services, a broad category that ranges from lawyers and accountants to architects and engineers (1.3%), food service and drinking places (1.2%) and finance (also 1.2%).
In 2000, just under 9% of all private sector wage and salary workers belonged to a union, meaning the unionization rate has fallen by more than 2.6 percentage points over the past two decades. But as with overall unionization rates, some industries have experienced steeper declines than others. In fact, many of the industries with the highest unionization rates also have experienced the biggest drops.
In telecommunications, for example, the unionization rate fell by 9.5 percentage points between 2000 and 2020. The decline was 8.7 points in transportation and warehousing, 6.7 points in utilities, and 6.5 points in durable-goods manufacturing. The only private-sector industry where unionization rose significantly was educational services: 13.5% of workers in that industry were union members last year, an increase of 2 points from 2000.
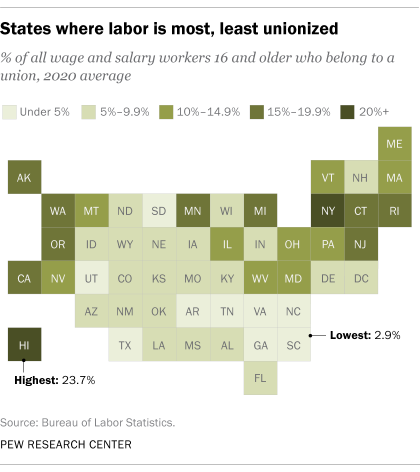
In Alabama last year, 8% of wage and salary workers said they belonged to a union. While below the national level of 10.8%, Alabama’s rate actually is the highest in the Southeast, a region that otherwise has some of the lowest levels of unionization in the nation. The absolute lowest in the country, in fact, are in the Carolinas: 3.1% of wage and salary workers in North Carolina, and 2.9% in South Carolina, are union members.
By contrast, 23.7% of Hawaii’s wage and salary workers said they belonged to a union in 2020, as did 22% of workers in New York, 17.8% in Rhode Island and 17.7% in Alaska.
Perhaps not surprisingly, many of the states with the biggest declines in unionization over the past two decades are in the Rust Belt of the Midwest and Northeast. They include Wisconsin (down 9.1 percentage points), Indiana (down 7.1 points), Iowa (down 6.6 points) and Michigan (down 5.1 points). The District of Columbia, interestingly, also experienced one of the larger declines: down 5.8 points over the past two decades. Vermont had the biggest increase in unionization, rising 1.4 percentage points between 2000 (10.4%) and 2020 (11.8%).


