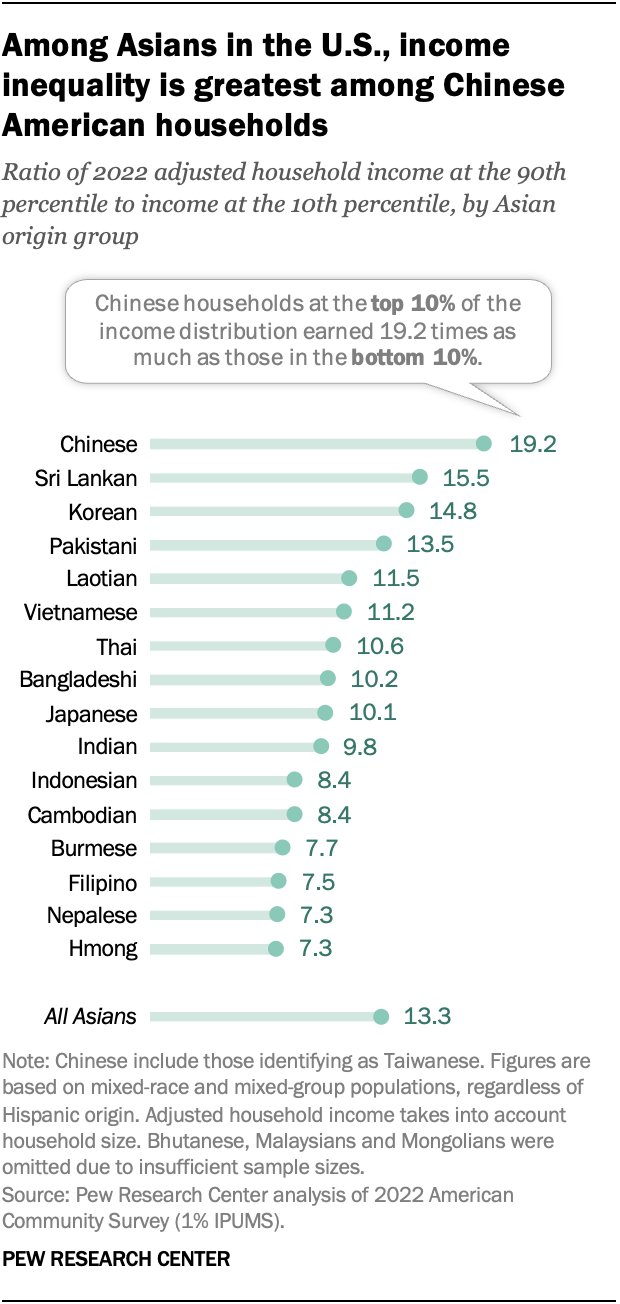
In 2022, Chinese American households near the top of the income ladder earned over 19 times as much as Chinese American households near the bottom of the ladder. This gap was the largest across Asian American households of different origins, according to a new Pew Research Center analysis of U.S. Census Bureau data.
Income inequality is a measure of the income gap between highest- and lowest-earning households. It has long been a public concern in the United States, especially after the economic upheaval brought about by the COVID-19 pandemic.
A 2018 analysis by the Center found that income inequality is greater among Asian Americans than any other U.S. racial or ethnic group. In this new analysis, we explore income inequality within the origin groups that make up the Asian American population.
Related: The State of the American Middle Class
Pew Research Center conducted this analysis to better understand levels of income inequality across and within Asian origin groups using the 90/10 ratio. This is the ratio of the income at the 90th percentile of the income distribution to the income at the 10th percentile. It provides a simple measure of the distance between the top and the bottom of the income distribution.
In this analysis, household “income” refers to the combined resources of all members of a household, whether a household member had personal earnings or not. Thus, people’s incomes are represented by their household’s income adjusted for household size.
The main sources used are the 2022 American Community Survey and the 1980 decennial census (1% metro sample), both obtained through Integrated Public Use Microdata Series (IPUMS).
Income inequality differs widely across Asian origin groups
One of the most common measures of income inequality is the “90/10 ratio.” This metric reflects the ratio of household income of those at the 90th percentile (the top 10% of earners) to those in the 10th percentile (the bottom 10% of earners).
Among all Asian origin groups in the U.S., Chinese American households had the highest income inequality in 2022, with a 90/10 ratio of 19.2. In other words, Chinese households in the 90th percentile of the income distribution earned 19.2 times as much as their counterparts in 10th percentile.
Sri Lankan, Korean and Pakistani American households also had high levels of income inequality in 2022. Within each of these origin groups, households in the top 10% had more than 13 times the income of those in the bottom 10%. Laotian and Vietnamese households also had 90/10 ratios above 11, indicating a high degree of income inequality.
By contrast, Burmese, Filipino, Nepalese and Hmong households had the lowest income gaps among U.S. Asians in 2022, all with 90/10 ratios lower than 8. Still, even among Hmong households, those in the top 10% earned 7.3 times that of those in the lowest 10%.
Income inequality has increased among most of the largest Asian origin groups
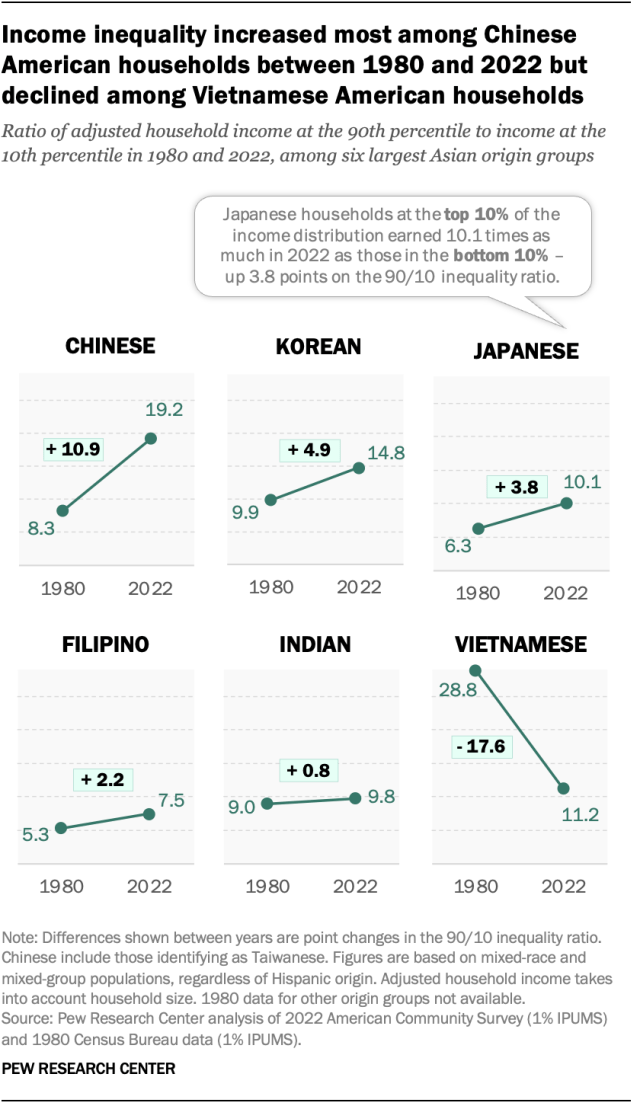
Income inequality has risen among nearly all of the largest Asian origin groups in the U.S. since 1980.
The biggest increase occurred among Chinese American households. Their 90/10 income ratio rose from 8.3 in 1980 to 19.2 in 2022. Korean, Japanese, Filipino and Indian households also experienced increases in income inequality over this time period.
Vietnamese Americans are the exception to this pattern. Since 1980, the income inequality ratio among Vietnamese households has declined by over 17 points in the 90/10 income ratio. It’s not clear what is behind this trend, but many Vietnamese Americans in 1980 were new immigrants who entered the U.S. following the end of the Vietnam War in 1975.
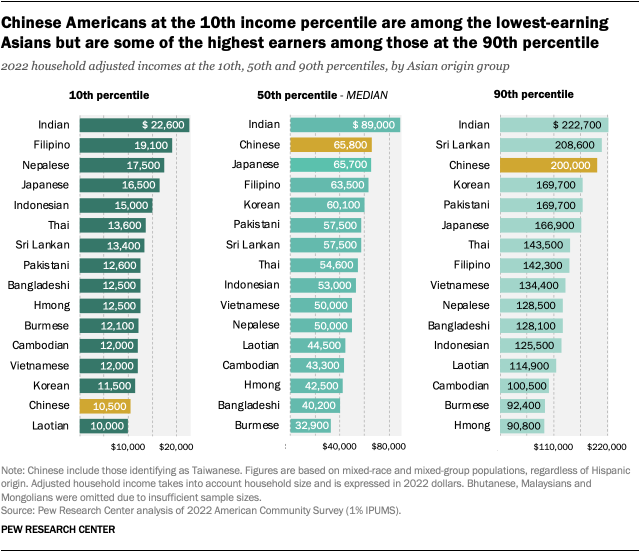
Among Asian Americans, Chinese households are among the lowest – and highest – earners
Indian Americans are frequently the highest-earning Asian origin group when looking at different steps on the income ladder. For example, they top the list when looking at those who belong to the lowest 10% of households and the top 10% of households by earning levels.
The story is different for Chinese Americans. At the lower end of the income distribution – the 10th percentile – Chinese Americans who belong to the lowest-earning households were among the poorest Asian origin groups in 2022, with annual earnings of $10,500. At the 50th percentile of the income distribution – the median – Chinese American households were among the Asian origin groups with the highest incomes, with earnings of $65,800. And at the 90th percentile, Chinese households earned $200,000 in 2022 – second only to Indian Americans. (Incomes are adjusted for household size and expressed in 2022 dollars.)
The lowest- and highest-earning Asian households differ demographically
Across the six largest Asian origin groups in the U.S., there are some key demographic differences between those at the lowest and highest ends of the income distribution.
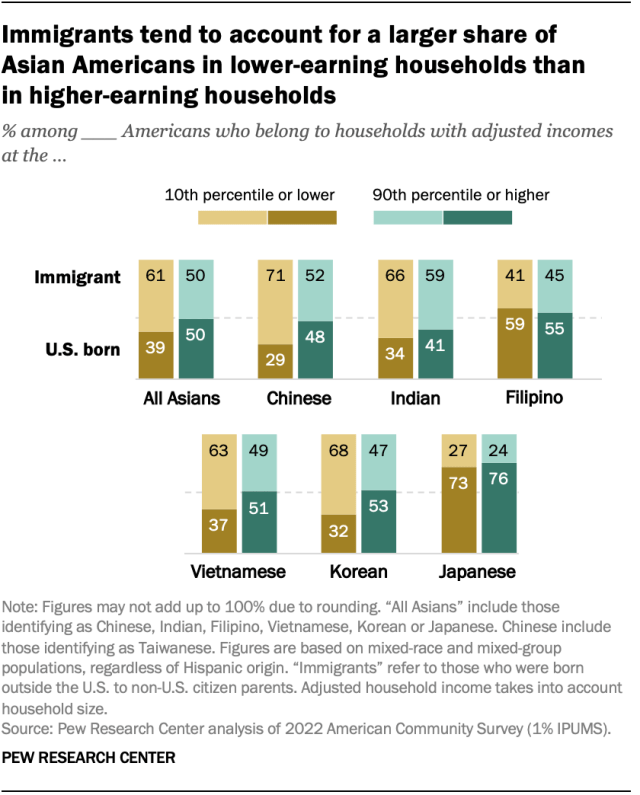
Nativity
Among most of the largest Asian origin groups, those in the bottom 10% of earners are more likely than those in the top 10% to be immigrants. However, Filipino and Japanese Americans at both ends of the income ladder are about as likely to be U.S. born as foreign born.
Length of time in the U.S.
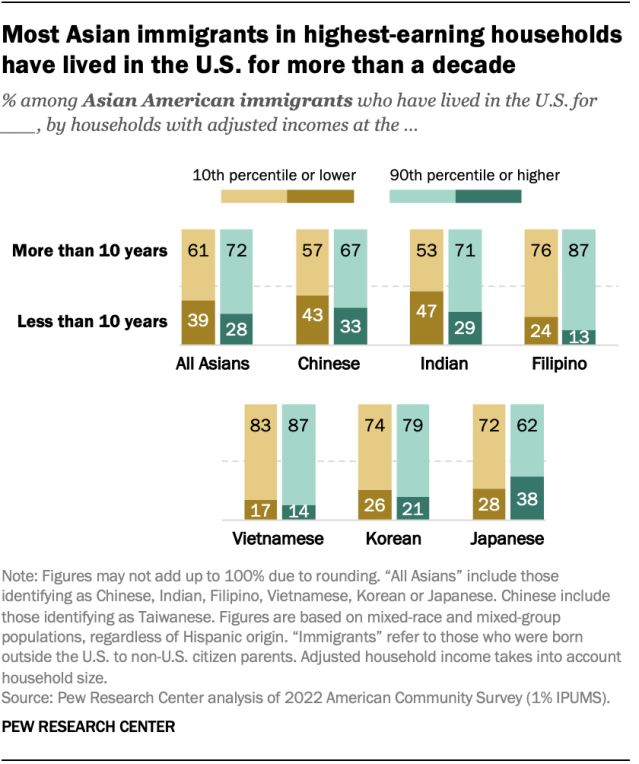
For five of the six largest Asian origin groups – all but Japanese Americans – immigrants in the highest-earning households have higher or similar shares that have lived in the U.S. for more than 10 years when compared with those in the lowest-earning households.
For example, 71% of the highest-earning Indian American immigrants have resided in the U.S. for more than 10 years. A much smaller share of Indian American immigrants in the lowest-earning households (53%) have lived in the U.S. for that long.
Educational attainment
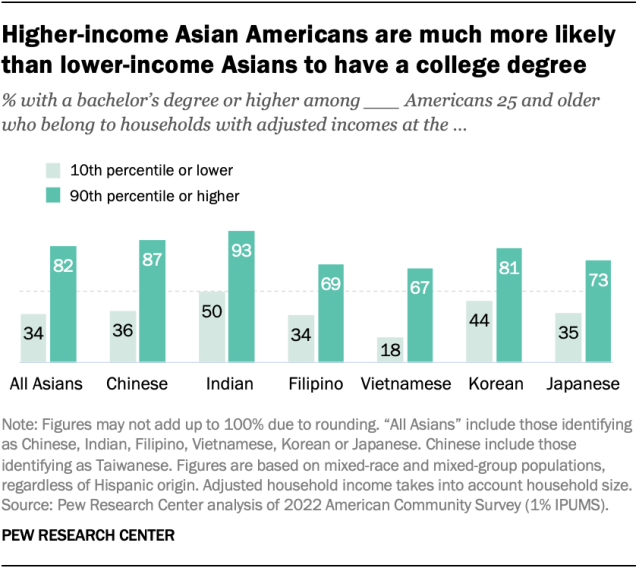
The top 10% of Asian Americans by earnings are far more likely than those in the bottom 10% to have a bachelor’s degree or more education. This trend holds true for all six major Asian American origin groups.