People around the world generally believe representative democracy is a good way to govern their countries. But as a new Pew Research Center survey highlights, many are dissatisfied with the way it is working. And in several high-income democracies, dissatisfaction has been on the rise.
This Pew Research Center analysis focuses on views of democracy in 31 countries across the Asia-Pacific region, Europe, Latin America, the Middle East, North America and sub-Saharan Africa.
This analysis draws on nationally representative surveys of 36,412 adults conducted from Jan. 5 to May 15, 2024. All surveys were conducted over the phone with adults in Canada, France, Germany, Greece, Italy, Japan, Malaysia, the Netherlands, Singapore, South Korea, Spain, Sweden and the United Kingdom. Surveys were conducted face-to-face in Argentina, Brazil, Chile, Colombia, Ghana, Hungary, India, Israel, Kenya, Mexico, Peru, the Philippines, Poland, South Africa, Sri Lanka and Thailand. In Australia, we used a mixed-mode probability-based online panel.
In the United States, we surveyed 3,600 adults from April 1 to 7, 2024. Everyone who took part in this survey is a member of the Center’s American Trends Panel (ATP), an online survey panel that is recruited through national, random sampling of residential addresses. This way nearly all U.S. adults have a chance of selection. The survey is weighted to be representative of the U.S. adult population by gender, race, ethnicity, partisan affiliation, education and other categories. Read more about the ATP’s methodology.
The survey was conducted right after the 2024 legislative elections in South Korea. In India, Mexico and South Africa, the survey was completed before the most recent elections.
To compare views of those who support the governing party or parties with those who do not, we grouped respondents based on their answers to a question asking them which political party, if any, they identified with in their country. For more, including country specific classifications, read our Political Categorization Appendix.
To compare educational groups across countries, we standardized education levels based on the UN’s International Standard Classification of Education.
Prior to 2024, combined totals were based on rounded topline figures. For all reports beginning in 2024, totals will be based on unrounded topline figures, so combined totals might be different than in previous years. Refer to the 2024 topline to see our new rounding procedures applied to past years’ data.
Here is the question used for this analysis, along with responses, and the survey methodology.
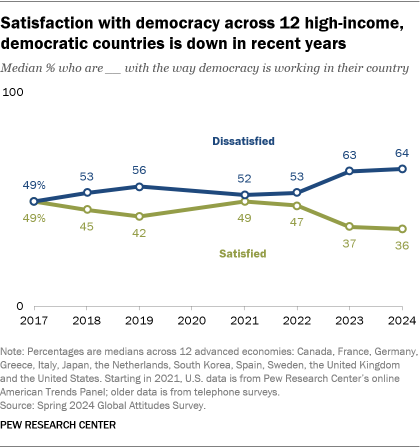
Since 2017, we’ve regularly asked people in 12 economically advanced democracies how satisfied they are with the state of their democracy. Overall, satisfaction declined in these countries between 2017 and 2019 before bouncing back in 2021, during the COVID-19 pandemic.
Since 2021, however, people in these nations have become more frustrated with their democracies. A median of 49% across these 12 nations were satisfied with the way their democracy was working in 2021; today, just 36% hold this view. (The 2024 survey was conducted before the European Parliament elections in June.)
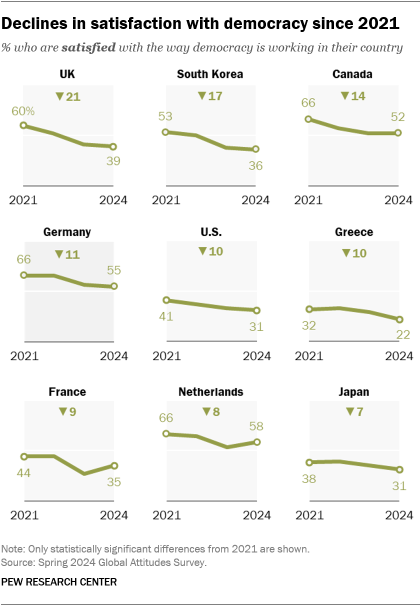
Satisfaction is lower today than it was in 2021 in nine of the 12 nations where we have asked the question consistently. This includes six countries where satisfaction has dropped by double digits: Canada, Germany, Greece, South Korea, the United Kingdom and the United States.
Satisfaction has not increased in any of the 12 countries surveyed.
How does satisfaction with democracy vary today?
In addition to the 12 countries where the Center has consistently asked about satisfaction with democracy over time, we asked the same question this year in 19 other countries. Across 31 nations polled in spring 2024, a median of 54% say they are dissatisfied with their democracy, while 45% are satisfied.
Countries in this analysis
The countries included in this analysis receive moderate to positive ratings from research organizations that rate the health of democracy, such as the Economist Intelligence Unit, Freedom House and the Varieties of Democracy Project. Countries in our 2024 survey that are classified as autocratic or a hybrid regime by more than one expert source were excluded from this analysis.
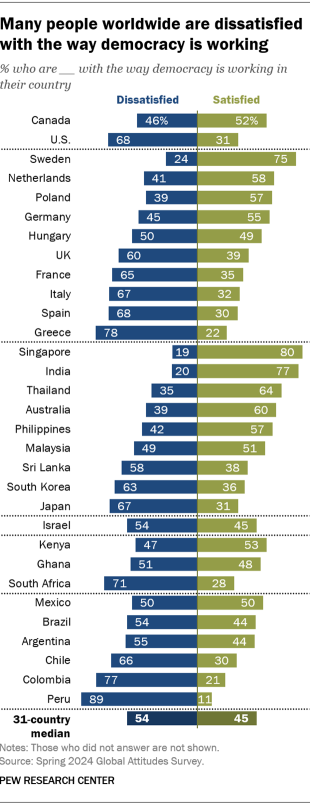
Looking across regions, opinions in Europe vary widely: 75% of Swedes are satisfied with their democracy, compared with just 22% in Greece. The same is true in the Asia-Pacific region, where more than three-quarters of Indians and Singaporeans – but only 31% of Japanese – are satisfied with the way their democracy is working. (Our survey took place before recent elections in India.)
In sub-Saharan Africa and Latin America, about two-thirds or more of South Africans, Chileans, Colombians and Peruvians express negative views about their democracies. (Fieldwork in South Africa also took place prior to the country’s recent elections.)
Related: In Their Own Words: What Can Improve Democracy?
How people feel about the way democracy is working is strongly related to how they believe their economy is working. In all 31 nations polled, people who rate the national economy negatively are more likely than those who rate it positively to be dissatisfied with their democracy.
Similarly, how people feel about the governing party in their country is linked to their assessments of democracy. In 27 countries, supporters of the governing party or coalition are particularly likely to say they are satisfied with the way their democracy is working. (Refer to the Appendix for country-specific governing party classifications.)
In eight countries – Argentina, Chile, France, Germany, the Netherlands, Poland, Spain and the U.S. – people with less education are less satisfied than those with more education with the way democracy is working in their country. And in seven countries – Argentina, Chile, Colombia, Germany, Peru, Singapore and South Korea – adults under 35 are more satisfied with democracy compared with those ages 50 and older. In other countries surveyed, there are few differences by education level or age.
Note: Here is the question used for this analysis, along with responses, and the survey methodology.

