From 2016 to 2024, the number of Latinos eligible to vote grew from 27 million to a projected 36 million.
While Latino voters have favored Democratic candidates in presidential elections for many decades, the margin of support has varied. In 2020, 61% of Latino voters cast their ballot for Joe Biden, while 36% voted for Donald Trump, a narrower margin than in 2016 between Hillary Clinton and Trump.
Pew Research Center conducted this analysis to understand U.S. Hispanics’ views of the 2024 presidential election campaign. For this analysis, we surveyed 9,424 adults – including 670 Hispanic registered voters – from July 1 to 7, 2024.
Everyone who took part in this survey is a member of the Center’s American Trends Panel (ATP), a group of people recruited through national, random sampling of residential addresses who have agreed to take surveys regularly. This kind of recruitment gives nearly all U.S. adults a chance of selection. Surveys were conducted either online or by telephone with a live interviewer. The survey is weighted to be representative of the U.S. adult population by gender, race, ethnicity, partisan affiliation, education and other factors. Read more about the ATP’s methodology.
Here are the questions used for this analysis, the topline and the survey methodology.
Here are key facts about how Latino registered voters view the presidential candidates and major issues ahead of the 2024 election, based on a Pew Research Center survey. The July 1-7 survey was conducted after President Biden’s poor performance in the June 27 debate and before Trump was injured and a spectator killed in a shooting at a campaign rally on July 13.
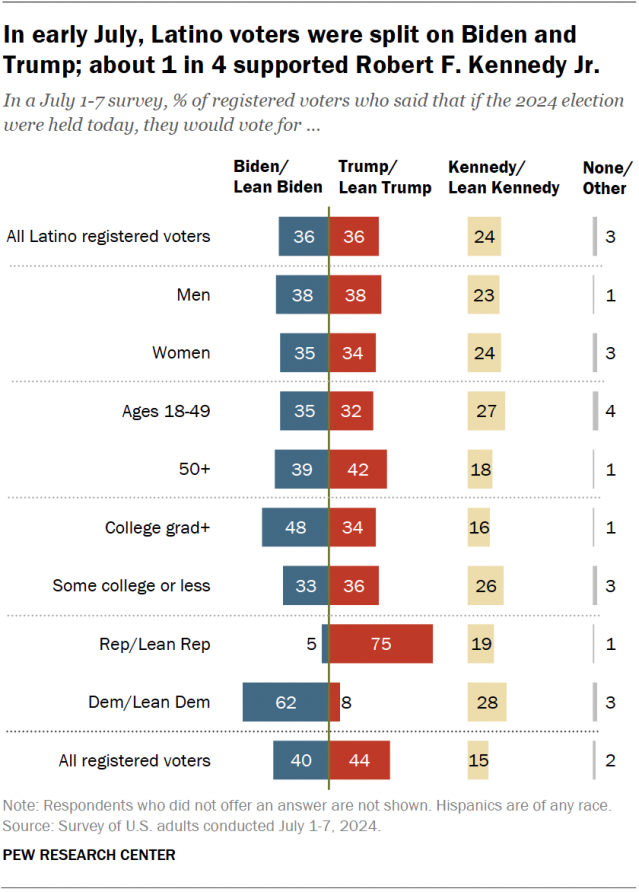
Robert F. Kennedy Jr. – a third-party candidate – gets the support of 24% of Latino registered voters. Support for Kennedy is higher among Latinos than among U.S. voters overall (15%).
Related: Third-party and independent candidates for president often fall short of early polling numbers
Neither Biden nor Trump has the confidence of most Latino voters on several issues.
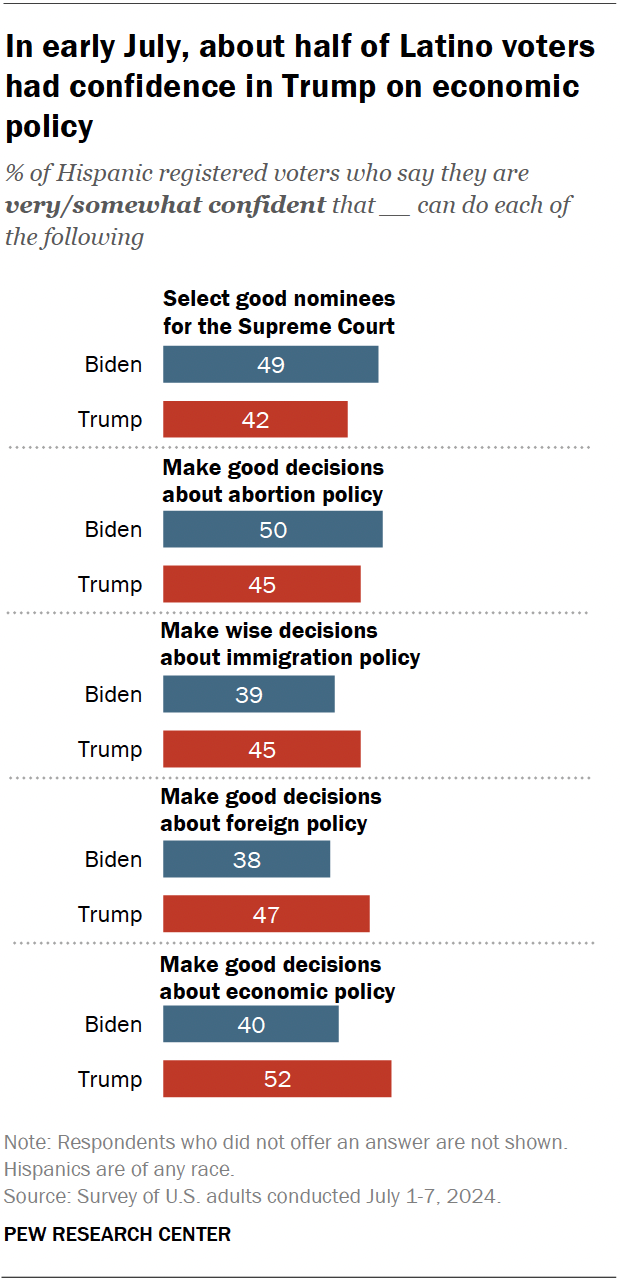
The state of the U.S. economy and inflation have been top issues for Latino voters in 2024.
About half of Latino voters (52%) say they have confidence that Trump will make good decisions about economic policy.
By comparison, four-in-ten say they have confidence in Biden in this area. Trump also has a slim edge over Biden on foreign policy.
Meanwhile, 49% of Latino voters say they have confidence in Biden to select good Supreme Court nominees, compared with 42% who say the same about Trump.
When it comes to making good decisions about abortion policy, 50% of Latino voters express confidence in Biden, while 45% have confidence in Trump.
And on immigration, 39% have confidence in Biden, while 45% have confidence in Trump.
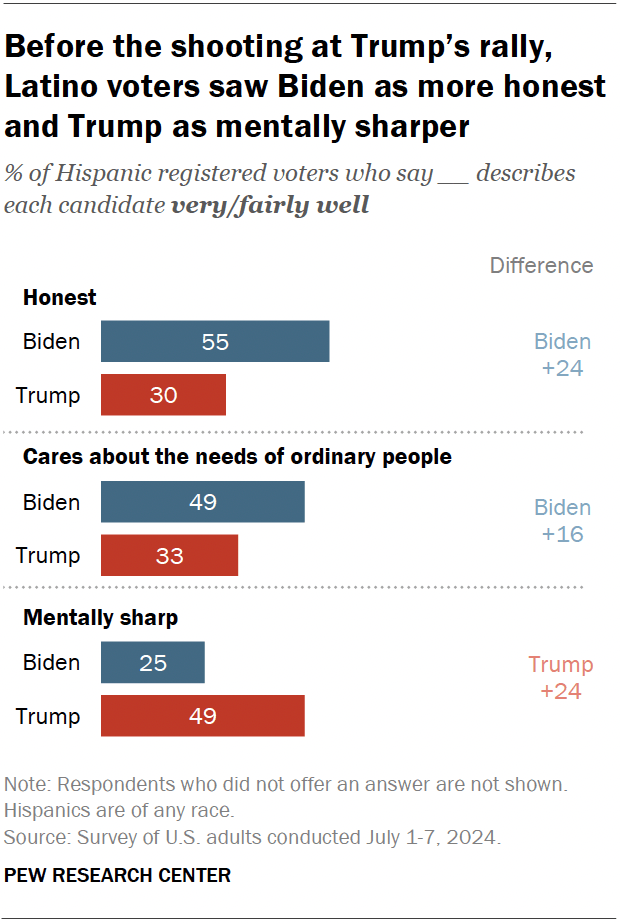
Relatively few Latino voters would describe Trump as honest and Biden as mentally sharp. Roughly half of Latino voters (55%) say “honest” describes Biden very or fairly well, while 30% say the same about Trump.
And just a quarter of Latino voters say they would describe Biden as “mentally sharp,” while nearly twice as many (49%) describe Trump this way.
Latino voters continue to have a more favorable opinion of the Democratic Party than the Republican Party. However, neither party is viewed favorably by a majority of Latino voters (or of the public overall).
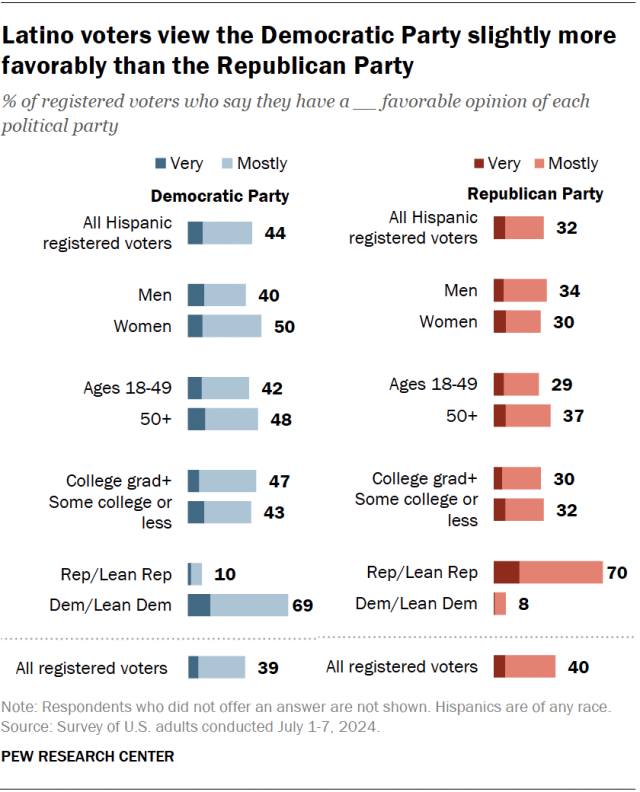
Some 44% of Latino registered voters have a very or mostly favorable opinion of the Democratic Party, while 32% say the same about the GOP.
Views of the Democratic Party also vary among Latino voters based on certain demographic characteristics:
- Women are more likely than men to say they have a favorable opinion of the Democratic Party (50% vs. 40%).
- Latino voters ages 50 and older are somewhat more likely than their younger counterparts to say they have a favorable view of the Democratic Party (48% vs. 42%).
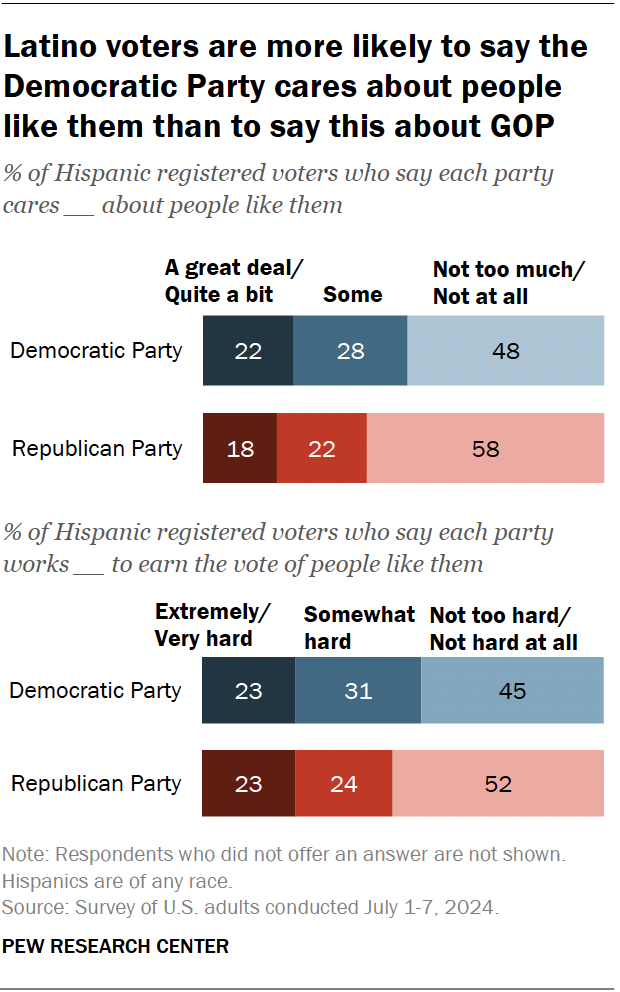
Half of Latino registered voters say the Democratic Party cares at least somewhat about people like them. Four-in-ten have the same view of the Republican Party.
Similarly, when Latinos are asked how hard each party works to earn the vote of people like them, roughly half of Latino voters say the Democratic Party works at least somewhat hard (54%) compared with 47% who say this about the GOP.
Note: Here are the questions used for this analysis, the topline and the survey methodology.


