
Note: A data release by the Census Bureau in December 2024 may affect estimates of the size of the immigrant population and the unauthorized immigrant population presented in this blog post. Read this box to learn more.
The United States has long had more immigrants than any other country. In fact, the U.S. is home to one-fifth of the world’s international migrants. These immigrants come from just about every country in the world.
Pew Research Center regularly publishes research on U.S. immigrants. Based on this research, here are answers to some key questions about the U.S. immigrant population.
Updated Jan. 27, 2025, to reflect new Census Bureau estimates affecting the U.S. immigrant population.
Recently released Census Bureau population estimates show that immigrants have been underrepresented in official population estimates used for the 2022 and 2023 American Community Surveys (ACS). According to the bureau’s recent estimates, the U.S. population was larger than the ACS indicated by about 700,000 people in 2022 and almost 2 million, or roughly 0.6%, in 2023. Almost all of the additional people were immigrants, and based on the Census Bureau’s data sources, most would be considered unauthorized immigrants.
The bureau’s new estimates impact our 2022 unauthorized immigrant population estimates shown in this blog post. We are working to update our 2022 estimates and are producing new 2023 estimates consistent with the Census Bureau’s new estimates.
Pew Research Center conducted this analysis to answer common questions about immigration to the United States and the U.S. immigrant population.
Data for 2023 comes from Census Bureau tabulations of the 2023 American Community Survey. The remaining data in this analysis comes mainly from Center tabulations of Census Bureau microdata the American Community Surveys (IPUMS) and historical data from decennial censuses.
This analysis also features estimates of the size of the U.S. unauthorized immigrant population. The estimates presented in this research for 2022 are the Center’s latest. Estimates of annual changes in the foreign-born population are from the Current Population Survey for 1994-2023 and the American Community Surveys for 2001-2022 (IPUMS), with adjustments for changes in the bureau’s survey methodology over time.
How many people in the U.S. are immigrants?
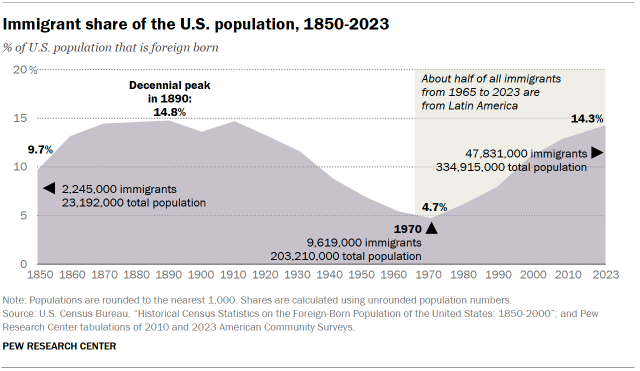
The U.S. foreign-born population reached a record 47.8 million in 2023, an increase of 1.6 million from the previous year. This is the largest annual increase in more than 20 years, since 2000.
In 1970, the number of immigrants living in the U.S. was about a fifth of what it is today. Growth of this population accelerated after Congress made changes to U.S. immigration laws in 1965.
Immigrants today account for 14.3% of the U.S. population, a roughly threefold increase from 4.7% in 1970. The immigrant share of the population today is the highest since 1910 but remains below the record 14.8% in 1890.
(Because only limited data from the 2023 American Community Survey has been released as of mid-September 2024, the rest of this post focuses on data from 2022.)
Where are U.S. immigrants from?
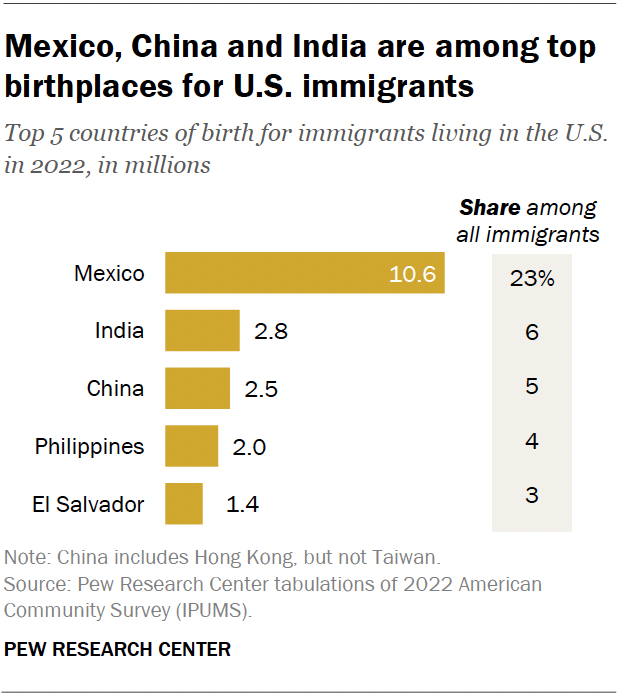
Mexico is the top country of birth for U.S. immigrants. In 2022, roughly 10.6 million immigrants living in the U.S. were born there, making up 23% of all U.S. immigrants. The next largest origin groups were those from India (6%), China (5%), the Philippines (4%) and El Salvador (3%).
By region of birth, immigrants from Asia accounted for 28% of all immigrants. Other regions make up smaller shares:
- Latin America (27%), excluding Mexico but including the Caribbean (10%), Central America (9%) and South America (9%)
- Europe, Canada and other North America (12%)
- Sub-Saharan Africa (5%)
- Middle East and North Africa (4%)
How have immigrants’ origin countries changed in recent decades?
Before 1965, U.S. immigration law favored immigrants from Northern and Western Europe and mostly barred immigration from Asia. The 1965 Immigration and Nationality Act opened up immigration from Asia and Latin America. The Immigration Act of 1990 further increased legal immigration and allowed immigrants from more countries to enter the U.S. legally.
Since 1965, about 72 million immigrants have come to the United States from different and more countries than their predecessors:
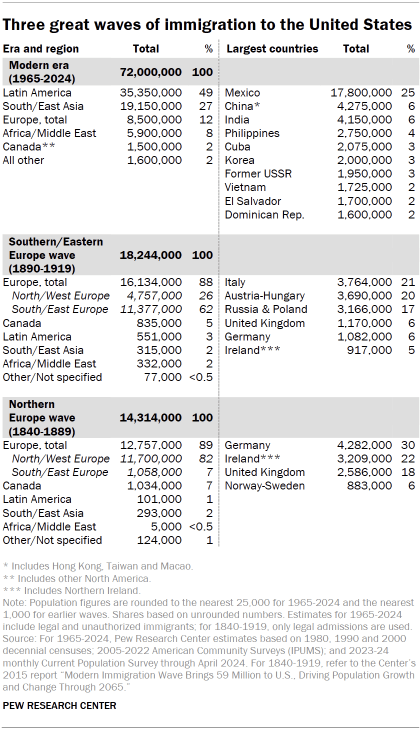
- From 1840 to 1889, about 90% of U.S. immigrants came from Europe, including about 70% from Germany, Ireland and the United Kingdom.
- Almost 90% of the immigrants who arrived from 1890 to 1919 came from Europe. Nearly 60% came from Italy, Austria-Hungary and Russia-Poland.
- Since 1965, about half of U.S. immigrants have come from Latin America, with about a quarter from Mexico alone. About another quarter have come from Asia. Large numbers have come from China, India, the Philippines, Central America and the Caribbean.
The newest wave of immigrants has dramatically changed states’ immigrant populations. In 1980, German immigrants were the largest group in 19 states, Canadian immigrants were the largest in 11 states and Mexicans were the largest in 10 states. By 2000, Mexicans were the largest group in 31 states.
Today, Mexico remains the largest origin country for U.S. immigrants. However, immigration from Mexico has slowed since 2007 and the Mexican-born population in the U.S. has dropped. The Mexican share of the U.S. immigrant population dropped from 29% in 2010 to 23% in 2022.
Where are recent immigrants coming from?
In 2022, Mexico was the top country of birth for immigrants who arrived in the last year, with about 150,000 people. India (about 145,000) and China (about 90,000) were the next largest sources of immigrants. Venezuela, Cuba, Brazil and Canada each had about 50,000 to 60,000 new immigrant arrivals.
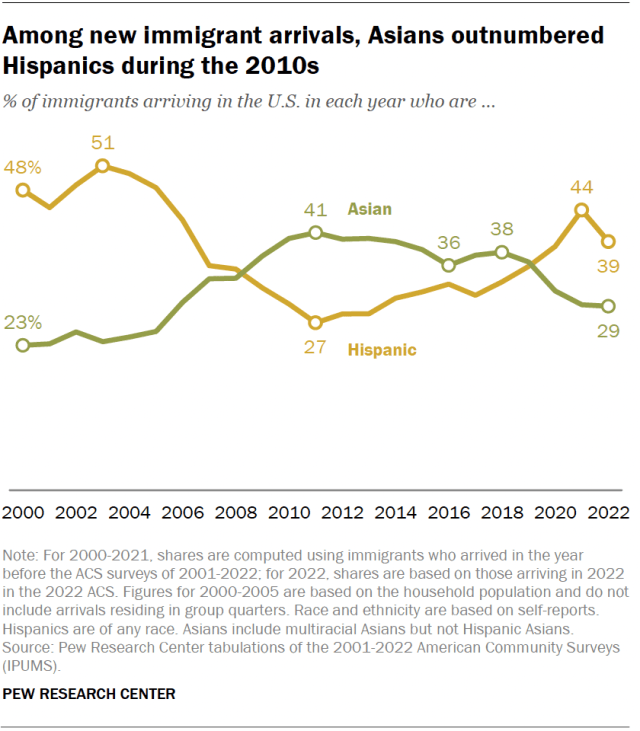
The main sources of immigrants have shifted twice in the 21st century. The first was caused by the Great Recession (2007-2009). Until 2007, more Hispanics than Asians arrived in the U.S. each year. From 2009 to 2018, the opposite was true.
Since 2019, immigration from Latin America – much of it unauthorized – has reversed the pattern again. More Hispanics than Asians have come each year.
What is the legal status of immigrants in the U.S.?
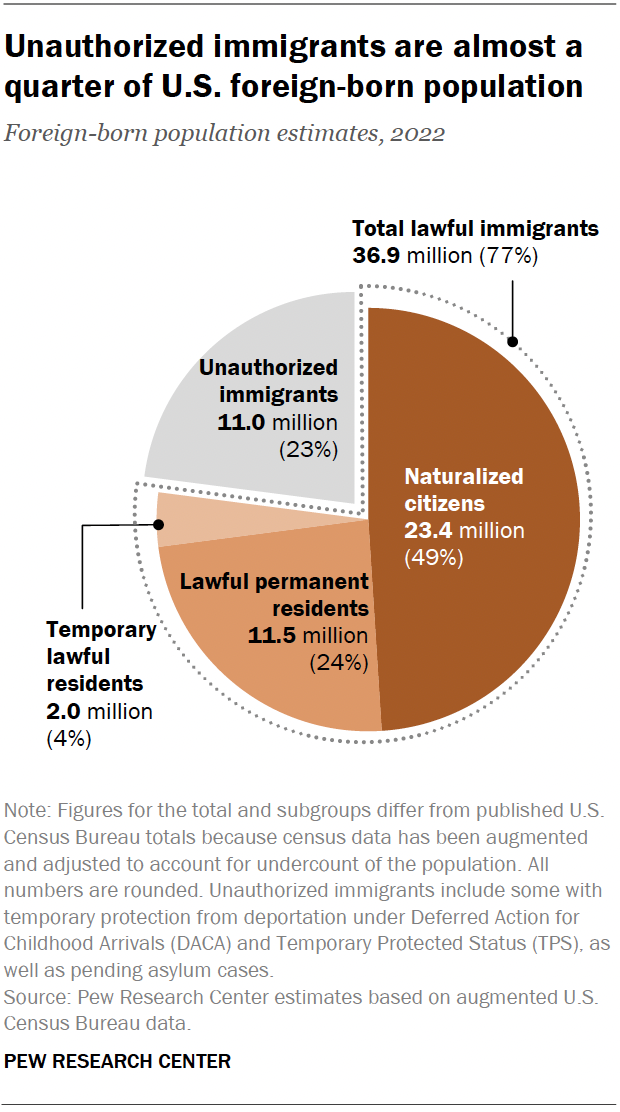
Most immigrants (77%) are in the country legally. As of 2022:
- 49% were naturalized U.S. citizens.
- 24% were lawful permanent residents.
- 4% were legal temporary residents.
- 23% were unauthorized immigrants.
From 1990 to 2007, the unauthorized immigrant population more than tripled in size, from 3.5 million to a record high of 12.2 million. From there, the number slowly declined to about 10.2 million in 2019.
In 2022, the number of unauthorized immigrants in the U.S. showed sustained growth for the first time since 2007, to 11.o million.
As of 2022, about 4 million unauthorized immigrants in the U.S. are Mexican. This is the largest number of any origin country, representing more than one-third of all unauthorized immigrants. However, the Mexican unauthorized immigrant population is down from a peak of almost 7 million in 2007, when Mexicans accounted for 57% of all unauthorized immigrants.
The drop in the number of unauthorized immigrants from Mexico has been partly offset by growth from other parts of the world, especially Asia and other parts of Latin America.
The 2022 estimates of the unauthorized immigrant population are our latest comprehensive estimates. Other partial data sources suggest continued growth in 2023 and 2024.
Who are unauthorized immigrants?
Virtually all unauthorized immigrants living in the U.S. entered the country without legal permission or arrived on a nonpermanent visa and stayed after it expired.
A growing number of unauthorized immigrants have permission to live and work in the U.S. and are temporarily protected from deportation. In 2022, about 3 million unauthorized immigrants had these temporary legal protections. These immigrants fall into several groups:
- Temporary Protected Status (TPS): About 650,000 immigrants have TPS as of July 2022. TPS is offered to individuals who cannot safely return to their home country because of civil unrest, violence, natural disaster or other extraordinary and temporary conditions.
- Deferred Action for Childhood Arrivals program (DACA): Almost 600,000 immigrants are beneficiaries of DACA. This program allows individuals brought to the U.S. as children before 2007 to remain in the U.S.
- Asylum applicants: About 1.6 million immigrants have pending applications for asylum in the U.S. as of mid-2022 because of dangers faced in their home country. These immigrants can stay in the U.S. legally while they wait for a decision on their case.
- Other protections: Several hundred thousand individuals have applied for special visas to become lawful immigrants. These types of visas are offered to victims of trafficking and certain other criminal activities.
In addition, about 500,000 immigrants arrived in the U.S. by the end of 2023 under programs created for Ukrainians (U4U or Uniting for Ukraine) and people from Cuba, Haiti, Nicaragua and Venezuela (CHNV parole). These immigrants mainly arrived too late to be counted in the 2022 estimates but may be included in future estimates.
Do all lawful immigrants choose to become U.S. citizens?
Immigrants who are lawful permanent residents can apply to become U.S. citizens if they meet certain requirements. In fiscal year 2022, almost 1 million lawful immigrants became U.S. citizens through naturalization. This is only slightly below record highs in 1996 and 2008.
Most immigrants eligible for naturalization apply for citizenship, but not all do. Top reasons for not applying include language and personal barriers, lack of interest and not being able to afford it, according to a 2015 Pew Research Center survey.
Where do most U.S. immigrants live?
In 2022, most of the nation’s 46.1 million immigrants lived in four states: California (10.4 million or 23% of the national total), Texas (5.2 million or 11%), Florida (4.8 million or 10%) and New York (4.5 million or 10%).
Most immigrants lived in the South (35%) and West (33%). Another 21% lived in the Northeast and 11% were in the Midwest.
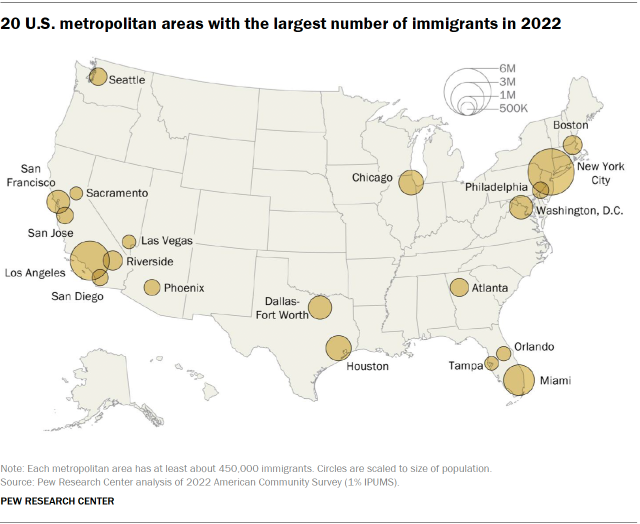
In 2022, more than 29 million immigrants – 63% of the nation’s foreign-born population – lived in just 20 major metropolitan areas. The largest populations were in the New York, Los Angeles and Miami metro areas. Most of the nation’s unauthorized immigrant population (60%) lived in these metro areas as well.
How many immigrants are working in the U.S.?
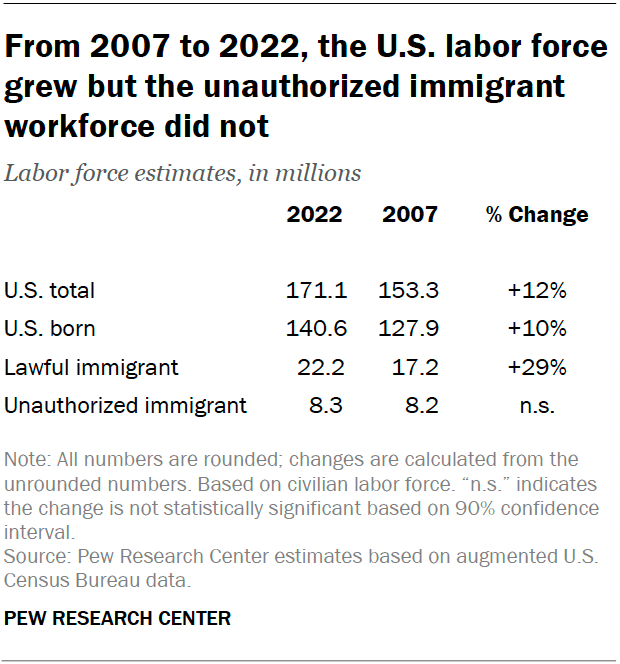
In 2022, over 30 million immigrants were in the U.S. workforce. Lawful immigrants made up the majority of the immigrant workforce, at 22.2 million. An additional 8.3 million immigrant workers are unauthorized. This is a notable increase over 2019 but about the same as in 2007.
The share of workers who are immigrants increased slightly from 17% in 2007 to 18% in 2022. By contrast, the share of immigrant workers who are unauthorized declined from a peak of 5.4% in 2007 to 4.8% in 2022. Immigrants and their children are projected to add about 18 million people of working age between 2015 and 2035. This would offset an expected decline in the working-age population from retiring Baby Boomers.
How educated are immigrants compared with the U.S. population overall?
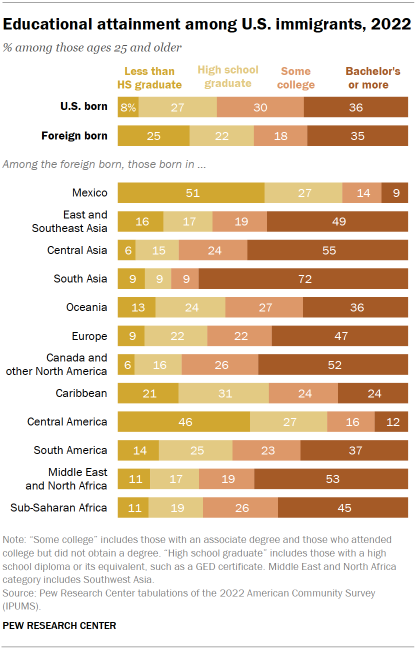
On average, U.S. immigrants have lower levels of education than the U.S.-born population. In 2022, immigrants ages 25 and older were about three times as likely as the U.S. born to have not completed high school (25% vs. 7%). However, immigrants were as likely as the U.S. born to have a bachelor’s degree or more (35% vs. 36%).
Immigrant educational attainment varies by origin. About half of immigrants from Mexico (51%) had not completed high school, and the same was true for 46% of those from Central America and 21% from the Caribbean. Immigrants from these three regions were also less likely than the U.S. born to have a bachelor’s degree or more.
On the other hand, immigrants from all other regions were about as likely as or more likely than the U.S. born to have at least a bachelor’s degree. Immigrants from South Asia (72%) were the most likely to have a bachelor’s degree or more.
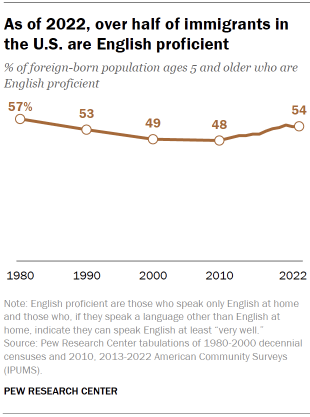
How well do immigrants speak English?
About half of immigrants ages 5 and older (54%) are proficient English speakers – they either speak English very well (37%) or speak only English at home (17%).
Immigrants from Canada (97%), Oceania (82%), sub-Saharan Africa (76%), Europe (75%) and South Asia (73%) have the highest rates of English proficiency.
Immigrants from Mexico (36%) and Central America (35%) have the lowest proficiency rates.
Immigrants who have lived in the U.S. longer are somewhat more likely to be English proficient. Some 45% of immigrants who have lived in the U.S. for five years or less are proficient, compared with 56% of immigrants who have lived in the U.S. for 20 years or more.
Spanish is the most commonly spoken language among U.S. immigrants. About four-in-ten immigrants (41%) speak Spanish at home. Besides Spanish, the top languages immigrants speak at home are English only (17%), Chinese (6%), Filipino/Tagalog (4%), French or Haitian Creole (3%), and Vietnamese (2%).
Note: This is an update of a post originally published May 3, 2017.

