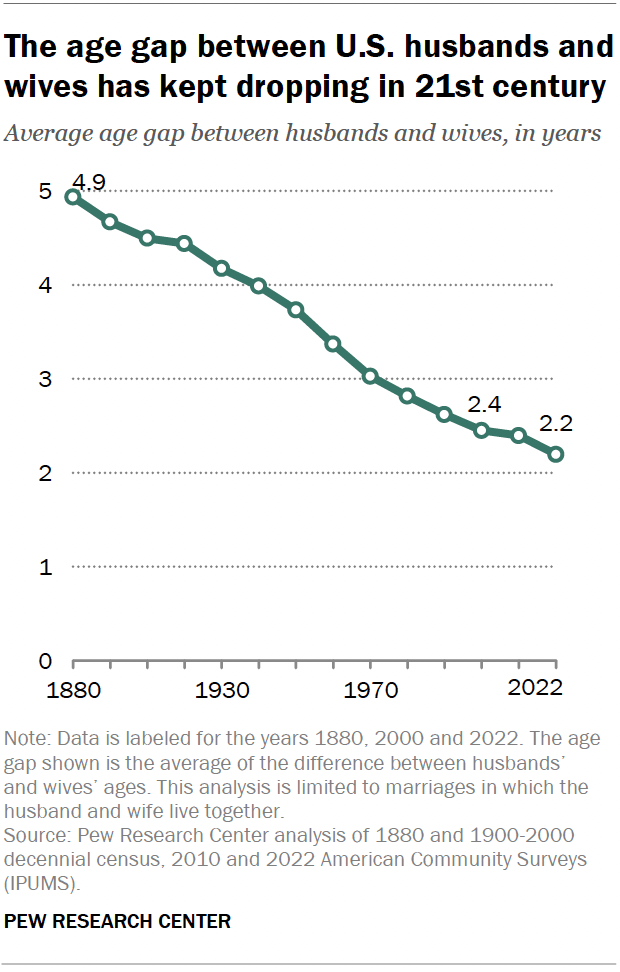
The typical age gap between husbands and wives in the United States has narrowed over the past 20 years, continuing a 20th-century trend. On average, husbands and wives were 2.2 years apart in age in 2022, according to a new Pew Research Center analysis of U.S. Census Bureau data. This is down from 2.4 years in 2000 and 4.9 years in 1880.
Pew Research Center conducted this analysis to look at whether the declining age gap in U.S. opposite-sex marriages in the 20th century has continued into the 21st century.
This analysis uses decennial census data and the American Community Survey (ACS). The ACS is the largest household survey in the U.S., with a sample of more than 3 million addresses. Collected by the U.S. Census Bureau since 2001, it covers the topics previously included in the long form of the decennial census. The ACS is designed to provide estimates of the size and characteristics of the nation’s resident population.
The analysis is limited to opposite-sex marriages in which the spouses live together. Information on the age of both spouses is only available in marriages where spouses reside in the same household. In the 2022 ACS, there were about 680,000 opposite-sex marriages where the spouses reside together.
Over the decades the census has consistently inquired about the respondent’s age. Age is reported as a whole number, thus the age gap difference between spouses is also a whole number.
The microdata files used for this analysis were provided by the Integrated Public Use Microdata Series (IPUMS) from the University of Minnesota. IPUMS standardizes variable names and coding across years as much as possible, making it easier to analyze the data over time. Information on marital status is available from the 1880 census on.

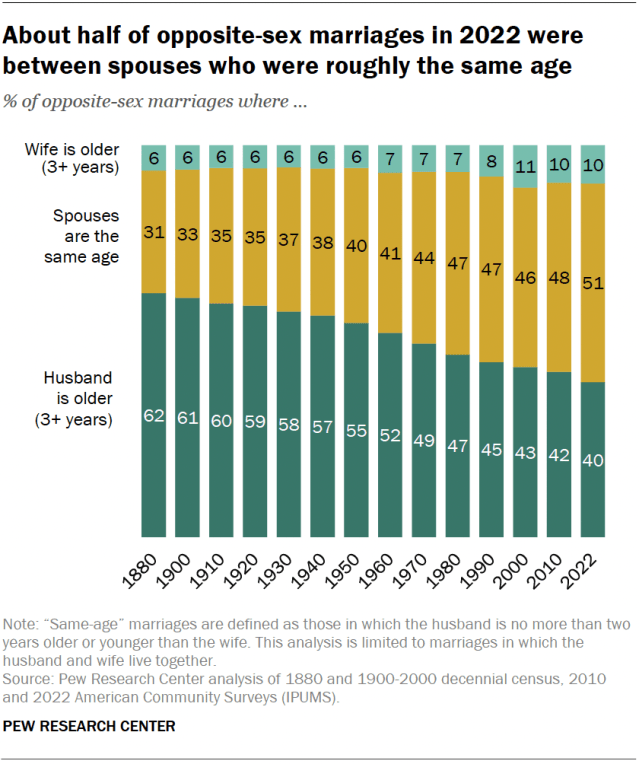
Since 1880, the share of marriages in which the husband is several years older than the wife has fallen significantly. And since 2000, marriages where the wife is significantly older than the husband have also become more rare. (This analysis is limited to opposite-sex marriages in which the spouses live together.)

Overall, in 2022:
- 51% of opposite-sex marriages had spouses who were two years apart in age or less. This is up from 46% in 2000.
- 40% of marriages had a husband who was three or more years older than his wife. This is down from 43% in 2000.
- 10% of marriages had a wife who was three or more years older than her husband. This share had been on the rise during the 20th century but is now down marginally from a peak of 11% in 2000.
Not all family historians agree on how to define a “same-age” marriage. But whether we consider spouses of the same age to be those within two years of each other or four years, the historical trend is similar.
Who is most likely to be in a same-age marriage?
Some people are more likely than others to be in a same-age marriage:
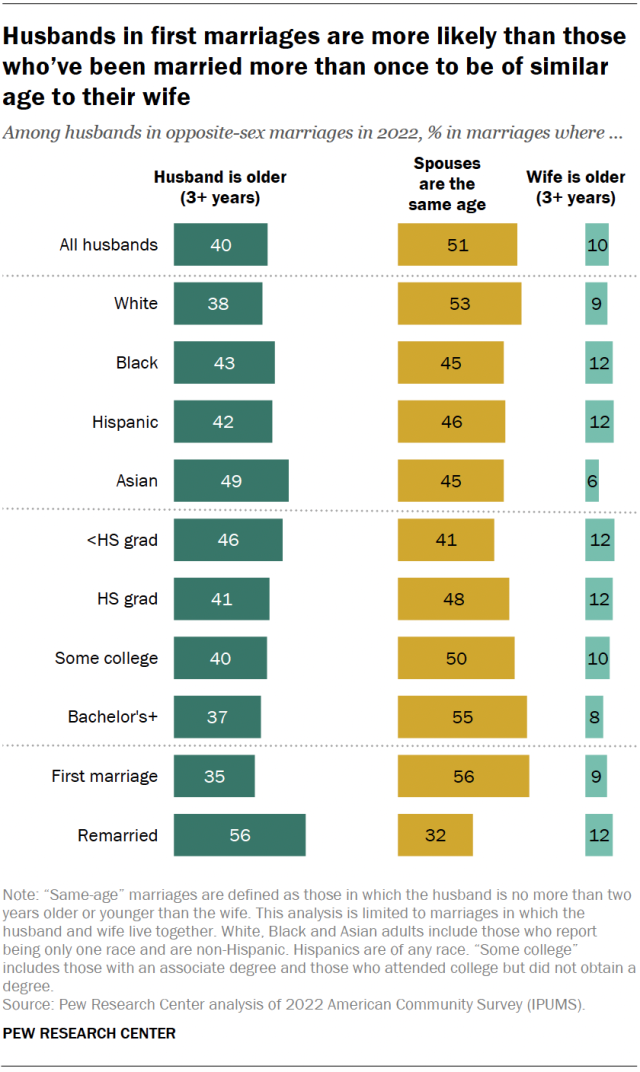
- More than half of husbands who have at least a bachelor’s degree (55%) are in a same-age marriage, compared with 48% of husbands with some college education or less.
- Husbands in their first marriage are much more likely than husbands who have been married more than once to be roughly the same age as their wife (56% vs. 32%). And only 35% of husbands in their first marriage have a wife three or more years younger than them, compared with 56% of remarried husbands.
- White husbands (53%) are more likely than Hispanic (46%), Black (45%) and Asian husbands (45%) to be in a same-age marriage. And about half of Asian husbands (49%) have a wife who is three or more years younger. The shares are lower among Hispanic (42%), Black (43%) and White husbands (38%).
The marriage patterns are similar when looking at the wife’s characteristics rather than the husband’s.
Why do age gaps in marriage matter?

Large age differences between husbands and wives can have important consequences for the well-being of one of the spouses. For example, someone is more likely to end up widowed if their spouse is significantly older than them.
As the share of marriages where the husband is older than his wife has fallen, there’s also been a decline in widowhood among older women. Today, 30% of women ages 65 and older are widows, down from 45% in 2000.
