
The nomination of Howard University graduate Kamala Harris for president has brought new attention to historically Black colleges and universities, or HBCUs, in the United States.
The oldest HBCUs have been in existence for over 150 years, and HBCUs continue to play an important role in the U.S. higher education landscape. As of fall 2022 – the latest semester with available data – there were 99 HBCUs nationwide, and they collectively enrolled just under 290,000 students, according to the National Center for Education Statistics.
As Kamala Harris, a Howard University graduate, campaigns for president, Pew Research Center conducted this analysis to examine the characteristics of historically Black colleges and universities (HBCUs) in the United States.
This analysis primarily uses data from the National Center of Education Statistics (NCES), but it also includes data from the Census Bureau and other sources. Links to each source are available in the text.
NCES categorizes HBCUs based primarily on the definition in the Higher Education Act of 1965, and its count of HBCUs includes only those that remained open and accredited as of fall 2022. The Higher Education Act defines HBCUs as “degree-granting institutions established prior to 1964 with the principal mission of educating Black Americans.” Some federal regulations also allow certain institutions founded since 1964 to count as HBCUs. Degree-granting institutions include only those that participate in Title IV federal financial aid programs.
What are HBCUs?
Congress defines HBCUs as accredited institutions of higher education that were founded before 1964 and have a primary mission to educate Black students. However, not all students who attend HBCUs today are Black.
Prior to the Civil War, higher education opportunities were virtually nonexistent for nearly all Black Americans. A few HBCUs were founded before the Civil War, but many more were established between 1867 and 1900 to provide educational opportunities for Black Americans, including formerly enslaved people.
Some HBCUs arose in response to the Second Morrill Act in 1890, which required states to admit Black Americans to their existing institutions or provide funding for new institutions that would serve them. These HBCUs, along with other institutions founded through similar legislation, are called “land-grant institutions.”
HBCUs can be either public or private institutions. In fact, the 99 HBCUs in existence in 2022 were almost evenly divided between public (50) and private (49) schools. Most HBCUs are four-year institutions that mainly award bachelor’s degrees.
Where are HBCUs located?
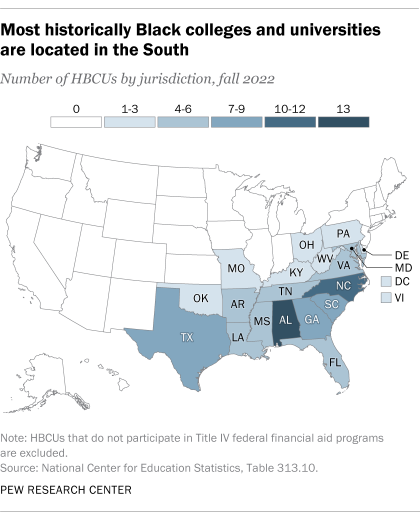
The vast majority of HBCUs are located in the South. Alabama had the most in 2022, with 13, followed by North Carolina with 10. Georgia, Texas, South Carolina, Louisiana, Mississippi and Tennessee each had at least six. But there are also HBCUs as far north as Pennsylvania (Cheyney University of Pennsylvania, Lincoln University) and outside the continental U.S. (University of the Virgin Islands).
How has enrollment at HBCUs changed over time?
Enrollment at HBCUs grew between 1976 and 2010 but has decreased slightly since then. In 1976, the first year with available data, more than 222,000 students of all racial and ethnic backgrounds were enrolled at HBCUs. That number peaked at over 326,000 in 2010. Still, the nearly 290,000 students enrolled in HBCUs in 2022 accounted for a 30% increase from 1976.
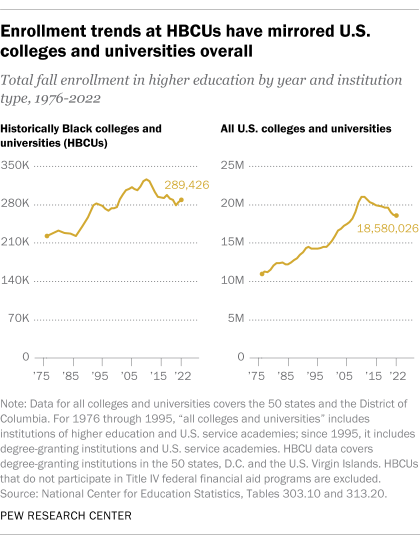
This is similar to the enrollment pattern at all U.S. colleges and universities. About 11 million students were enrolled in college in 1976, and that number peaked at just over 21 million in 2010. In 2022, there were about 18.6 million students enrolled in college – 69% more than in 1976.
However, HBCUs differ from colleges overall in how enrollment has changed among students who are Black and students of other racial or ethnic backgrounds. The share of Black students attending HBCUs declined as desegregation, rising incomes and increased access to financial aid led to more college options for Black Americans.
At HBCUs, enrollment of Black students increased by 15% between 1976 and 2022. That was far lower than the 117% increase in students of other racial or ethnic backgrounds who attend these schools. As a result, the share of students at HBCUs who are Black decreased from 85% to 76%.
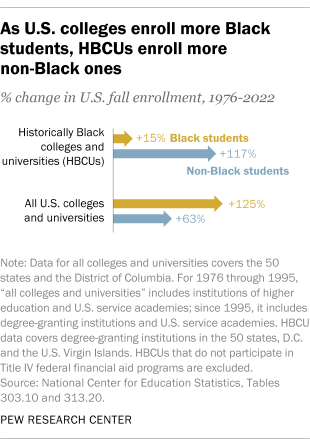
In contrast, enrollment of Black students at all colleges and universities in the U.S. increased by 125% between 1976 and 2022, far outpacing the 63% increase among students of other races or ethnicities. As a result, the share of all college students who are Black increased from 9% to 13%, about in line with the Black share of the U.S. population in 2022.
These changes also mean that a declining share of Black college students are enrolled at HBCUs. While 18% of all Black college students in the U.S. attended HBCUs in 1976, only 9% did in 2022.
Still, HBCUs accounted for 16% of the bachelor’s degrees that Black college students earned in the 2021-22 school year.
These statistics predate the Supreme Court’s 2023 ruling that colleges and universities may not consider race in admissions. Enrollment patterns may change under new admissions policies.
How does enrollment vary among HBCUs?
HBCUs vary widely in size. In 2022, the median-sized HBCU enrolled 1,840 students, but three had more than 12,000 students each: North Carolina A&T in Greensboro; Howard University in Washington, D.C. (Harris’ alma mater); and Saint Philip’s College in San Antonio, Texas. At the other end of the spectrum, 10 HBCUs enrolled fewer than 500 students.
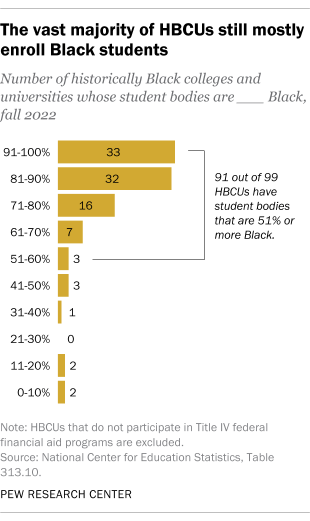
Most HBCUs continue to serve large majorities of Black students. In 2022, more than 80% of the student body was Black at 65 of the 99 HBCUs.
But at eight HBCUs, more than half of the student body was not Black – including Saint Philip’s and West Virginia State University. At each school, just 9% of students were Black. (Saint Philip’s is also considered a Hispanic-serving institution, or HSI, and most of its students were Hispanic in 2022. West Virginia State now serves mainly White students.)
At some HBCUs, low overall enrollment numbers – or growth in non-Black enrollment – may reflect recent challenges for higher education overall. Since 2016, at least 120 colleges and universities across the country have closed, merged with other institutions or announced plans to do so. And the problem may worsen over the next decade because the number of high school graduates is expected to peak in 2025 and then decrease – a phenomenon some have termed the “enrollment cliff.” Some institutions are responding by casting a wider net in student recruitment, which, for some HBCUs, includes recruiting more non-Black students.
What does government funding look like at HBCUs?
HBCUs have long been underfunded compared with other colleges and universities, according to a 2023 analysis by the departments of Education and Agriculture. The analysis found that historically Black land-grant institutions received about $12.6 billion less in state funding than other land-grant institutions between 1987 and 2020. In addition, between 2003 and 2015, private HBCUs experienced the steepest declines in federal funding per student, according to a 2019 report by the American Council on Education.
Note: This is an update of a post originally published on Feb. 28, 2017.

