The Republican Party currently has control of the U.S. House of Representatives, but it has an exceptionally narrow majority – 220 seats versus 212 for the Democrats, with three more seats vacant. That means Democrats need a net gain of just six seats in November’s elections to take control.
That might not seem like a tall order, but in any given election, the vast majority of House districts are won by the party that already holds them. In 2020, for instance, 93% of districts were retained by the same party; only 18 of 435 districts (4%) flipped.
Pew Research Center conducted this analysis to explore changes over time in the party representation of seats in the U.S. House of Representatives.
The analysis was challenging in part because House district lines shift over time – most notably after each decennial census. Districts need to be redrawn after every census to account for population shifts; sometimes they’re also renumbered. That means any given district today may look nothing like it did just a few years ago, even if it’s designated the same or even represented by the same person.
However, before a series of landmark Supreme Court rulings on redistricting in the 1960s, many states were rather erratic in how – or whether – they redrew their congressional maps. For example:
- Arkansas kept the same district lines from 1902 to 1950.
- After Louisiana added an eighth district in 1912, its map didn’t change again until 1966.
- When Missouri legislators couldn’t agree on a new map in time for the 1932 election, they made all 13 congressional seats at-large and deferred drawing new districts until after the next election.
The court’s “one person, one vote” rulings eventually forced all states to redraw their maps at least once a decade. But state maps are frequently challenged for infringing on the rights of particular racial and ethnic groups, and courts can order them to be redrawn mid-decade. (States can also redraw maps mid-decade without a court ruling, as Texas controversially did in 2003.)
We first sought to determine which states had consistent and comparable district maps for the entire period between decennial censuses. Because the U.S. Census Bureau reports its official population figures toward the end of the census year, each of our study periods starts with the general election in a year ending in “2” and ends before the general election in the next year ending in “2” to capture any late-cycle special elections held under the old maps. (Sometimes, special elections to fill vacancies in the final Congress of one study period were held concurrently, or even after, the general election for the first Congress of the next study period. In those instances, results were allocated to the outgoing Congress. In a few cases where special elections weren’t decided until after the November general election, those results were also allocated to the outgoing Congress.)
We began our analysis with the 1922-1932 period because that was the first complete one after the House reached its present size of 435 seats.
To track changes in district lines, we consulted several sources, notably The Historical Atlas of United States Congressional Districts, 1789-1983; a collection of digitized district maps produced by UCLA political scientists that goes up to 2012; and media reports on state redistricting actions up to 2020.
If a state made any changes to its district maps within a given decade, all its districts were dropped from the analysis for that time period. In addition, the entire 1962-1972 period was excluded because 41 states, prompted by the 1960s Supreme Court rulings, redrew their House districts at least once during that span.
For the remaining districts, we looked at the results of every House election – regular and special. If the same party won every election in a given 10-year span, we defined the district as “consistent” Republican or Democratic. If a party won all but one election in the period, we defined the district as “dominant” Republican or Democratic. All remaining analyzed districts were considered “mixed party.”
Our primary source for regular election results was the Election Statistics webpage maintained by the House Clerk’s office. For special-election winners, we consulted the Biographical Directory of the United States Congress.
Has it always been this way? Or was there a time when House districts weren’t firmly in the grip of one party or the other, election cycle after election cycle?
To find out, we examined the outcome of every House election – regularly scheduled ones as well as special elections to fill vacancies – from 1922 to 2020.
House districts are redrawn following each decennial census to reflect population changes, so districts aren’t directly comparable from one census period to another. With that in mind, we analyzed election results in 10-year segments. Each segment includes the five regular House elections held between census years, along with any special elections.
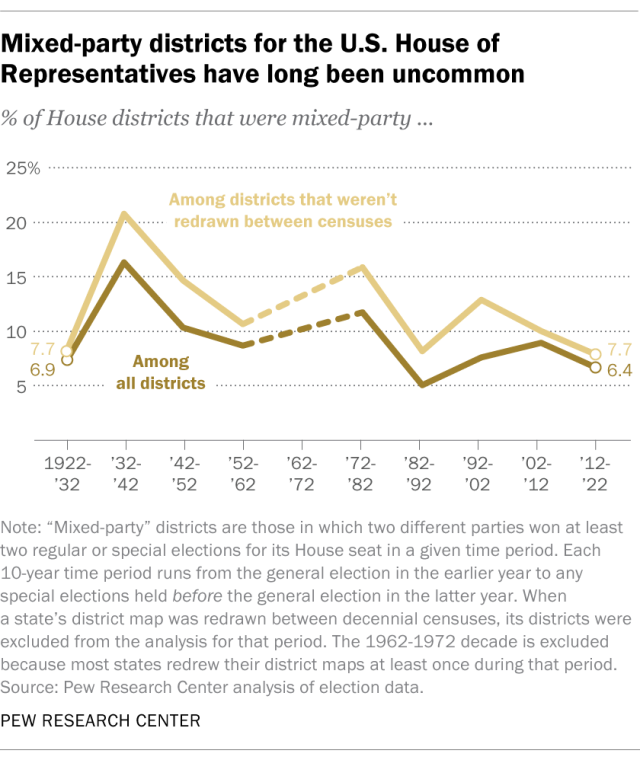
We found that in every 10-year segment, after adjusting for redistricting changes, most districts were consistently won by either Republicans or Democrats.

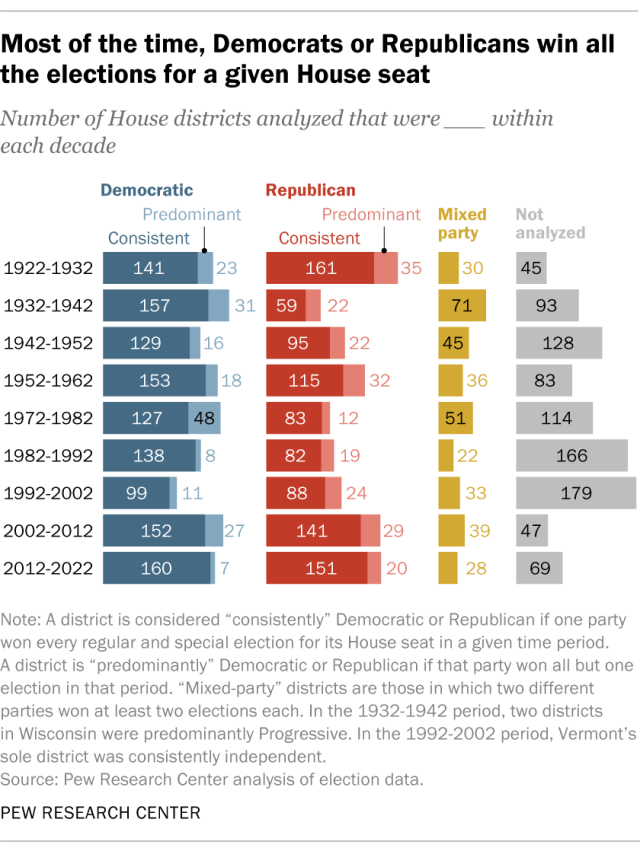
Our analysis begins with the decade following the 1920 census. Between the 1922 general election (for the 68th Congress) and a series of special elections in 1932 for the outgoing 72nd Congress:
- Republicans won every election in 161 House districts (41% of the districts we analyzed in this period) and all but one race in 35 more districts (9%).
- Democrats ran the table in 141 districts (36%) and won all but one election in another 23 (6%).
- Only in 30 districts nationwide did two different parties win at least two elections each.
All told, 302 of the 390 districts we analyzed in that period (77%) were consistently represented by either Republicans or Democrats, and another 58 (15%) were predominantly represented by either Republicans or Democrats. Only 8% were what we’re calling “mixed-party” districts, where no single party predominated. (We excluded 45 other districts in five states because those states redrew their congressional maps mid-decade.)

The high-water mark for mixed-party House districts was the decade following the 1930 census. Between 1932 and 1942, there were 71 mixed-party districts, accounting for 21% of the 342 districts we analyzed. That was the only time across the decades we studied when more than a fifth of analyzed districts were mixed party. (We excluded 93 districts because of mid-decade redistricting.)
On the other hand, there were only 22 mixed-party House districts, or 8%, in the decade following the 1980 census. Another 220 districts were consistently represented by either Republicans or Democrats throughout that decade. (We excluded 166 districts – an unusually large number – because of mid-decade redistricting.)
The most recent complete period we analyzed was the decade after the 2010 census, covering all regular and special House elections from November 2012 to just before November 2022. Excluding 69 districts due to mid-cycle redistricting, the two major parties were almost evenly divided:
- Democrats won every election in 160 districts and every election but one in seven more.
- Republicans won every election in 151 districts and every election but one in another 20.
- Just 28 districts were mixed party.
This year is expected to bring more of the same. Only 40 or so of the 435 House seats are competitive, depending on which political forecast you consult. Most of the rest are considered firmly Republican (about 190) or Democratic (around 175); each party is also considered “likely” but not certain to win 10 to 20 additional seats.
