About half of Americans (49%) say people in their area are driving more dangerously than before the coronavirus pandemic, while only 9% say people are driving more safely, according to a new Pew Research Center survey. What publicly available data there is on the subject suggests that those perceptions may be right, at least in part.
There’s no one definitive data source for how common “dangerous driving” is, or even necessarily agreement on what specific behaviors that involves. Most data on people’s actual (as opposed to self-reported) driving habits comes from encounters with law enforcement – arrests, citations, accident reports and the like. Thus, the resulting data can’t be representative of the entire driving population.
Nonetheless, there’s a fair amount of data indicating that Americans’ driving habits have worsened over the past five years, at least in some ways. Jump to read more about:
- Motor vehicle fatalities
- Distracted driving
- Reckless driving
- Drunk driving and other impairments
- Road rage
To complement Pew Research Center’s recent survey on public views of dangerous driving, we looked for data on dangerous driving behaviors and their consequences from a variety of governmental and independent sources.
We obtained data on overall deaths due to motor vehicle accidents from the Centers for Disease Control and Prevention, which collects cause-of-death data from the death certificates of nearly everyone who dies in the United States each year.
We used data on crash factors, the number and type of crashes, and the number of people killed and injured in different types of crashes from the Fatality and Injury Reporting System Tool of the National Highway Traffic Safety Administration. The agency collects data on all fatal vehicle crashes in the 50 states and the District of Columbia. Data on injury-only and property-damage-only crashes, which are far more numerous, are estimates based on a nationally representative probability sample of all police-reported crashes.
To get at the prevalence of road-rage incidents involving firearms, we turned to the Gun Violence Archive (GVA). GVA is a nonprofit research organization that has been compiling data on incidents of gun violence since 2014. GVA regularly and systematically queries more than 7,500 sources – primarily local news stories, state and local police reports, official press releases and the like. Based on those sources, GVA researchers code each incident with more than 100 descriptive variables.
Motor vehicle fatalities

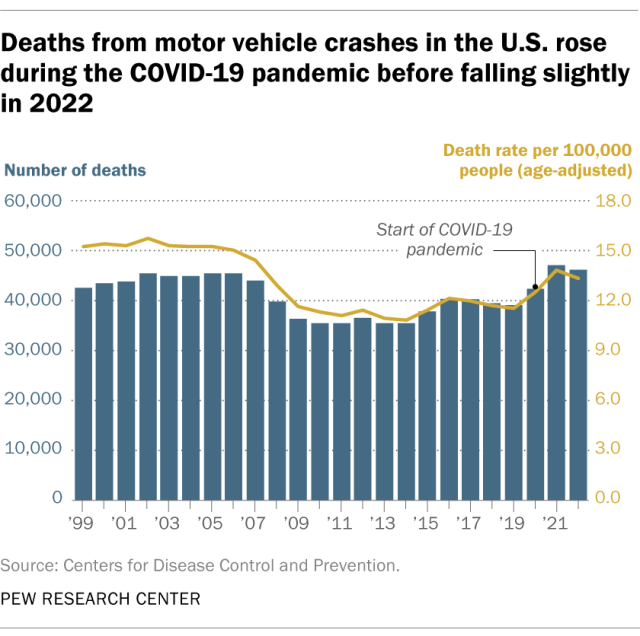
Just over 46,000 people in the United States died in motor vehicle crashes in 2022, according to the most recent data from the Centers for Disease Control and Prevention. That works out to an age-adjusted death rate of 13.3 people per 100,000. The rate was down slightly from 2021 (13.8 per 100,000), but up from the pre-pandemic year of 2019 (11.5 per 100,000). Before the pandemic, the rate had been generally declining since 2002, the year it peaked at 15.7 per 100,000.
Other Pew Research Center studies on driving in the U.S.
Looking at state-level changes between 2019 and 2022, Arizona and New Mexico had the nation’s largest increases in age-adjusted death rates from motor vehicle crashes. Arizona’s rate in 2022 (17.8 per 100,000) was 4.8 percentage points above its 2019 rate. New Mexico’s death rate (23.4 per 100,000) was 4.0 points higher than in 2019.
Distracted driving
Driver distraction was a factor in 11.0% of all traffic crashes in 2022, according to the National Highway Traffic Safety Administration (NHTSA). That was down from 14.6% in 2019.
Distraction was a factor in 7.8% of fatal crashes, 11.9% of injury-only crashes and 10.7% of crashes that caused only property damage. These shares are lower than they were in the years before the COVID-19 pandemic. (Incidentally, property-damage-only crashes are by far the most common sort of traffic crashes – accounting for more than 70% of all crashes in 2022, according to NHTSA estimates. Fatal crashes, by contrast, accounted for fewer than 1% of all crashes that year.)
The absolute number of distraction-related fatal crashes has landed somewhere between 2,600 and 3,300 every year since at least 2010. However, the estimated number of distraction-related injury and property damage crashes fell sharply during the coronavirus pandemic – down 31% and 35%, respectively, between 2019 and 2022.

Pew Research Center’s new survey finds particular public concern about drivers being distracted by cellphones, with 78% of Americans calling it a major problem in their local community.
Related: Many Americans perceive a rise in dangerous driving; 78% see cellphone distraction as major problem
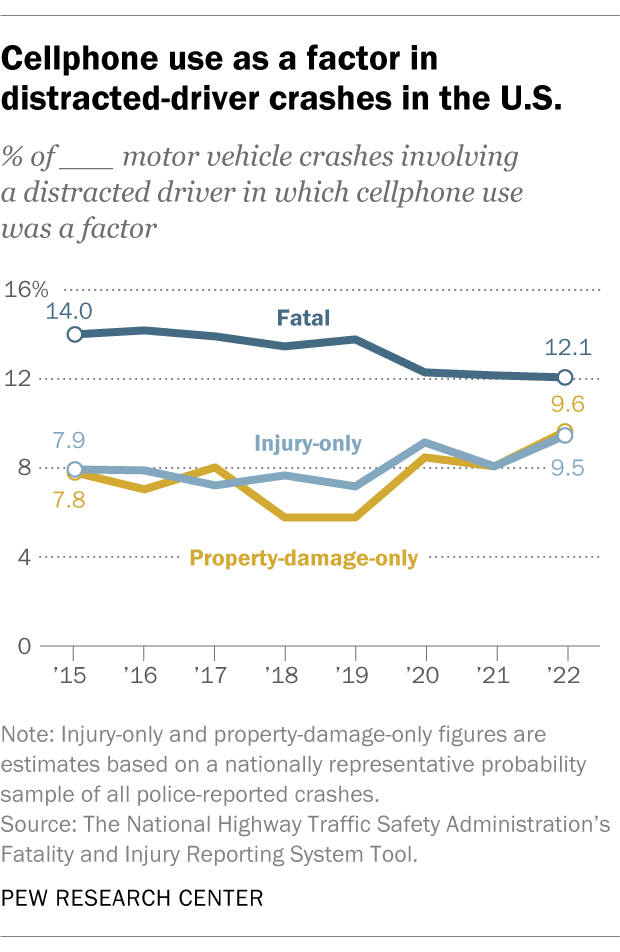
NHTSA data shows that cellphone use was a factor in 12.1% of distraction-related fatal crashes in 2022, down from 13.8% in 2019 and 14.2% in 2016. Cellphone use played a role in 9.5% of distraction-related injury crashes (up from 7.2% in 2019), and 9.6% of distraction-related property damage crashes (up from 5.8% in 2019).
Reckless driving
The term “reckless driving” can cover many behaviors that endanger others, from tailgating and improper lane changing to speeding, brake checking and leaving the scene of an accident before law enforcement and/or medical personnel get there. The National Highway Traffic Safety Administration has data on some, but not all, of those behaviors as they relate to crashes.

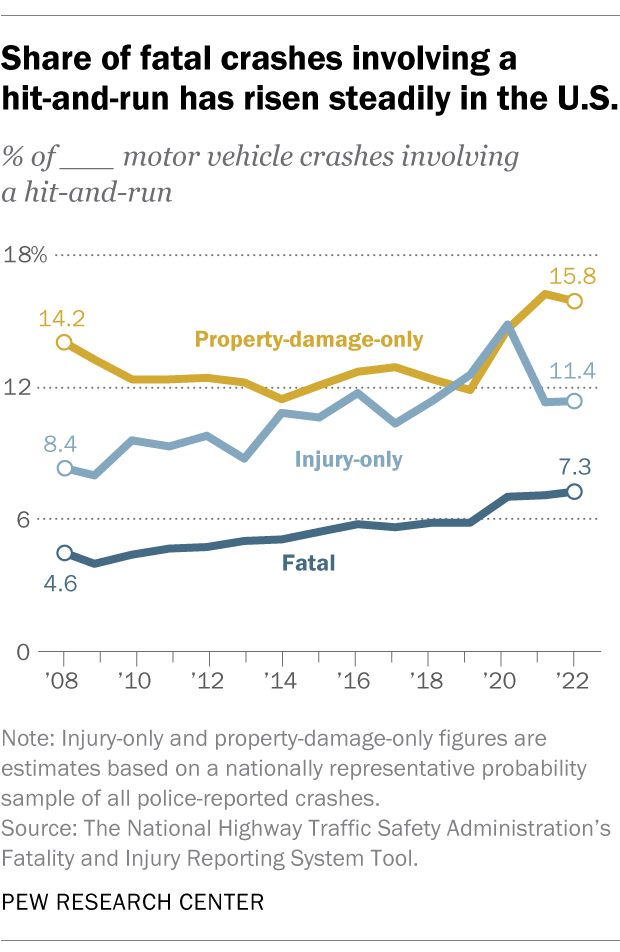
In 2022, for instance, 14.5% of all crashes involved a hit-and-run driver, up from 12.1% in the pre-pandemic year of 2019. The hit-and-run share actually edged lower for injury-only crashes: 11.4% in 2022, versus 12.6% in 2019. But it was higher for both fatal crashes (7.3% vs. 5.9%) and property-damage-only crashes (15.8% vs. 11.9%).
Speeding is much more likely to be a factor in fatal crashes than other types of motor vehicle accidents. In 2022, more than a quarter of fatal crashes (27.8%) involved speeding – up 2 points from 2019, though down from 28.6% in 2020, the highest share since 2013.
By contrast, speeding was a factor in only about 8% of property-damage-only crashes, down slightly from 2019 (and less than half the share in 2009). It was a factor in 12.0% of injury-only crashes, versus 11.5% in 2019 and far below the 21.4% measured in 2009.
In 2022, only 4.9% of drivers involved in fatal crashes were charged with what NHTSA terms “reckless/careless/hit-and-run” offenses – a share that has changed little since 2010.
Drunk driving and other impairments
About three-in-ten fatal crashes in 2022 (31.3%) involved at least one driver who was legally considered alcohol impaired – i.e., their blood alcohol content was 0.08% or greater. That was up from 27.7% in 2019, reversing a decade-long downward trend.
In 2022, 13,524 people were killed in crashes involving a driver who was legally alcohol impaired, a 32.6% increase over 2019. Deaths from drunk driving represented 31.8% of all crash fatalities in 2022, the highest share since at least 2008.
Many of the people killed in impairment-related crashes are the drivers themselves, meaning they never face legal consequences for their actions. Nonetheless, in 2022, 1,563 drivers who survived fatal crashes were charged with driving while intoxicated, while under the influence, or with related offenses. That was an 18.7% increase over 2019.
Road rage
The National Highway Traffic Safety Administration defines road rage as “an intentional assault by a driver or passenger with a motor vehicle or a weapon that occurs on the roadway or is precipitated by an incident on the roadway.” Only a few states – most recently Utah – have passed laws specifically defining and punishing road rage. If cases are prosecuted at all, they tend to fall under broader assault or homicide laws. That makes finding data on road rage incidents particularly challenging.

One source with some insight is the Gun Violence Archive (GVA), a nonprofit research organization that tries to compile information on every incident of gun violence in the nation. We used GVA’s searchable database to get data on all reported incidents since 2015 in which road rage was listed as a factor. (Of course, GVA’s database only includes road rage incidents where guns were involved somehow, so keep that in mind.)
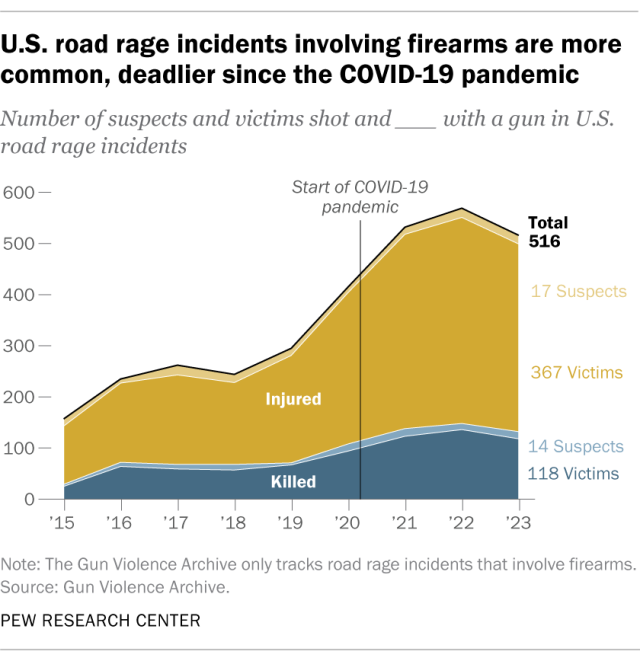
The number of reported road rage incidents involving guns – including those in which guns were only brandished and in which shots were fired but no one was hit – peaked in 2019 at 692, according to GVA data. But the number of people killed or injured in such incidents jumped in 2020 and following years. The toll peaked in 2022, at 148 people killed and 421 injured, before ebbing a bit last year.
As of October 2024, according to GVA data, 116 people have been killed in road rage incidents involving guns this year, versus 109 through the first 10 months of 2023. Injuries in these incidents, though, are running a bit lower – 302 through October, compared with 320 in the same period last year.
