Just a few weeks after a divisive presidential election, millions of Americans will break bread together for Thanksgiving. A new Pew Research Center survey shows how Americans plan to spend the holiday this year – and which Turkey Day traditions and activities are more common than others.
This Pew Research Center analysis examines how Americans plan to celebrate Thanksgiving this year. It is based on a survey conducted Nov. 12-17, 2024, among 9,609 U.S. adults.
Everyone who took part in the survey is a member of the Center’s American Trends Panel (ATP), a group of people recruited through national, random sampling of residential addresses who have agreed to take surveys regularly. This kind of recruitment gives nearly all U.S. adults a chance of selection. Surveys were conducted either online or by telephone with a live interviewer. The survey is weighted to be representative of the U.S. adult population by gender, race, ethnicity, partisan affiliation, education and other factors. Read more about the ATP’s methodology.
Here are the questions used for this analysis, the topline and the survey methodology.
Here are the main takeaways from the survey, conducted Nov. 12-17, 2024, among 9,609 U.S. adults:
Around nine-in-ten Americans (91%) celebrate Thanksgiving. Large majorities in all major demographic groups observe the holiday, though some people are more likely than others to do so. For example, 96% of Americans ages 65 and older celebrate Thanksgiving, compared with somewhat smaller shares of younger adults.
Immigration status also plays a role. While 93% of adults born in the United States celebrate Thanksgiving, the same is true of 88% of immigrants who have been in the country for more than 20 years, 76% of immigrants who have been in the country 11 to 20 years, and 74% of immigrants who have been in the country for a decade or less.
Most Americans (74%) plan to have Thanksgiving dinner with other people this year. Another 5% plan to have Thanksgiving dinner alone, 2% don’t plan to have Thanksgiving dinner – whether it’s because they are working or traveling or for some other reason – and 10% didn’t know their plans yet at the time of the survey. The rest don’t celebrate Thanksgiving.
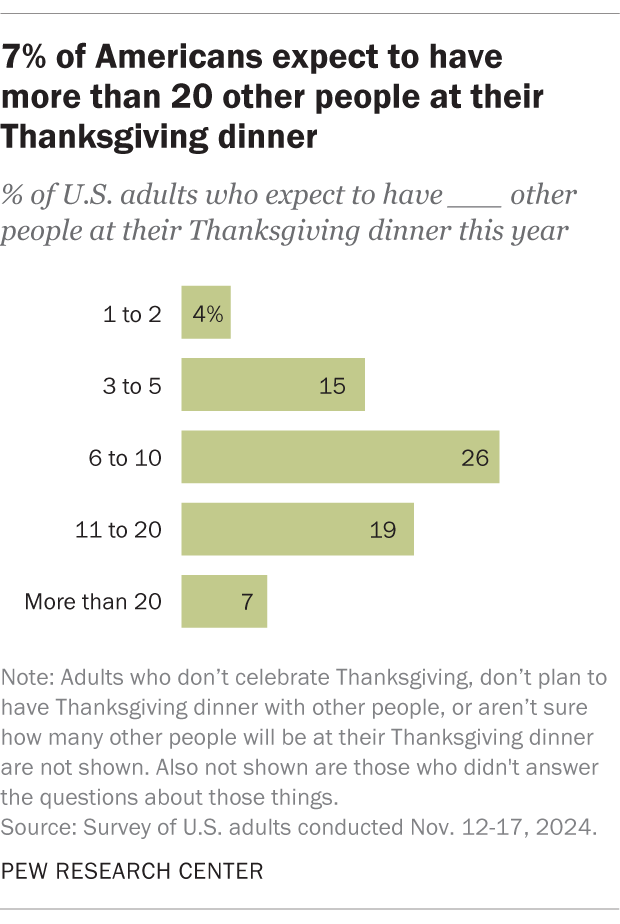
For some Americans, Thanksgiving dinner includes lots of other people. Around a quarter (26%) expect to have Thanksgiving dinner with more than 10 other people this year, including 7% who expect to have it with more than 20 others.
Smaller get-togethers are more common: 26% of Americans plan to have dinner with six to 10 other people, 15% with three to five other people, and 4% with one to two other people. The remaining Americans plan to have Thanksgiving dinner alone, don’t plan to have Thanksgiving dinner, didn’t know their plans yet or don’t celebrate Thanksgiving.
Around a third of Americans (34%) plan to have Thanksgiving dinner at their own home this year, whether hosting others or dining alone. Another 39% plan to go to someone else’s home, while 3% plan to go to a restaurant, hotel or other public place. The rest plan not to have Thanksgiving dinner, didn’t know their plans yet or don’t celebrate the holiday.
Older adults are more likely than younger people to have Thanksgiving dinner at their own home: 40% of Americans ages 50 and older plan to do so this year, compared with 29% of adults under 50.
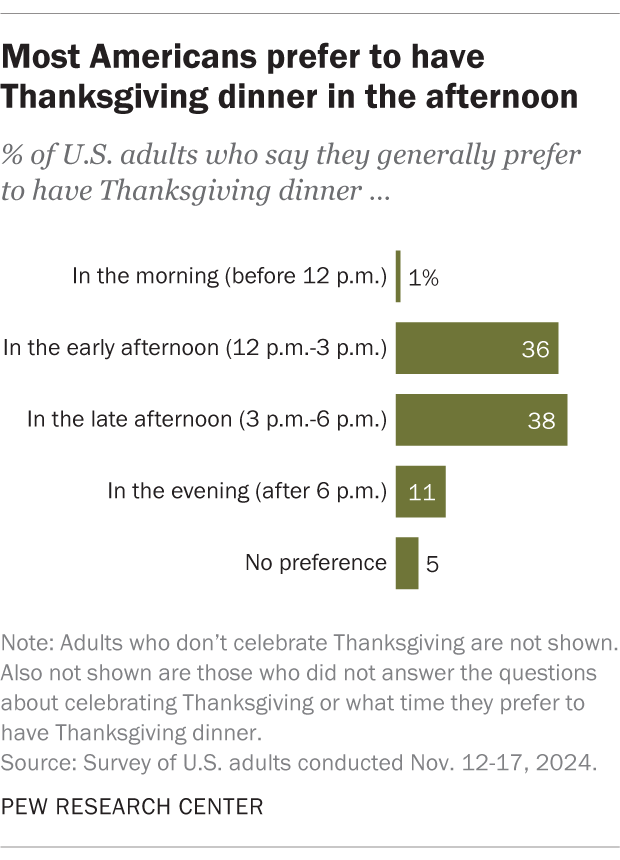
Afternoon is the most popular time for Thanksgiving dinner, but there’s no consensus on early versus late afternoon. Some 36% of Americans prefer to have Thanksgiving dinner in the early afternoon (that is, between noon and 3 p.m.), while 38% prefer to have it in the late afternoon (between 3 and 6 p.m.). Only 11% of Americans prefer to have Thanksgiving dinner in the evening (after 6), and just 1% prefer to have it in the morning (before noon). Another 5% have no preference.
Dinnertime preferences follow a regional pattern. Americans who live in the Midwest and South are more likely to prefer Thanksgiving dinner in the early afternoon than the late afternoon. But people in the Northeast and West are more likely to prefer the late afternoon than the early afternoon.
There are also differences by age. Americans 65 and older are more likely to prefer Thanksgiving dinner earlier in the afternoon than later. Meanwhile, adults under 30 are more likely to prefer late afternoon over early afternoon.
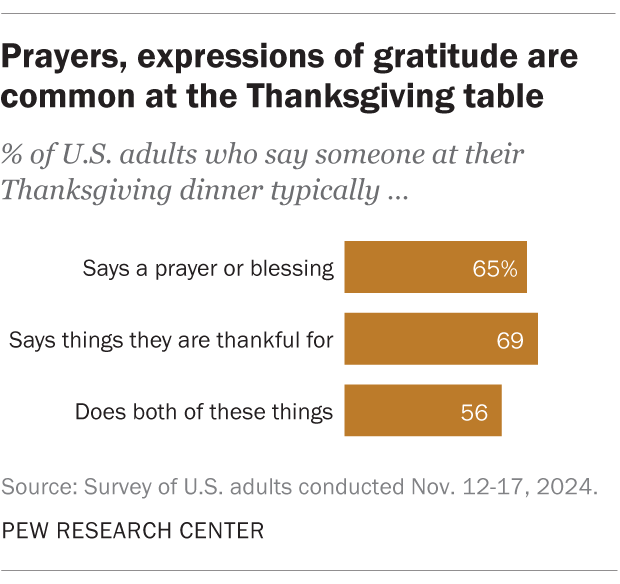
It’s common for Americans to say grace or express gratitude at Thanksgiving dinner. Around two-thirds of U.S. adults say someone at their dinner typically says a prayer or blessing (65%) or says things they are thankful for (69%). And a majority of Americans (56%) say someone at their Thanksgiving dinner typically does both of these things.
Saying grace at Thanksgiving is especially common among certain religious groups. For example, 91% of White evangelical Protestants say someone at their Thanksgiving dinner typically says a prayer or blessing. The same is true for 88% of Black Protestants, 74% of Catholics and 72% of White nonevangelical Protestants. Prayer is much less common among those who say their religion is “nothing in particular” (45%), agnostics (39%), atheists (22%) and Jewish adults (22%).
Majorities across religious groups also say someone at their Thanksgiving dinner typically expresses gratitude. Many religiously unaffiliated Americans say this, too: 59% of those whose religion is “nothing in particular,” along with 61% of agnostics and 48% of atheists, say someone at their dinner typically says things they are thankful for.
Driving and Thanksgiving go hand in hand. The vast majority of Americans who plan to have Thanksgiving dinner away from home this year (89%) say driving is the main way they’ll get there. This works out to 38% of U.S. adults overall who expect to drive to their destination.
Only 2% of Americans overall expect to fly, while even fewer expect to take some other form of transportation, such as local or regional transit.
Related: Many Americans perceive a rise in dangerous driving; 78% see cellphone distraction as major problem
Most Thanksgiving travel takes less than an hour. A majority of those who plan to have Thanksgiving dinner away from home this year (69%) expect their trip to take less than an hour. That may have to do with the proximity of their family members: In a 2022 Pew Research Center survey, 55% of Americans said they live within an hour’s drive of at least some of their extended family.
Looking at adults overall, 29% expect their Thanksgiving travel to take less than an hour. Another 13% expect it to take longer than that, including 6% who expect it to take three hours or more.
Related: For Thanksgiving, 6 facts about Americans and family
Apart from eating, Americans expect to do a wide range of things this Thanksgiving. Certain long-running Thanksgiving traditions, like watching football or a parade, are still fairly popular: 35% of Americans say it’s extremely or very likely that they’ll watch sports on Thanksgiving, and 19% say the same about watching a parade. Men are more likely than women to say they’ll watch sports, while women are more likely than men to say they’ll watch a parade.
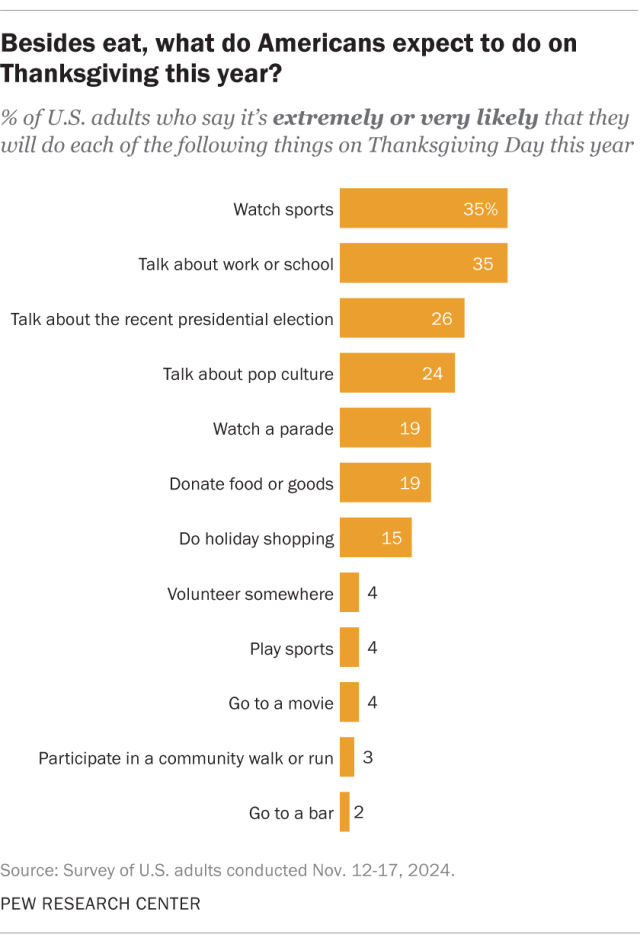
When it comes to conversation, 35% of Americans say it’s extremely or very likely that they’ll talk about work or school on Thanksgiving. And in the wake of a presidential election that saw more than 154 million Americans cast ballots, 26% expect the election to come up. A similar share (24%) expect to talk about pop culture like music or movies, though far fewer (4%) expect to go to a movie.
Thanksgiving is a time for charity for many Americans, and 19% say it’s extremely or very likely that they’ll donate food or goods, while 4% expect to volunteer somewhere.
Thanksgiving is also the unofficial start of the holiday shopping season. Accordingly, 15% of Americans say it’s extremely or very likely that they’ll shop for the holidays on Thanksgiving Day this year.
Getting some exercise on Thanksgiving is a less popular idea: Only 4% of adults say it’s extremely or very likely that they’ll play sports, while 3% expect to participate in a community walk or run, like a turkey trot.
Following Donald Trump’s reelection on Nov. 5, Trump voters are more likely than Kamala Harris voters to say they’ll talk about the presidential election this Thanksgiving. Some 36% of Americans who voted for Trump say it’s extremely or very likely that they’ll talk about the election on Thanksgiving. A smaller share of Americans who voted for Harris (24%) say the same.
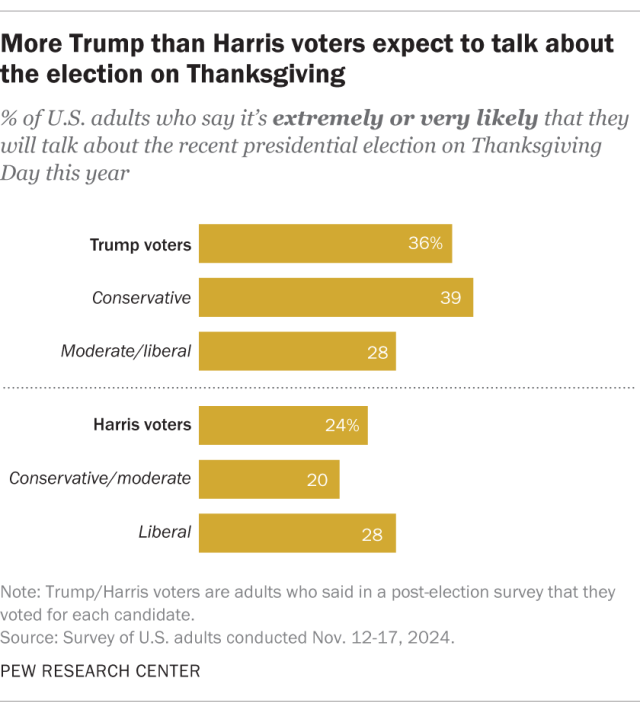
Trump voters who identify as conservative are the most likely to talk about the election: 39% say it’s extremely or very likely that they’ll do so on Thanksgiving, compared with 28% of Trump voters who identify as moderate or liberal. Among Harris voters, 28% of self-described liberals expect to talk about the election at Thanksgiving, compared with 20% of those who identify as conservative or moderate.
In fact, conservative Trump voters are about as likely to talk about the election this Thanksgiving as they are to talk about work or school (36%) – and much more likely to talk about it than to talk about pop culture (17%). By comparison, liberal Harris voters are more likely to talk about work or school (42%) and pop culture (38%) than the election.
Note: Here are the questions used for this analysis, the topline and the survey methodology.

