
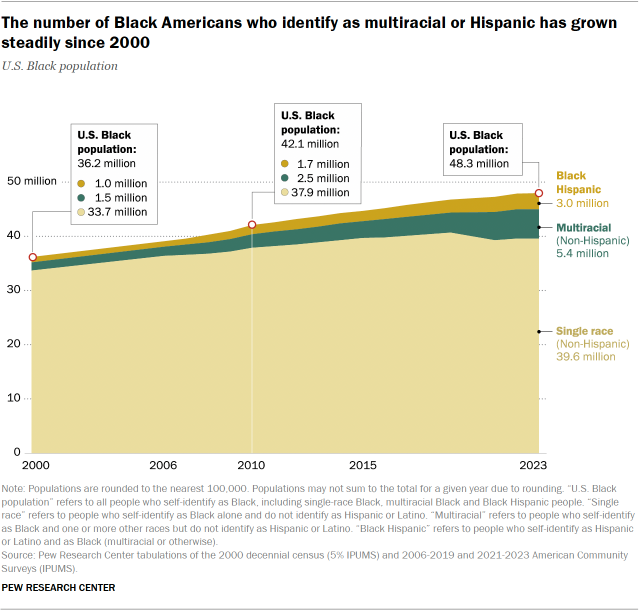
The number of Black people living in the United States reached a new high of 48.3 million in 2023. That’s up a third (33%) since 2000, according to a Pew Research Center analysis of government data. This group is diverse, with an increasing number who say they are of two or more races.
For Black History Month, here are key facts about the nation’s Black population. In this analysis, the population includes three main groups: single-race, non-Hispanic Black people; non-Hispanic, multiracial Black people; and Black Hispanics. (The Black Hispanic population is not the same as the Afro-Latino population.) You can also read our updated fact sheet about Black Americans.
This analysis, conducted ahead of Black History Month, is based on Pew Research Center tabulations of microdata from the Census Bureau’s 2023 American Community Survey (ACS), provided through IPUMS from the University of Minnesota. The analysis identifies the nation’s Black population through self-reports of racial and ethnic identity on the 2023 ACS. The Black population includes single-race non-Hispanic Black people, multiracial non-Hispanic Black people and Black Hispanics.
All displayed numbers are rounded. Shares and percent changes are calculated using unrounded numbers.
The racial and ethnic categories used in census data have changed over time – including question wording, format and instructions – and may affect how people identify by race and ethnicity. Refer to “What Census Calls Us” for more details on how U.S. racial and ethnic categories have changed since 1790. Moreover, respondents’ perceptions of the questions and their own identity can change in response to individual circumstances and the way the nation sees race and itself. Starting in 2000, Americans could select more than one racial category in census forms. Before that, many multiracial people were counted in only one category.
Analyses of spouses’ race and ethnicity can only be done for spouses residing in the same household; that is, the spouse does not have a separate official residence, is not stationed away from home with the military, is not institutionalized, etc. For married Black adults, 91% reside with their spouse.
Note about total population estimates: A recent publication by the Census Bureau shows that immigrants are underrepresented in official population estimates used for the 2023 ACS. According to the bureau’s new estimates, the U.S. population was larger than indicated by the 2023 ACS by about 2 million people, or roughly 0.6%. Almost all of the additional people were immigrants. In this blog post, we report data on the Black population – which includes data on immigrants – using the 2023 ACS. Readers should be aware that the population figures shown in this report are slightly smaller than those indicated by the new Census Bureau estimates. We are evaluating the impact of the bureau’s new population estimates on our reports about U.S. populations.
U.S. Black population or total Black population refers to the population of Americans who self-identify as Black in the United States. This includes those who say their race is only Black and that they are not Hispanic; those who say Black is one of two or more races in their identity and they are not Hispanic; and those who say they are either Black alone or in combination with other races and Hispanic or Latino. The terms Black population and Black people are used interchangeably.
Adults refers to those who are ages 18 and older.
The terms single-race, non-Hispanic Black and single-race Black are used interchangeably to refer to individuals who self-identify only as Black and do not identify as Hispanic or Latino.
The terms multiracial, non-Hispanic Black and multiracial Black refer to people who self-identify as two or more races and not as Hispanic or Latino.
The term Black Hispanic refers to those who self-identify as Hispanic or Latino and as Black, either alone or in combination with other races. This group is not the same as the Afro-Latino population, as not all Black Hispanics identify as Afro-Latino and not all Afro-Latinos identify as Black or Hispanic.
The Black population in the U.S. has grown by a third since 2000, from 36.2 million then to 48.3 million in 2023. Notably, the number of people who identify as another race in addition to Black has increased 269%, and the number who say they are Hispanic has risen by 210%. This increase in racial diversity among Black Americans reflects a broader national shift in the number of Americans identifying as multiracial. At the same time, the arrival of new immigrants from Africa, the Caribbean and elsewhere has been an important contributor to Black population growth. (Read the cautionary note in “How we did this” about total and immigrant population estimates.)
The Black population has grown fastest in states that historically have not had many Black residents. Utah experienced the fastest growth in its Black population between 2010 and 2023, with an increase of 89%. The Black populations of Arizona, Nevada and Minnesota each increased by 60% during that span, the next-fastest growth rates among states with Black populations of at least 25,000 in 2010.
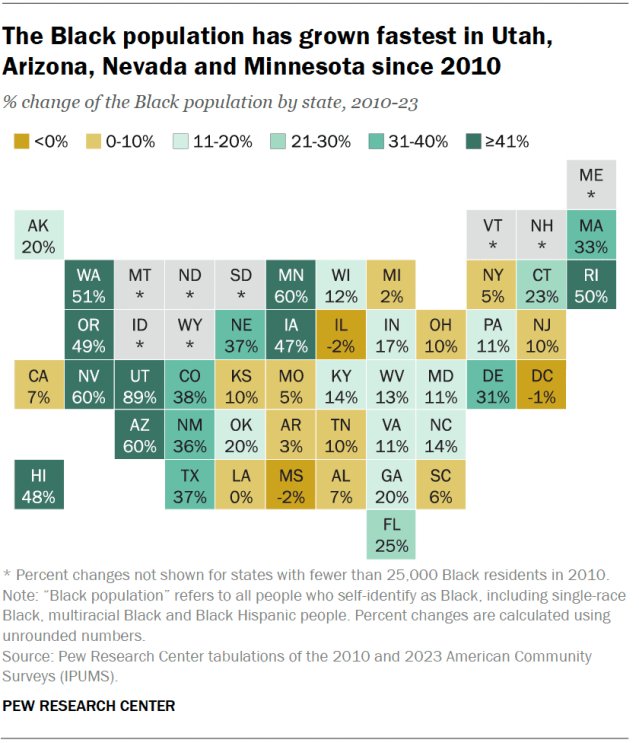
The states that experienced the largest numerical increases in Black residents between 2010 and 2023 are also those with the largest Black populations overall: Texas (up 1.2 million), Florida (up 800,000) and Georgia (up 610,000). The Black population in each of these states has surpassed that of New York, which had the largest in 2010.
Meanwhile, the Black population declined in Mississippi (-2%), Illinois (-2%) and the District of Columbia (-1%) between 2010 and 2023.
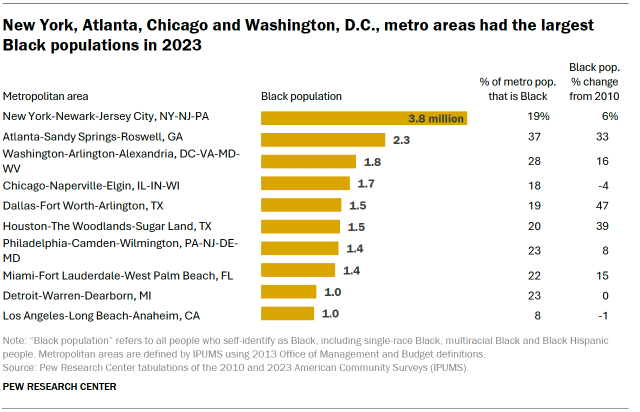
The New York City metropolitan area had more Black residents than any other metro area in 2023. About 3.8 million Black Americans lived in the New York metro area that year. Metro areas with the next largest Black populations include Atlanta (2.3 million), Washington, D.C., (1.8 million) and Chicago (1.7 million).
As a share of the population, the Atlanta area had a higher percentage of Black residents than any other metro area with at least 1 million Black residents. Nearly four-in-ten Atlanta residents (37%) were Black. The metro areas with the next-highest shares of Black residents are Washington, D.C., (28%) Philadelphia (23%) and Detroit (23%).
Between 2010 and 2023, Dallas had the largest percentage increase in Black residents, at 47%. On the other hand, Detroit (0%) and Los Angeles (-1%) had no growth. And although the Black population declined within the District of Columbia, it grew by 3% in Washington’s larger metro area.
The Black population of the U.S. is relatively young. In 2023, the median age of Black Americans was 32.6 years, meaning half of the nation’s Black population was younger than that and half was older. By comparison, the median age of Americans who don’t identify as Black was 39.2. And 27% of all Black Americans are under age 18, a higher share than among non-Black Americans (21%).
Looking at various groups of Black Americans, the median age in 2023 was:
- Single-race, non-Hispanic: 35.4 years
- Hispanic: 21.7
- Multiracial, non-Hispanic: 19.5
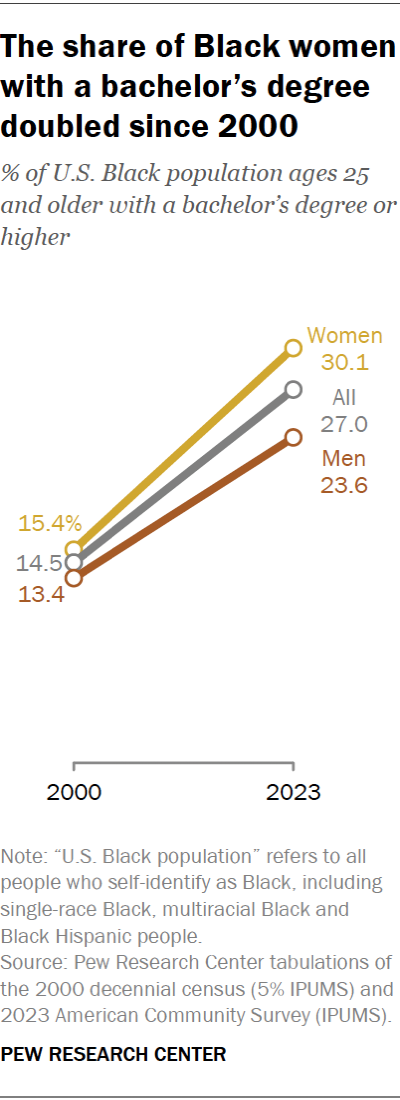
Educational attainment among Black Americans continues to rise. In 2023, 27% of Black adults ages 25 and older – 8.2 million people – had earned at least a bachelor’s degree. That was up from 14.5% in 2000.
Growing shares of Black women and men alike have earned at least a bachelor’s degree. But Black women have made greater gains.
- In 2023, 30.1% of Black women ages 25 and older had earned at least a bachelor’s degree, about double the share in 2000 (15.4%).
- 23.6% of Black men in the same age range had earned at least a bachelor’s degree in 2023, up from 13.4% in 2000.
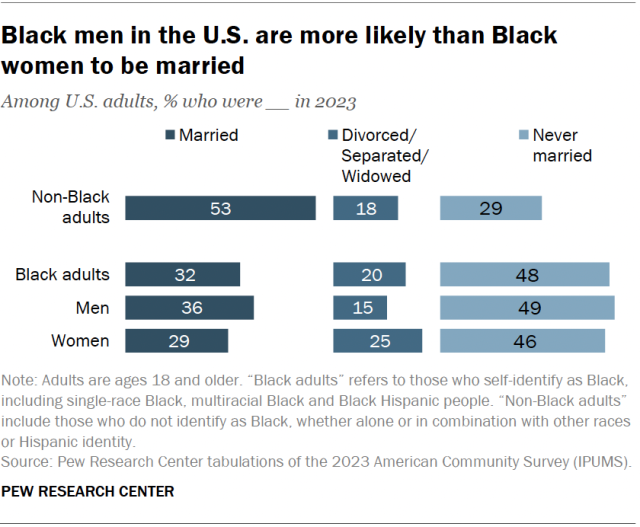
Black Americans are less likely than other Americans to be married. About half of Black adults (48%) have never been married, compared with 29% of non-Black adults.
Black men in 2023 were more likely than Black women to be married (36% vs. 29%). In turn, Black women were more likely than Black men to be divorced, separated or widowed (25% vs. 15%).
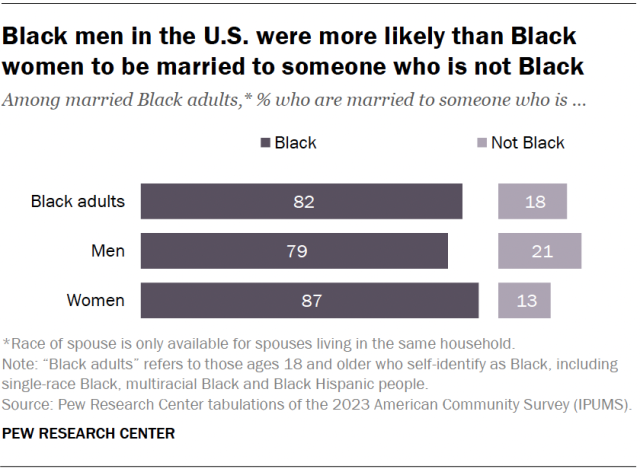
About two-in-ten married Black adults (18%) are married to someone who is not Black. This includes 21% of married Black men and 13% of married Black women. These shares only consider those whose spouses live in the same households.
Married Black women were more likely than married Black men to have a Black spouse (87% vs. 79%). This includes spouses who are single-race Black, multiracial Black and Black Hispanic.
Black households had a median annual income of $54,000 in 2023. That included median incomes of $65,800 for multiracial Black households, $60,000 for Black Hispanic households and $52,800 for single-race Black households.
Related: How wealth varies among households by race and ethnicity
Note: This is an update of a post originally published Feb. 10, 2023.

