Numbers, Facts and Trends Shaping Your World

What we know about the U.S. H-1B visa program

Form I-129 is used by employers to petition U.S. Citizenship and Immigration Services for a beneficiary's H-1B status. (hapabapa via Getty Images)
Form I-129 is used by employers to petition U.S. Citizenship and Immigration Services for a beneficiary’s H-1B status. (hapabapa via Getty Images)

The fate of the H-1B program – which offers U.S. employers a way to temporarily hire foreign workers in specialty occupations – has divided influential Republicans. Tech leaders like Elon Musk strongly support the program, while other Republicans question its impact on American workers. President Donald Trump imposed restrictions on the program in his first term, but his current policy agenda on H-1Bs remains under discussion.

Meanwhile, bipartisan calls for H-1B reforms advocate for more oversight to protect American workers while addressing skill shortages. 

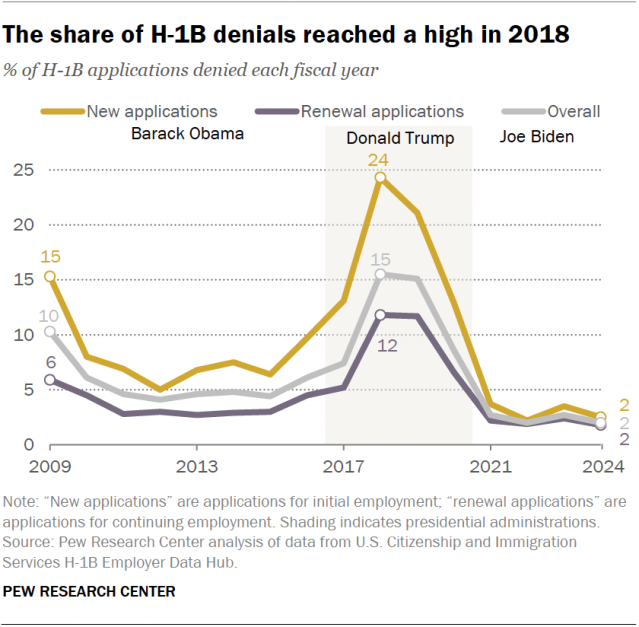
The number of H-1B applications approved in recent years has climbed. Nearly 400,000 were approved in fiscal year 2024, most of which were applications to renew employment. Rejection rates of H-1B applications spiked during Trump’s first term but fell under former President Joe Biden.

Here are some key facts about the H-1B program and its workers. These findings come from government data, some of which we received through a public records request.

How we did this

Pew Research Center conducted this analysis to learn more about H-1B workers in the United States. The analysis used three sources:

  1. Data received through a Freedom of Information Act (FOIA) request from the Department of Homeland Security, U.S. Citizenship and Immigration Services (USCIS), and the Office of Performance and Quality. This source provides data on foreign workers whose H-1B applications were approved each fiscal year from 2000 to 2023. We used this to compile data on the number of approved applications and workers’ country of birth, educational attainment, occupation and median annual salary. Data from this FOIA request was received Sept. 20, 2024.
  2. USCIS H-1B Employer Data Hub. This source provides data on the total number of H-1B applications from fiscal 2009 to 2024. We used this to compile data on the number of approved applications, the denial rate for H-1B applications, the most common H-1B employers and the geographic location of H-1B approvals.
  3. 2023 American Community Survey (ACS). This source provides data on the U.S. population as of July 1, 2023. We used this to compile data on the geographic location of U.S. workers to compare with H-1B approvals. The 2023 ACS was provided through IPUMS from the University of Minnesota and published Census Bureau tables.

In this analysis, the term “H-1B worker” refers to foreign workers whose H-1B applications were approved in a given fiscal year. We use this term interchangeably with “H-1B approval” and “approved H-1B application.” Fiscal years end on Sept. 30 of the designated year.

The data for approvals only includes applications whose first decision from USCIS is an approval.

Not all workers with approved H-1B applications hold H-1B visas. Foreign workers can legally work in the U.S. once USCIS has issued an approved H-1B application. If the worker is located outside the U.S., they can then use their approved application to apply for an H-1B visa from the State Department to enter the U.S. legally.

Notably, the data does not provide a comprehensive picture of all H-1B workers in the country at any given time. Rather, they show approvals (and denials) in a given fiscal year. H-1B visas are typically valid for three years, so there are H-1B workers in the U.S. in a given year whose applications are not part of that year’s data.

Employers submit H-1B “new applications” for initial employment; these are for workers who are applying to work for the given employer and do not already have H-1B approval. These are known as applications for “new” or “new concurrent” employment.

H-1B “renewal applications” are for continuing employment; they are submitted for workers who are renewing their H-1B approval and continue working with the same employer either in the same or a different position, begin working for a different employer, or have some other change in their application. Applications for continuing employment are usually filed for noncitizens already in the U.S.

In this analysis, application totals include both new and renewal applications.

“Denied applications” refer to H-1B applications that were denied in a given fiscal year. “Denial rates” are the share of applications denied. The data for denials only includes applications whose first decision from USCIS is a denial.

The analysis of H-1B workers’ country of birth follows country classifications from the 2023 Yearbook of Immigration Statistics nonimmigrant admissions by region and country of citizenship (Table 26).

The geographic location of H-1B approvals is based on the ZIP code of the employer. The data does not include the individual H-1B worker’s location, which could be at the employer location or elsewhere. We assigned ZIP codes to metropolitan areas using the U.S. Department of Housing and Urban Development ZIP-CBSA crosswalk. ZIP codes sometimes cross metro areas, so ZIP codes that belong to multiple metro areas were assigned to the area with the highest ratio of businesses.

To calculate the number of H-1B approvals per 100 workers in each metro area, we used data from the 2023 ACS provided by IPUMS. For metropolitan areas not defined in the IPUMS data, we used data from published Census Bureau tables (Table B24060). Metro areas are based on the 2023 delineations from the U.S. Office of Management and Budget.

Proportions are calculated from unrounded numbers.

What is the H-1B visa program?

The H-1B program was created by the Immigration Act of 1990. It allows U.S. employers to hire foreign workers on a temporary basis in jobs that require highly specialized knowledge and at least a bachelor’s degree, or its equivalent, in a related specialty.

To participate, an employer must apply to the U.S. Department of Labor. U.S. Citizenship and Immigration Services (USCIS) then reviews the application. If approved, the prospective worker can legally work in the United States. If the worker is located outside the U.S., they may apply for an interview with the U.S. State Department, which, if successful, leads to the issuance of a visa. H-1B approvals are valid for three years and may be extended for a maximum of six years. If an employer is sponsoring a worker for U.S. permanent residency, the H-1B approval may be extended for more than six years.

Since 2005, H-1B approvals for new employment have been capped at 65,000 per year, with an additional 20,000 approvals reserved for foreign workers who have advanced degrees from U.S. colleges and universities. If the number of applications exceeds the caps, USCIS uses a lottery system to process and approve applications. Some employers are exempted from the caps, including universities and colleges, nonprofits and government research institutions. Renewal applications for continued employment are also not subject to the caps.

About 400,000 H-1B applications for high-skilled foreign workers were approved in 2024. That’s more than twice the number of applications approved in fiscal 2000. Approvals peaked in 2022, when 442,425 applications were approved.

Since 2013, the majority of approvals each year have been applications to renew employment. In 2024, 65% of approved applications, or 258,196, were renewals. The other 35%, or 141,207, were new applications for initial employment.

An area line chart showing the number of H-1B applications for initial and continuing employment approved each year from fiscal years 2000 to 2023. The chart shows that H-1B approvals have increased overall since 2000 and peaked in 2022. Since 2006, the majority of approvals each year have been applications for continuing employment.

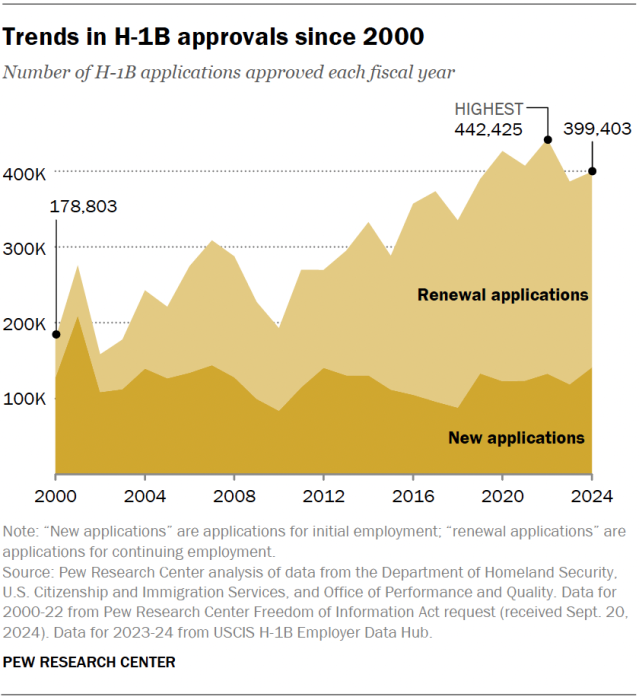
New applications are for workers who are applying to work for a given employer and do not already have H-1B approval. These include applications from employers that are subject to the annual cap of 85,000 approvals and employers that are exempt from the cap.

Renewal applications are for workers to continue their H-1B approval, either with their current employer or with a different employer. They are usually filed for noncitizens who are already in the United States. Applications for renewed employment are not subject to the annual caps. (Refer to “What is the H-1B visa program?” for more information.)

H-1B denial rates dropped to 2% in 2022 – a low since 2009. Denial rates peaked at 15% in fiscal 2018, during Trump’s first administration. That included 24% of new applications for initial employment and 12% of renewal applications for continuing employment. The Trump administration implemented stricter immigration rules, including tightening the definition of “specialty occupations” and limiting third-party placements of H-1B workers.  

Under Biden, the denial rate dropped to under 3%, in part due to court rulings against the restrictions from Trump’s first term.

A line chart showing the share of H-1B applications denied each year for fiscal years 2009 to 2024. The denial rates for applications for initial employment, continuing employment and applications overall are shown separately. The chart shows that the share of H-1B denials peaked in 2018 during President Donald Trump’s first administration, then fell under former President Joe Biden’s administration.

About 40% of U.S. adults say high-skilled workers should be given top priority for legal immigration. Additionally, about 60% of voters say that legal immigrants fill jobs that U.S. citizens don’t want, according to an August 2024 Pew Research Center survey.

Read more about Americans’ views on legal immigration priorities and immigrant workers.

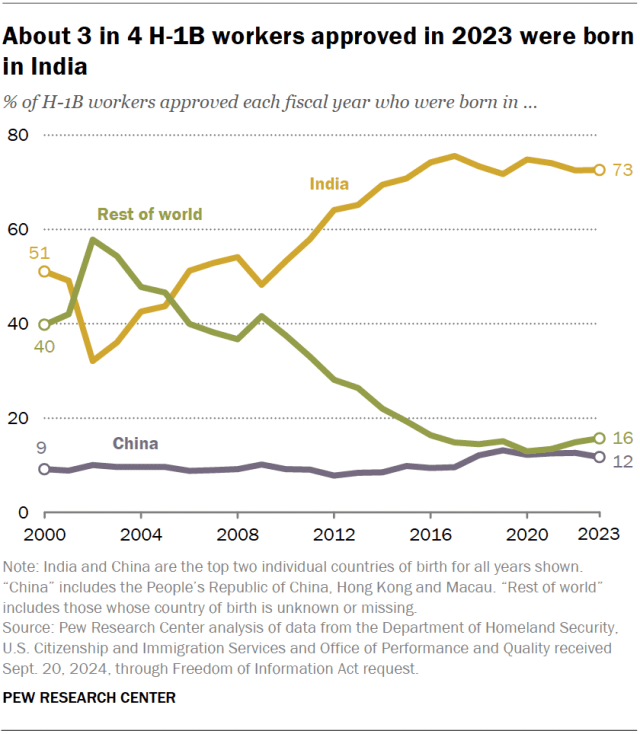
India is the top country of birth for H-1B workers. Roughly three-quarters (73%) of H-1B workers whose applications were approved in fiscal 2023 were born in India. A majority of approvals every year since 2010 have gone to workers born in India.

China is the second-most common birthplace, accounting for 12% of H-1B workers approved in 2023.

No other birthplace accounted for even 2% of H-1B workers approved in 2023.

A line chart showing the share of H-1B workers approved each year who were born in India, China or the rest of the world for fiscal years 2000 to 2023. The chart shows that India is the top country of birth for H-1B workers across all years shown, and in 2023, three-in-four H-1B workers were born in there.

The share of H-1B workers whose highest degree is a master’s increased from 31% in 2000 to 57% in 2021. On the other hand, the share whose highest degree is a bachelor’s decreased from 57% to 34%.

A line chart showing H-1B workers’ highest level of education for fiscal years 2000 to 2021. The chart shows that the share whose highest degree is a master’s has increased while the share whose highest degree is a bachelor’s has decreased.

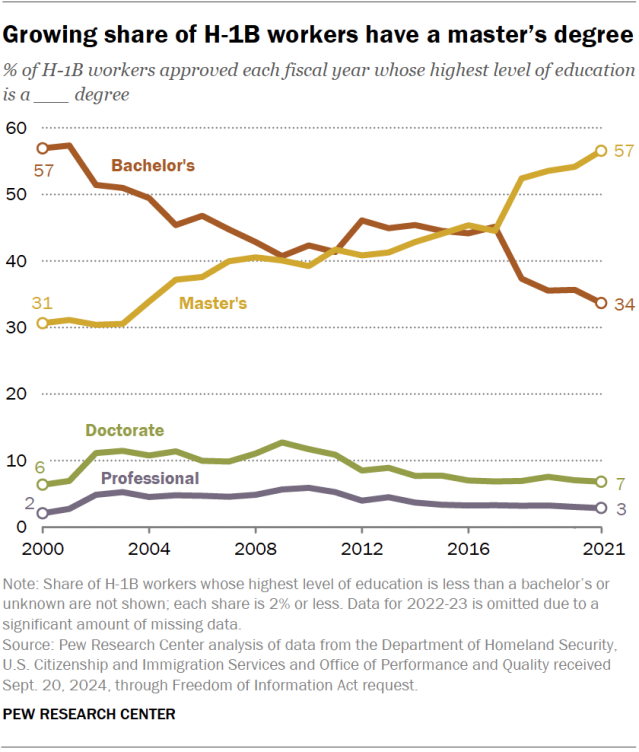
The share with a doctorate has varied between 6% and 13%, and the share with a professional degree (such as a J.D. or M.D.) has ranged between 2% and 6%.

H-1B applicants must work in occupations that require specialized knowledge and at least a bachelor’s degree or its equivalent. In recent years, government agencies have updated rules clarifying the definition of “specialty occupations” and their degree requirements.

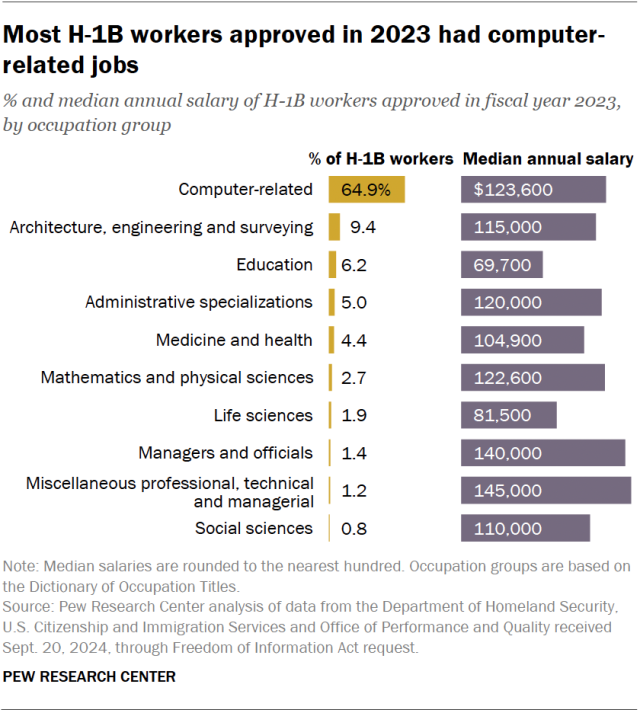
Computer-related jobs have been the most common occupation for H-1B workers for more than a decade. Since fiscal 2012, about 60% or more of H-1B workers approved each year have held a computer-related job. In 2023, the share was 65%, and these workers reported a median annual salary of $123,600. Examples of these include jobs in systems analysis and programming, computer systems technical support, and data communications and networks.

The next largest job group for H-1B workers approved in 2023 is architecture, engineering and surveying (9%). Workers in these jobs reported a median annual salary of $115,000. Examples of these include jobs in electrical or electronics engineering, mechanical engineering, and industrial engineering.

A bar chart showing the share of H-1B workers approved in fiscal year 2023 by occupation group and their median annual salary. The chart shows that 65% of H1-B workers approved in 2023 had computer-related jobs and they had a median annual salary of $123,600.

Amazon has been the employer with the most H-1B workers approved each year since 2020. Amazon received more than 11,000 H-1B approvals in fiscal 2023. This accounts for 3% of all H-1B applications approved that year.

Many of the other top employers provide information technology and business services, including Cognizant Technology Solutions, Infosys, Tata Consultancy Services and Google.

In 2023, three of the top 10 H-1B employers were either headquartered in India (Infosys and Tata Consultancy Services) or originated in India and are now headquartered in the U.S. (Cognizant Technology Solutions). This is a decline from 2016, when six of the top 10 companies had ties to India.

A table showing the top 30 employers for H-1B approvals in fiscal year 2023. Amazon is the most common employer and received more than 11,000 H-1B approvals, accounting for 3% of all H-1B applications approved that year. 

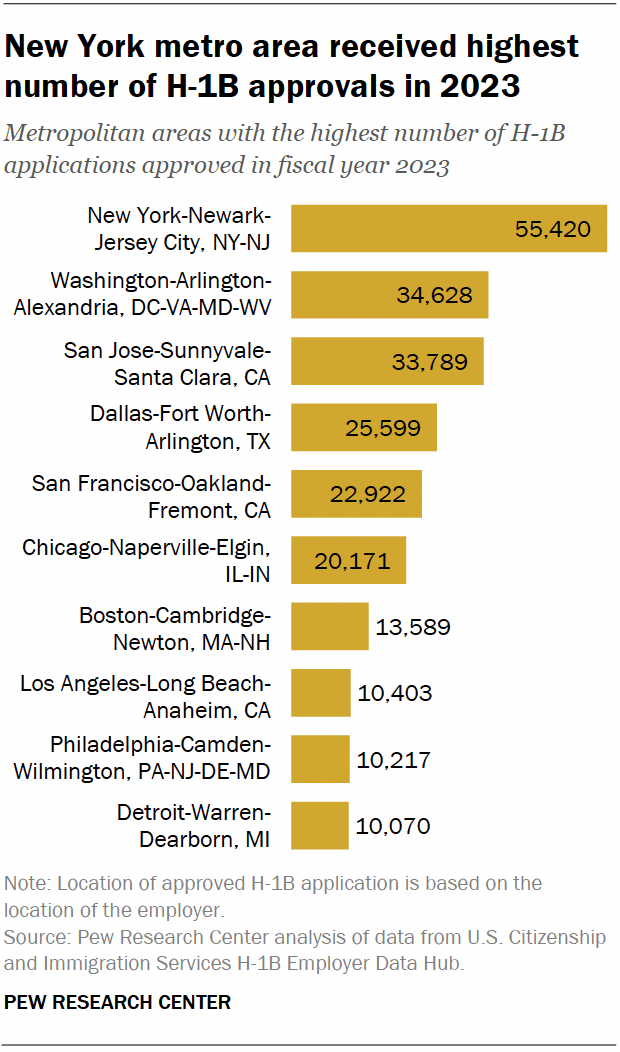
New York far outpaces other metropolitan areas in the number of H-1B applications approved in 2023. More than 55,000 approvals went to employers there. The Washington, D.C., and San Jose, California, metro areas had the next-highest totals, with more than 30,000 approvals each.

The geographic location of H-1B approvals is based on the location of the employer. The data does not include individual H-1B workers’ locations, which could be the employer location or elsewhere.

A bar chart showing the metropolitan areas with the highest number of H-1B applications approved in fiscal year 2023. New York was the top metro area with more than 55,000 approvals.

College Station, Texas, is the metropolitan area with the highest concentration of H-1B approvals. Employers based in and around College Station received about seven H-1B approvals per 100 workers in fiscal year 2023. No other metro area received more than four approvals per 100 workers.

A map showing the metropolitan areas with the highest concentration of H-1B approvals in fiscal year 2023. The map shows that College Station, Texas is the area with the highest concentration of H-1B approvals with about seven H-1B approvals per 100 workers.

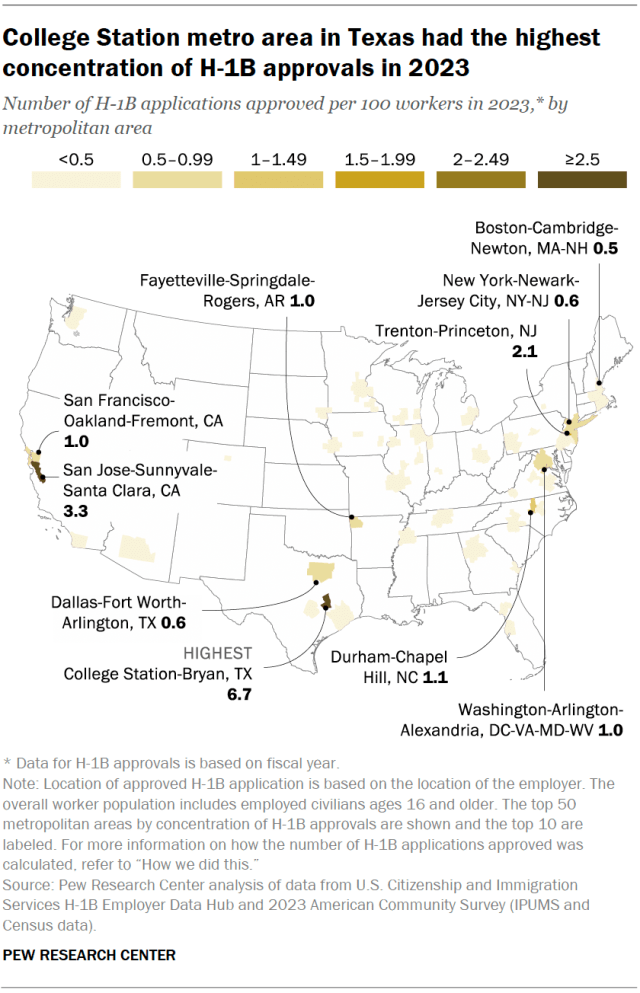
Other areas with high concentrations of H-1B approvals include San Jose, California (three approvals per 100 workers) and Trenton, New Jersey (two approvals per 100 workers).

College Station was also the top metro area from 2010 to 2016, when it had 32 H-1B approvals per 100 workers. Notably, the U.S. headquarters of Cognizant Technology Solutions, the most common employer for H-1B workers in 2016, was previously in College Station before more recently moving to the New York metro area.