As of September 2024, more than 700,000 veterans worked in various federal departments and agencies – making up nearly a quarter of the federal government’s entire civilian workforce. By comparison, veterans account for just 5% of all employed Americans.
Though veterans are, at least in some cases, more protected than other federal workers from layoffs, some veterans already have lost their jobs in the Trump administration’s efforts to slash federal payrolls.
Here’s a look at some facts and figures about the federal government’s veteran workers – who they are, what they do and where they work. Most of our analysis is based on the Office of Personnel Management’s FedScope data portal, which contains data on nearly all executive-branch civilian employees (about 2.3 million as of September 2024, the most recent month available). Note that FedScope doesn’t include U.S. Postal Service workers, congressional staffers, employees of various intelligence agencies, or presidential appointees who require Senate confirmation.
How many federal workers are veterans?
The federal government employed about 713,000 veterans at the end of fiscal 2024. That includes 642,652 at the executive-branch agencies covered in FedScope and more than 70,000 at the Postal Service.
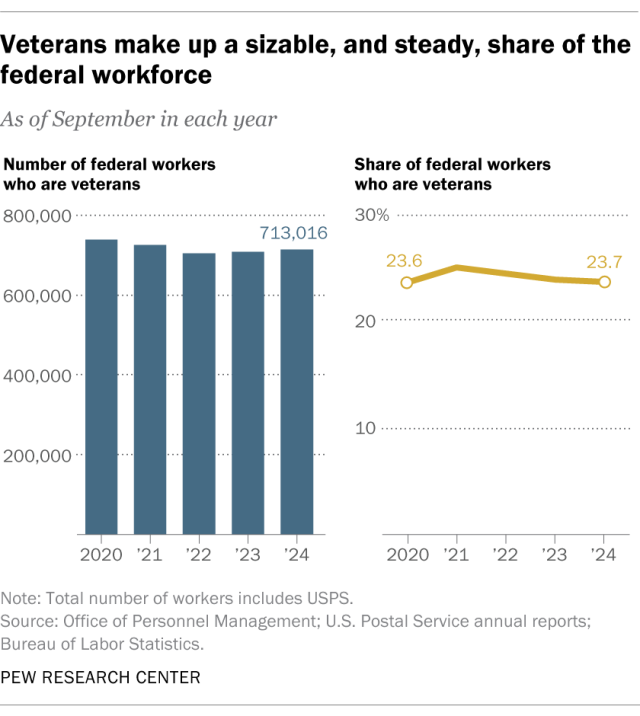
According to the Bureau of Labor Statistics, total federal employment in September 2024 (including the Postal Service) was 3,009,000, meaning veterans made up about 24% of all federal workers. These figures don’t include the roughly 1.3 million active-duty military personnel, who aren’t typically considered “employees.”
The Postal Service doesn’t disclose detailed demographic information about its workers, veterans or otherwise, so the rest of this analysis focuses on data from FedScope, which does.
How has the share of veterans in federal jobs changed over time?
The share of veterans in non-Postal Service jobs has been fairly steady over the past 20 years. The high point was 31.6% in 2016 and 2017; the low, 27.8%, came in 2024.
For the past five years, veterans have made up 10% to 11% of the Postal Service’s workforce, according to the agency’s financial reports.
Which federal agencies employ the most veterans?
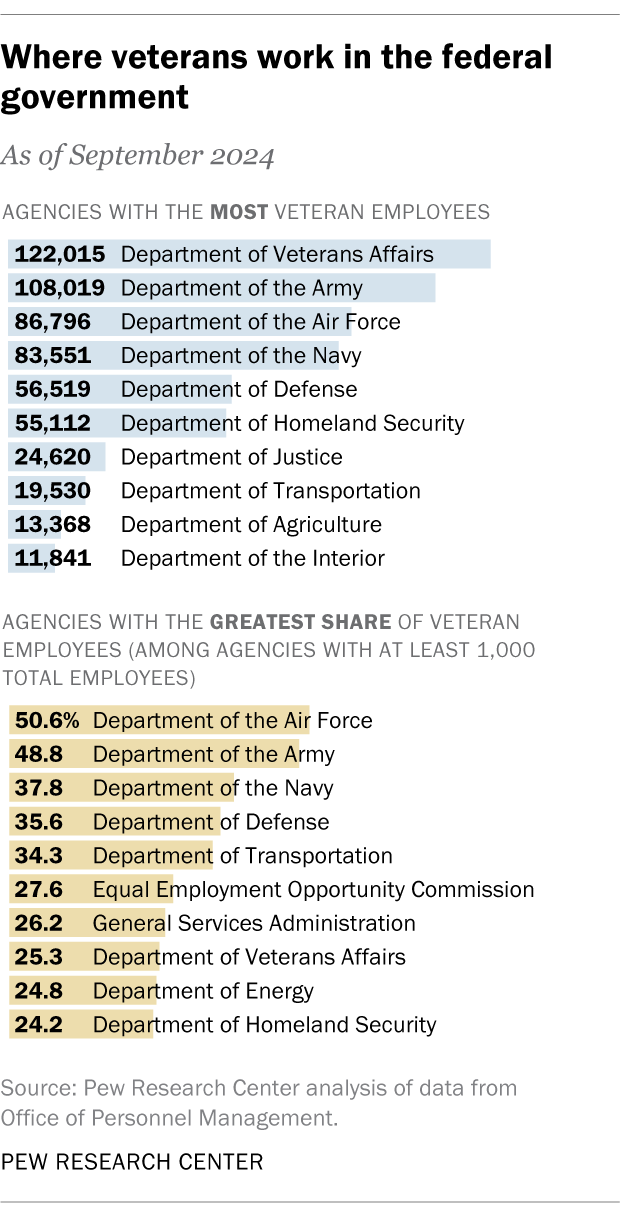
Among the largest agencies (those with at least 1,000 employees as of September 2024), veterans make up the biggest share of workers at the Defense Department and its subordinate military departments. Just over half of the 171,657 civilian workers (86,796) at the Department of the Air Force are veterans, as are nearly half (108,019) of the Department of the Army’s 221,222 employees.
A quarter of the workforce at the Department of Veterans Affairs – the largest Cabinet-level agency, with nearly 483,000 employees – are themselves veterans.
Smaller agencies with military connections also employ large shares of veterans, including the Selective Service System (57% of its 162 workers) and the American Battle Monuments Commission (63% of its 78 employees).
But veterans also make up sizable shares of the workforce at agencies without direct military links. For example:
- Transportation Department: 34.3%
- Equal Employment Opportunity Commission: 27.6%
- General Services Administration: 26.2%
What jobs do veteran workers do for the federal government?
Veterans do all kinds of work for the federal government. Their work can be classified into nearly 60 broad occupational categories and more than 600 specific occupations, from “able seaman” to “zoologist.” But they tend to predominate in certain areas.
Among job categories with more than 1,000 total workers (as of September 2024), the following have the highest shares of veterans:
- Armaments workers (64.3%)
- Equipment, facilities and services workers (58.6%)
- General equipment maintenance workers (57.1%)
- Supply and inventory workers (53.7%)
- Aircraft service and repair workers (53.2%)
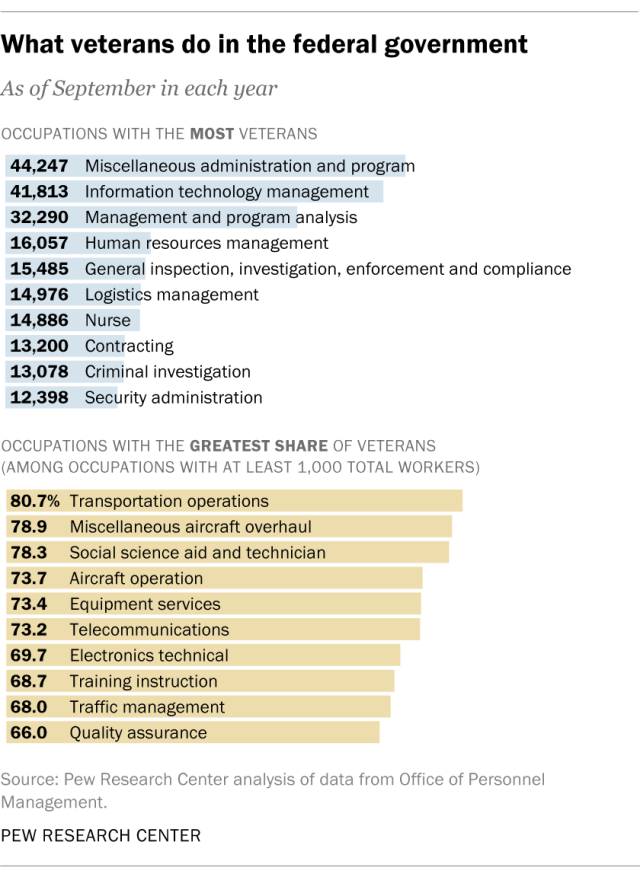
As far as specific occupations, many of the most common ones among veterans are the most common ones overall. “Miscellaneous administration and program work,” with 113,373 workers, is the single biggest federal job classification; 44,247 of those workers, or 39%, are veterans. About 41,800 of the almost 101,000 workers in information technology management, or 41%, are veterans. And one-third of the 96,800 people who work in “management and program analysis” are veterans.
How do veterans and nonveterans in the federal workforce compare?
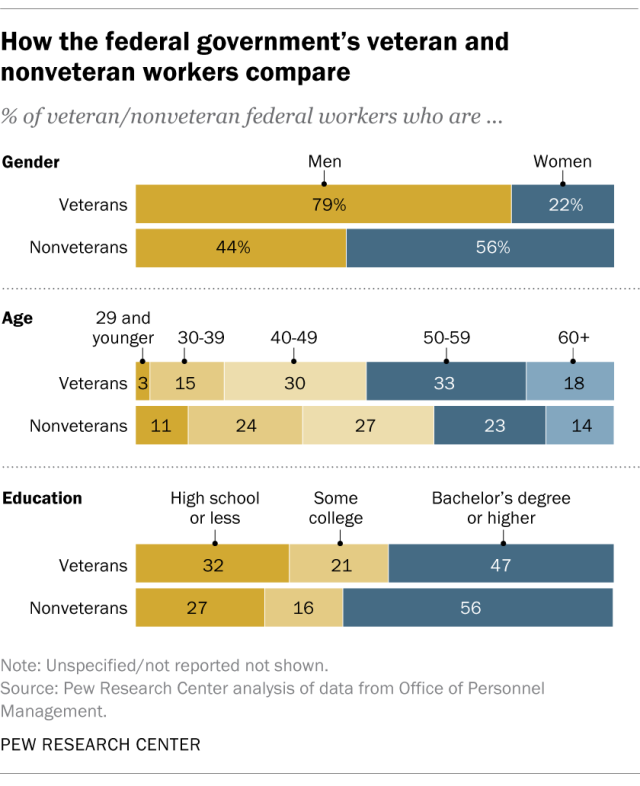
Age: Veterans tend to be older than nonveterans. As of September 2024, only 18.5% of veteran workers are younger than 40, compared with almost 35% of nonveteran workers. Conversely, 51.8% of veterans are ages 50 and older, versus 37.6% of nonveterans.
Gender: Veteran federal workers are considerably more likely than nonveterans to be men – 78.5% of them are, compared with 44% of nonveterans.
Education: Among federal workers, veterans are less likely than nonveterans to have a college education. Nearly a third (32.1%) of veteran federal workers have a high school education or less, compared with 27% of nonveterans. Conversely, 56.4% of nonveterans have a bachelor’s degree or higher academic credential, while 47.1% of veteran workers do.
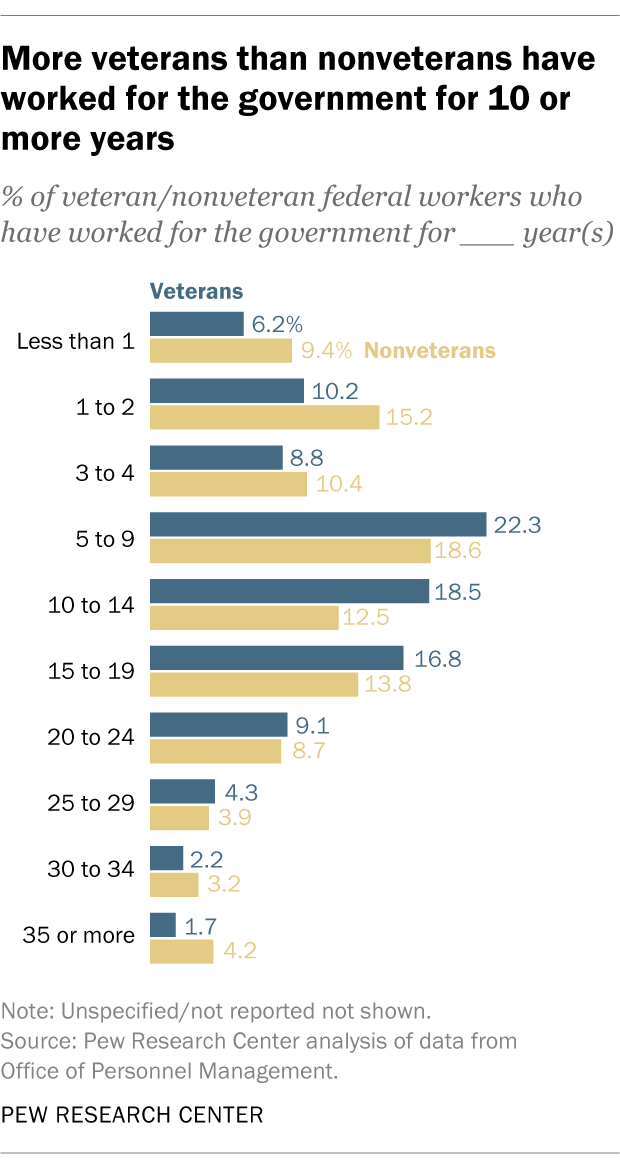
Length of service: On average, veterans have been in federal civilian employment for 12.0 years, slightly longer than nonveterans (11.7 years). However, a higher share of nonveterans (11.4%) than veterans (8.2%) have been with the federal government for 25 years or longer.
We couldn’t analyze differences between veterans and nonveterans by race and ethnicity because that data had been removed from FedScope and was not available elsewhere as of early April.
