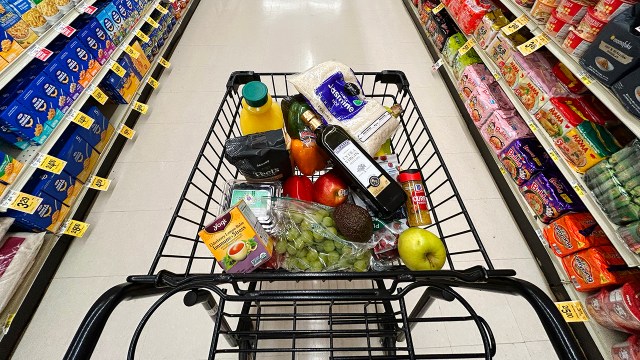
How Americans fill their shopping carts at the grocery store is partly driven by prices. About six-in-ten U.S. adults say food costs are extremely or very important to them when deciding what food to buy, according to a recent Pew Research Center survey.
With egg prices at a near-record level and higher tariffs taking effect, here are five facts about food costs in the United States, based on Center surveys and federal data.
Costs are a key factor in many Americans’ food choices. A majority of U.S. adults (62%) say how much food costs is extremely or very important to them when deciding what to buy.
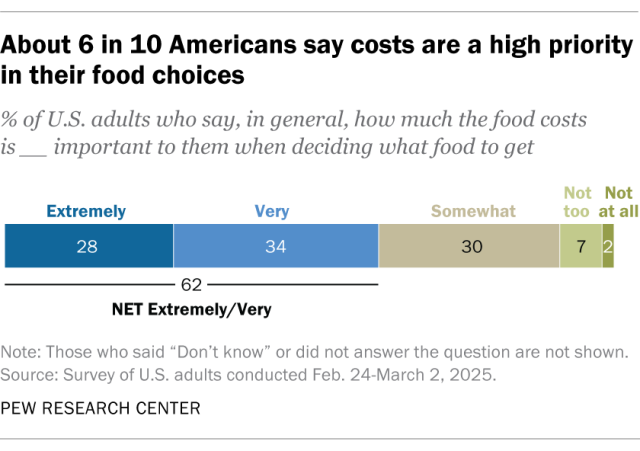
Smaller shares of Americans say the healthiness of the food (52%) and how convenient the food is to get and prepare (47%) are highly important factors when deciding what to buy. How the food tastes ranks the highest of the four considerations we asked about: 83% say this is extremely or very important to them.
Majorities across many demographic groups see food costs as highly important. But Americans in lower-income households are especially likely to prioritize this. Three-quarters in this group say cost is key when deciding what food to buy, compared with much smaller shares of middle-income (61%) and higher-income (39%) Americans.
Most Americans say healthy food has become more expensive for them over the past few years, according to the same Center survey from March. Nine-in-ten U.S. adults say this, including 62% who say it’s become a lot more expensive. Few say the price of healthy food hasn’t changed (6%) or has become a little or a lot less expensive (3%).
About seven-in-ten Americans (69%) say the increased cost of healthy food makes it more difficult for them to eat healthy.
Inflation data shows that nearly every food item the government tracks has become more expensive in recent years. As of April, the overall price of food at home was up 2.0% compared with the same time last year, according to the latest Consumer Price Index for All Urban Consumers (CPI-U) data from the Bureau of Labor Statistics (BLS). The cost of food at home has climbed 28.3% since January 2020, before the COVID-19 pandemic hit the U.S.
Related: As inflation soars, a look at what’s inside the consumer price index
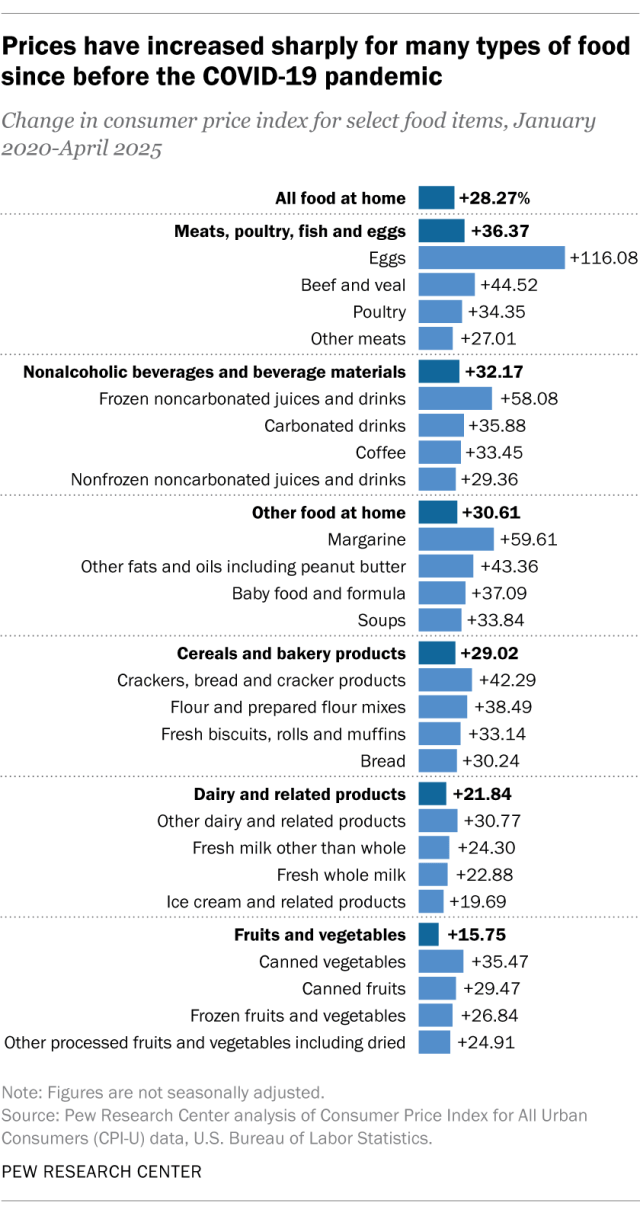
There are six distinct food and drink categories in the CPI-U. The “meats, poultry, fish and eggs” category has seen the fastest inflation since January 2020: Prices are up 36.4%. Egg prices alone have more than doubled over this time frame, rising 116.1%.
Besides eggs, the cost of margarine (+59.6%), frozen noncarbonated juices and drinks (+58.1%), crackers, bread and cracker products (+42.3%), canned vegetables (+35.5%), and dairy (other than ice cream, cheese and milk) and related products (+30.8%) also saw steep inflation since January 2020.
For the caffeine-dependent, coffee now costs, on average, 33.4% more than before the pandemic, while the BLS’s price index for the “other beverage materials including tea” category has risen by 26.9%.
Price indices for coffee and several other products – including chicken, milk, uncooked beef roasts, and candy and chewing gum – remain among their highest levels recorded.
A growing share of U.S. households are “food-insecure,” meaning they sometimes cannot pay for the food they need. At some point in 2023, 13.5% of U.S. households were food-insecure, according to the latest data from the U.S. Department of Agriculture (USDA). This includes 5.1% – or roughly 6.8 million households – that had very low food security that year, meaning that some household members’ normal eating patterns were disrupted at times. The share of food-insecure households was higher in 2023 than in the previous three years: 12.8% reported experiencing this in 2022, as did 10.2% in 2021 and 10.5% in 2020.
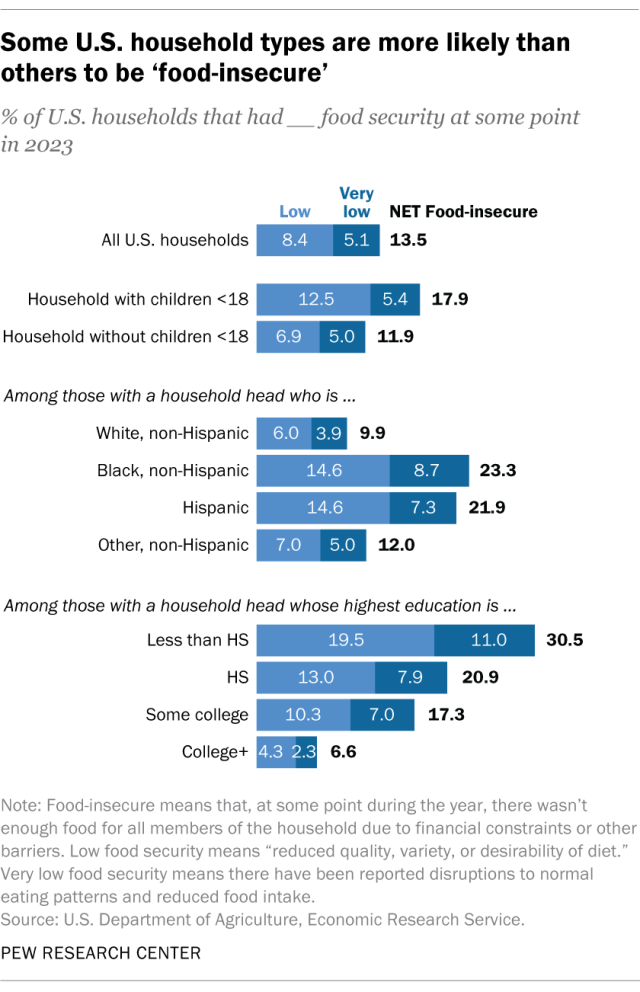
Food-insecurity is especially prevalent in homes with kids present: 17.9% of households with children under 18 reported being food-insecure at some point in 2023, compared with 11.9% of households without minors. For single-woman households with children, 34.7% were food-insecure at some point in 2023.
Differences also emerge by:
- Race and ethnicity: Households led by Black (23.3%) and Hispanic (21.9%) adults were much more likely than those headed by White adults (9.9%) to face food insecurity in 2023.
- Education: Households headed by an adult without a high school diploma were nearly five times as likely as those led by an adult with a college degree to have experienced food insecurity at some point in 2023 (30.5% vs. 6.6%).
- State: In the three-year period between 2021 and 2023, food insecurity rates were higher than the 12.2% national average in Arkansas (18.9%), Texas (16.9%), Louisiana (16.2%), Mississippi (16.2%), Oklahoma (15.4%), Kentucky (14.5%) and South Carolina (14.4%).
Food and consumer goods prices remain a top economic concern for Americans. Two-thirds of Americans say they are very concerned about these costs, according to an April Center survey. This is down slightly from 74% in September, largely because of changing views among Republicans.
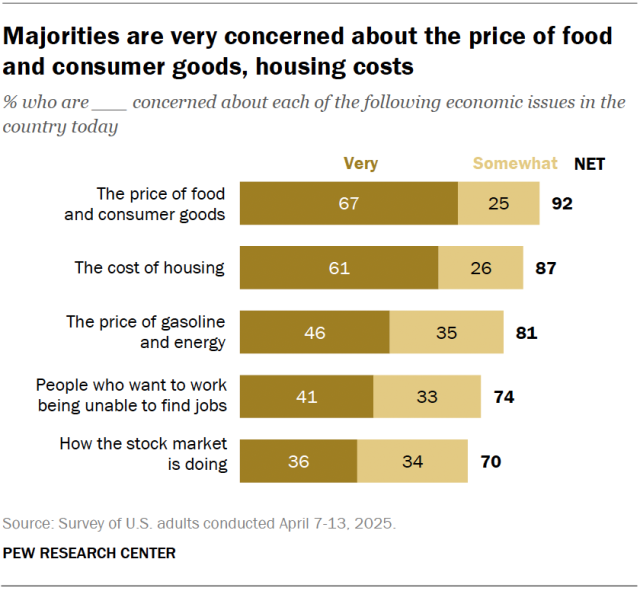
Nearly six-in-ten Republicans and Republican-leaning independents (57%) say they are very concerned about food and consumer goods prices, down from 85% in September. The opposite pattern appears among Democrats and Democratic leaners: 78% say they are very concerned, up from 64% last September.
Of the five economic concerns we asked about in April, food and consumer goods prices topped the list for Americans, with 92% saying they are at least somewhat concerned. The April survey was conducted after the Trump administration announced new tariffs on nearly all U.S. trading partners on April 2. It was in the field when the administration paused tariffs on April 9 for most countries except China.
UPDATE (June 6, 2025): BLS announced in early June that it used a reduced collection sample to calculate its April inflation figures, and stopped collecting CPI data in Lincoln, Nebraska, and Provo, Utah, due to decreased resources and staffing. The agency said these changes “have minimal impact on the overall all-items CPI-U index, but they may increase the volatility of subnational or item-specific indexes.”
