I. Overview
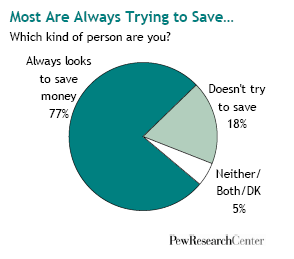
At a time when the personal savings rate in this country has fallen into negative territory for the first time in modern history, more than three-quarters (77%) of all Americans describe themselves as the kind of person who “always looks for ways to save money.”
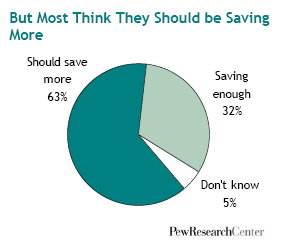
This paradox is not as stark as it may seem, for nearly two-thirds (63%) of Americans also acknowledge they don’t save enough, and more than a third say that they often (11%) or sometimes (25%) spend more than they can afford.
Asked what they splurge on, people most frequently cite food and restaurant dining, followed by entertainment and recreation, then shopping and personal items.
The findings are from a nationwide Pew Research Center telephone survey conducted from October 18 through November 9, 2006 among a nationally representative sample of 2000 adults; it has a margin of sampling error of plus or minus 2.5 percentage points.
One central finding of the survey is hardly a surprise: the less income people have, the more trouble they have with saving and spending. People with lower incomes are more likely to say they always look for ways to save but less likely to say they succeed. They’re more prone to worry about money. They’re more likely to have piled up credit card debt. And they argue about money more often with their spouses.
But income levels, this survey finds, are not the only demographic characteristic strongly correlated with people’s habits and attitudes about saving and spending. Age and life cycle also matter a great deal.
Older Americans (those ages 65 and above) are much more likely than the rest of the adult population to say they save and invest enough. Also, they’re less likely to say they worry about money, or that they spend more than they can afford.
As for the rest of the adult population, difficulties with low savings rates are widely shared by virtually all income and demographic groups. Among people under age 65, majorities of high income adults as well as lower income adults say they don’t save enough. So do majorities of men as well as women; whites as well as blacks and Hispanics; married people as well as singles, the employed as well as the unemployed; and college graduates as well as those with less education.
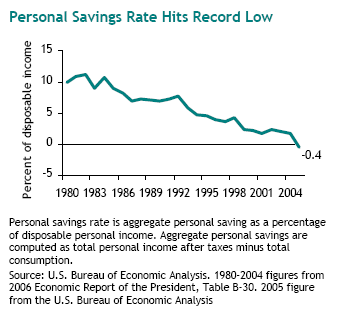
These concerns are borne out by government data. The U.S. Commerce Department’s Bureau of Economic Analysis has estimated that, since April of 2005, the American public has been spending more money than it has earned after taxes–an unprecedented development in the past half century.1 As recently as the early 1980s, Americans on average had been saving more than 10 percent of their after tax earnings.
Also, the Federal Reserve System reports that total household debt has risen sharply in the past decade, due largely to increases in mortgage debt.2
However, despite both the negative savings rates and the growth in household debt, the median financial wealth of families has continued to rise, due mainly to increases in the value of peoples’ homes and/or their stock holdings.3 Indeed, economists have argued that this “wealth effect” may at least partly explain today’s historically low savings rates. As people have seen value of their assets grow, this theory goes, they may feel more freedom to spend and less need to save.
The Pew survey offers little more than marginal support for this hypothesis. It finds that about half of all homeowners (46%) say that the value of their home has increased “a lot” in recent years. In their saving and spending habits, this group does differ a bit from the rest of the population.
They are a bit less likely to say they often or sometimes spend more than they can afford (27% versus 35% among other homeowners and 47% among renters). They also report a slightly lower propensity to worry about money. But they’re no different from the rest of the population in their inclination in their description of themselves as the kind of person who is always looking for ways to save.
Similarly, respondents who are market investors worry less about money than do those who don’t have any such financial investments. They’re also more likely to say they save and invest enough, and they’re less likely to say they spend more than they can afford. It should be noted, however, that market investors are also more likely to have high incomes, and having a high income also correlates independently with these same saving and spending characteristics.
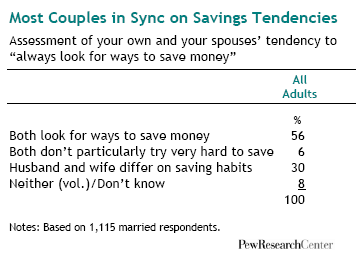
Money and Marriage. A majority of husbands and wives share the same basic attitudes toward saving with their spouse, but a significant minority – three in ten – has different views. The breakdown is as follows: among married adults, 56% say that both they and their spouse always look for ways to save money and 6% say that both they and their spouse don’t try particularly hard to save. However, fully 30% say that they and their spouse have different attitudes about saving. And – no great surprise here – these are the couples most likely to argue about money. Some 52% of these couples say they often or sometimes disagree about money, compared with 38% of all married couples.
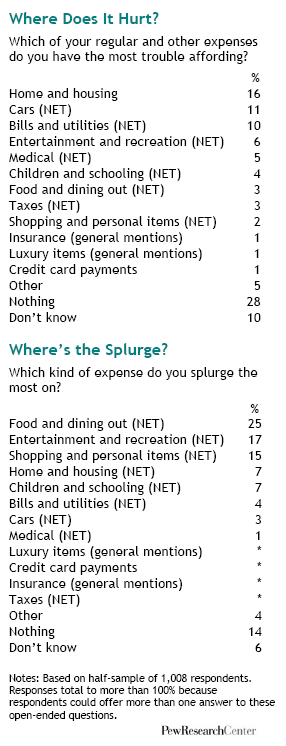
Spending Patterns. When it comes to spending patterns, Americans say that the expenses they have the most trouble affording are the familiar “big ticket” items: home and housing (16%) and cars (11%). Farther down the list come bills and utilities (10%), entertainment and recreation (6%), medical (5%), children and school (4%), food and dining out (3%), taxes (3%) and shopping and personal items (2%).
The list order is much different, however, when the public is asked to name the items they splurge most on. Here, three kinds of expenses dominate: food and dining out (25% of responses), entertainment and recreation (17%); and shopping and personal items (15%). People also cite these same three items as the ones they’d be most inclined to cut back on if necessary, with entertainment and recreation (21%) edging out food and restaurant dining (19%) at the top of this list.
The survey also finds that peoples’ attitudes about which everyday consumer products are necessities and which are luxuries have changed in the past decade in ways that would seem to create added pressure to spend.4 Americans are much more inclined now than in 1996 to describe a wide range of products as necessities – from air conditioning to microwave ovens to computers to cell phones.
[them]
