
Ever since there have been suburbs there have been harsh critiques of suburbs — a common one being that they are suffocating places where people live lives of quiet desperation.
Well, most suburbanites apparently never got that memo.
Suburbanites are significantly more satisfied with their communities than are residents of cities, small towns or rural areas, according to a Pew Research Center Social & Demographic Trends survey that explores what Americans like — and don’t like — about the places where they live.
The survey asks respondents to rate their community on eight characteristics: job opportunities; cost of living; a place to raise children; recreational and outdoor activities; shopping; the climate; cultural activities; and opportunities to meet people and make friends. It also asks for an overall rating.
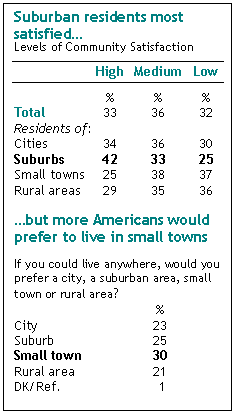
Responses to all nine questions were aggregated into a single scale. Overall, 42% of suburban residents give their community high marks on this combined scale, compared with just 34% of city residents, 29% of rural residents and 25% of small town residents.
So let the critics bray. The suburban life is the good life, right? Well, yes, but …
The same survey also asks people whether, if they could live anywhere, they would prefer to live in a city, a suburb, a rural area or a small town. On this measure, the suburban “good life” is a bit of a flop. Just 25% of the overall public says the suburb is their ideal community type. In fact, a higher share (30%) of the public says that small towns are their ideal community type — this despite the fact that the people who live in small towns are much less satisfied with their communities than are residents of suburbs.
The survey did not ask enough questions to explain this “image versus reality” gap in the public’s judgments about life in suburbs and small towns. But no observer of American history or culture will have much trouble conjuring up some theories. Americans have always celebrated the values and lifestyle of the small town, even as an ever diminishing share has chosen to live in such communities. Likewise, the popular culture has often embraced the rap on suburbs as sterile and conformist places, even as Americans have migrated there in rising numbers and their populations have become increasingly racially diverse.
It’s worth noting that the image vs. reality gap doesn’t necessarily reflect inconsistent or paradoxical views on the part of the public. Instead, these attitudes may simply reflect two complementary realities: many people are satisfied with their communities, but at the same time believe that some other type of place may be even more desirable, a finding explored in detail in an earlier Pew Research Center report .
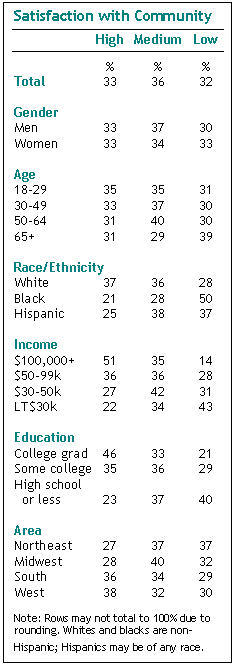
The survey, which was conducted from Oct. 3-19, 2008 among a nationally-representative sample of 2,260 adults, also finds a wide range of demographic characteristics linked to community satisfaction. In particular, whites rate their communities significantly better than do blacks or Hispanics. Also, college graduates and adults earning $100,000 or more are more likely than other adults to be satisfied with their communities. It’s hardly surprising that those with higher incomes and more marketable skills are happier with the places they live — after all, they’re more likely to be able to afford to live in communities that provide better services and amenities.
To examine community satisfaction, a scale was created based on the nine survey questions (see Appendix A for details on how the scale was created and question wording.) The sample then was divided into three roughly equal-sized groups: Those who consistently express high levels of satisfaction across the nine questions (about 33% of the sample), those who express the least amount of satisfaction (32%), and a middle third that rate their areas somewhere in-between. One caution: This list did not cover all possible dimensions of community satisfaction. For example, it did not probe for satisfaction with the pace-of-life in a community or opportunities to form deep bonds with friends and neighbors. A broader list might have produced different results.
This analysis focuses on comparisons between the groups that are the most and the least satisfied with their communities.
Why Are Suburbanites So Satisfied?
Suburban residents express the highest levels of satisfaction and the lowest levels of dissatisfaction with the communities in which they lived. More than four-in-ten suburban residents (42%) consistently give high marks to their communities as places to live, compared with 25% of adults living in small-town America. A third of city dwellers and somewhat fewer rural residents also give their communities top grades. (See Appendix B for breakdowns of all nine community satisfaction question by type of place.)
A deeper look at these data suggests the significant role that demography plays in shaping how residents view their communities. And it also highlights the very different lives that America’s haves and have-nots are living, down to the stark differences in their perceptions of the quality of the neighborhoods they call home.
Affluent Americans tend to be big boosters of their communities, giving them top marks as places to live, work and raise families. This finding is not surprising: the affluent can afford to live in more desirable communities, and these communities, in turn, can afford to offer more and better services and amenities to their residents. But the degree to which money matters is notable. Fully half (51%) of all adults with family incomes of $100,000 a year or more give their community top ratings, compared with just a quarter of those earning less than $50,000. Similarly, college graduates are twice as likely as those with a high school degree or less education to express high levels of community satisfaction (46% vs. 23%).
Significantly, a larger share of college graduates as well as adults earning $100,000 a year or more live in the suburbs than in cities, small towns or rural areas — little wonder, then, that community satisfaction is highest in suburban communities.
Other demographic characteristics are closely associated with community satisfaction. Among the most striking findings of the survey are the level of dissatisfaction expressed by blacks toward the communities in which they live. Fully half of all blacks give low levels of approval to their communities, compared with 28% of all whites and 37% of Hispanics. The fact that blacks are less likely than whites to be college graduates (19% vs. 31%) or earn $100,000 or more (7% vs. 18%) largely — but does not completely — explain the strong relationship between race and community satisfaction.
Age is modestly related to overall community satisfaction, and in an intriguing way. There are no significant differences in the proportion of those in each age group that are very satisfied with their communities as places to live. For example, 31% of those age 65 and older fall into the high satisfaction group, compared with 35% of those under the age of 30, 33% of those 30-49 and 31% of those 50-64. But at the same time, 39% of older adults fall into the group of those most dissatisfied with their communities, compared with about three-in-ten of young and middle-aged Americans.
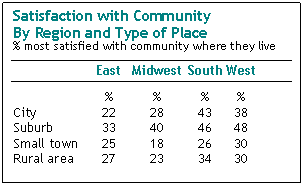
Residents of communities in the South or West are more satisfied than those living in the Northeast or Midwest. And the suburbs of the West and South are among the most satisfied places in America. Nearly half of residents living in western suburbs (48%) and southern suburbs (46%) are highly satisfied with their communities. In contrast, just 33% of suburban residents in the East and 40% of those in the Midwest give high marks to the places where they live.
Are these demographic characteristics independently associated with community satisfaction? The answer appears to be yes. We used a statistical technique knows as linear regression to analyze the independent impact of each of a number of variables on the likelihood that someone is satisfied with his or her community. The analysis found that income, education, race, age, type of place and region of the country are each statistically significant indicators of community satisfaction, holding all other variables constant.
Other Correlates of Community Satisfaction
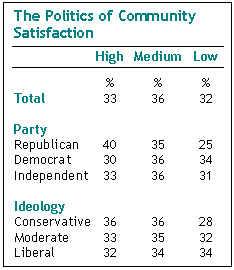
As an earlier Pew Research Center study documents, Republicans are generally happier than Democrats in most areas of life. So it may not be surprising that they also are more satisfied with their communities. Four-in-ten Republicans express high levels of satisfaction with their communities, compared with three-in-ten Democrats and a third of all independents.
Ideology matters, but just a little: 36% of political conservatives but 32% of liberals give their communities top marks. Similarly, conservatives are less likely to be dissatisfied with their communities.
People who are most satisfied with their communities also tend to be generally happier, the new survey finds. Among those who say they are “very happy,” nearly half (47%) also are highly satisfied with their communities. But among those who report they are “not too happy,” only 15% are highly satisfied with their communities as places to live.
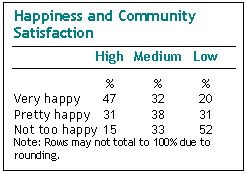
These findings raise a question that the data cannot answer: Does community satisfaction improve an individual’s overall sense of happiness, or does being happy have a “halo” effect that improves attitudes toward many aspects of life, including satisfaction with one’s community?


