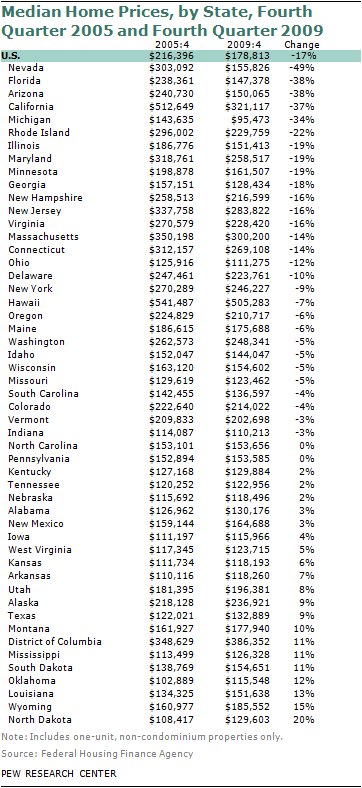
The housing downturn that began in 2006 had distinct geographic patterns. From the end of 2005 to the end of 2009, median home prices decreased by more than 30% in five states: Nevada (down 49%), Florida (38%), Arizona (38%), California (37%) and Michigan (34%). Home prices fell between 10% and 22% in 12 other states and by less than 10% in 12 more states. They were flat or rising from 2005 to 2009 in the remaining 21 states and the District of Columbia.
The geography of the housing downturn had an especially strong impact on Hispanics and Asians because they are much more likely to reside in the hardest-hit areas. In 2005, more than two-in-five of the nation’s Hispanic and Asian households resided in Arizona, California, Florida, Michigan and Nevada, the five states with the steepest declines in home prices. By contrast, only about one-in-five of the nation’s white or black households resided in these states. Thus, Hispanic and Asian households were more exposed to the housing downturn than were other households.
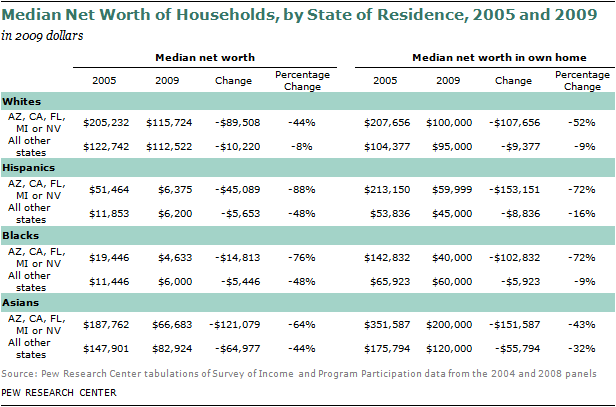
Estimates of household net worth by region reveal the differential impact of the housing downturn. Residents of Arizona, California, Florida, Michigan and Nevada experienced far greater drops in their net worth than residents elsewhere. For Hispanics in these five states, median net worth tumbled from $51,464 in 2005 to $6,375 in 2009, a loss of 88%. For Hispanics residing outside of these five states, median net worth fell from $11,853 to $6,200, or by 48%.16

The regional estimates of wealth also illustrate the roller-coaster ride that was the housing boom and bust. In 2005, Hispanic households in Arizona, California, Florida, Michigan and Nevada had a net worth more than four times the net worth of Hispanics elsewhere, $51,464 versus $11,853. By 2009, the net worth of Hispanic households had equalized across regions.
The experience of Hispanic households repeats across all racial and ethnic groups. The net worth of blacks, whites and Asians fell at much greater rates in the five states. In 2005, at the cusp of the housing downturn, all households in the five states had reported much greater levels of wealth. By 2009, the situation had reversed for blacks and Asians—those residing in Arizona, California, Florida, Michigan and Nevada now had lower levels of wealth.
The role of housing is further explicated by the estimates of median levels of home equity. Regardless of race and ethnicity, households located in the five states with the greatest declines in home prices also experienced the greatest losses in home equity.17


