A majority of middle-class adults say they have a better standard of living now than their parents had at the same stage of life, and a plurality say they expect their own children’s standard of living to eventually surpass their own. However, a somewhat smaller share holds these views now than in early 2008, when the national economy went into a tailspin from which it hasn’t fully recovered.
Middle-class adults also mark their long-term economic progress not just by comparing their own lifestyles with that of their parents, but by comparing the socio-economic class they place themselves in now with the class they placed themselves in when they were growing up. On this measure, too, the survey findings are broadly upbeat. Many more say they grew up in the lower-middle or lower class (40%) than say they grew up in the upper-middle or upper class (16%); 44% say they grew up in the middle class.
Among middle-class adults, there are notable differences by race, age and partisanship in these judgments about long-term economic mobility.
Middle-class blacks and Hispanics stand out from whites in their sense of progress compared with the standard of living of their parents and in their optimism for the future.
But some of the groups that have lost the most ground relative to their upbringing are also strikingly optimistic about the future. For example, younger adults (ages 18 to 29) are more likely than older adults (especially those ages 65 and older) to have moved down the social class ladder, but they are also more optimistic about their children’s ability to surpass their own standard of living down the road. In addition, younger adults are more optimistic than older adults of traditional working age (ages 30 to 64) about their future standard of living.
Party identification is also related to optimism about the future. Middle-class Democrats are more optimistic about their children’s future standard of living than are Republicans. And middle-class Democrats still within traditional working years (ages 18 to 64) are more upbeat than their Republican counterparts that their own standard of living will surpass that of their parents.
Still Upbeat About the Long Run, but Less So than in 2008
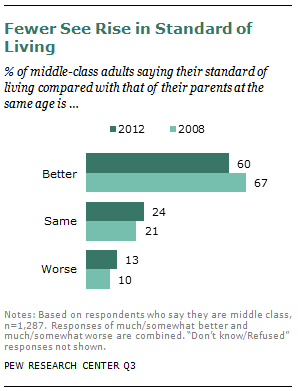
Six-in-ten of middle-class adults consider their current standard of living to be better than that of their parents at the same stage in life, 24% say it is the same and 13% say their standard of living is worse than that of their parents at the same stage in life.
Compared with 2008, however, fewer middle-class adults today consider their standard of living to have improved relative to their parents’ generation. In 2008, fully two-thirds (67%) of those in the middle class saw themselves as having a better standard of living than their parents did at the same stage in life.

Middle-class blacks and Hispanics are more likely than middle-class whites to see their own standard of living as better than that of their parents at the same point in life. Half of middle-class blacks (50%) consider their standard of living to be “much better” than that of their parents, and 18% say it is somewhat better. Similarly, 48% of middle-class Hispanics consider their standard of living to be “much better” than their parents was at the same age, and 22% say it is somewhat better. Among whites, a third (33%) say their standard of living is much better than their parents’, and 24% say it is somewhat better.
Middle-class adults with a high school diploma or less are more upbeat than college graduates about their standard of living relative to that their parents held. Fully 64% of those with a high school diploma or less see themselves as better off than their parents were at this point in life, compared with 55% of college graduates and 58% of those with some college education.
Middle-class urbanites are also positive overall about their standard of living relative to that of their upbringing. Two-thirds of the urban middle class (67%) say they are better off now than their parents were at the same age. This compares with 58% among those in the suburbs and about half of those in more rural areas (52%) who say their standard of living is better than that of their parents at that age.
There are no substantial differences between middle-class men and women, or younger and older adults on this measure. Democrats are somewhat more likely than Republicans to see themselves as better off than their parents were at the same age.
Upward and Downward Mobility Over the Life Course
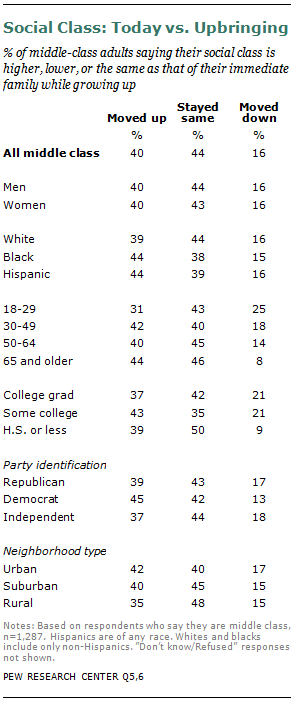
Among middle-class adults, 44% see themselves as having stayed in the middle class over time, four-in-ten (40%) see themselves as having moved up (from lower class to middle class), and 16% see themselves as having moved down (from upper class to middle class) compared with their childhood upbringing.
Middle-class adults under age 30 are especially likely to see themselves as downwardly mobile in comparison to their upbringing. A quarter (25%) of middle-class adults ages 18 to 29 see themselves as downwardly mobile, as do 18% of those ages 30 to 49 years; by comparison, 14% of those ages 50 to 64 and 8% of those ages 65 and older see themselves as downwardly mobile. The age differences are greatest between the oldest (ages 65 and older) and youngest (ages 18 to 29) middle-class adults. More than four-in-ten of those ages 65 and older (44%) say they have moved up the class ladder, compared with about three-in-ten (31%) of those ages 18 to 29 years.
About two-in-ten middle-class adults with at least some college education (21%) or a college degree (21%) see themselves as downwardly mobile compared with their upbringing. By comparison, just one-in-ten (9%) of middle-class adults with a high school diploma or less see themselves as downwardly mobile, and half (50%) see themselves as having stayed in the middle class.
Middle-class whites, blacks and Hispanics are about equally likely to see themselves as upwardly or downwardly mobile compared with their childhood.
Perceptions of social mobility are about the same between middle-class men and women, partisan groups, and neighborhood types.
Where Am I Headed?
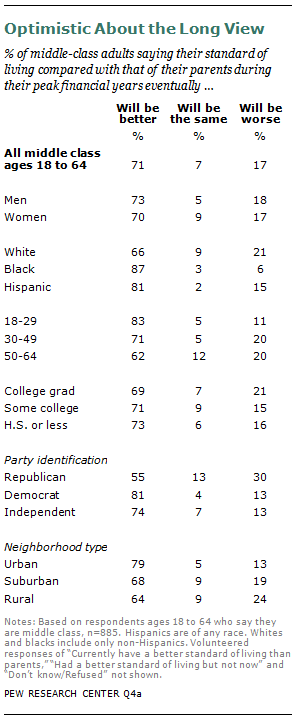
Among those in the middle class who have not yet reached traditional retirement age (ages 18 to 64 years), about seven-in-ten (71%) think they will have a better standard of living relative to their parents’ peak financial years, while 17% think they will fare worse than their parents and just 7% expect to fare about the same as their parents.
Younger middle-class adults (age 18 to 29) are more optimistic about surpassing their parents’ standard of living than are older adults. Fully eight-in-ten (83%) of those ages 18 to 29 expect they will have a better standard of living than their parents had in their peak financial years, compared with 71% among middle-class adults ages 30 to 49 and 62% among those ages 50 to 64 years.
Middle-class blacks and Hispanics who have not yet reached retirement age are more optimistic than whites that they will surpass the standard of living of their parents’ peak financial years; a majority of all three groups expect to have a better standard of living than their parents, however.
Expectations tend to vary by party identification. Democrats are largely optimistic about their future standard of living compared with their parents (81%); just 13% say it will be worse. Middle-class Republicans are less optimistic; 55% think their own standard of living will be better than that of their parents’ peak financial years, while three-in-ten think it will be worse (30%).
About eight-in-ten of the urban middle class (79%) think they will have a better standard of living than that of their parents’ peak financial years; 68% of suburban middle-class adults and 64% of rural middle-class adults say the same.
There is no difference in expectations between middle-class men and women ages 18 to 64 on this measure. Similarly, there are no substantial differences in expectations among middle-class adults ages 18 to 64 by education.
Gauging the Prospects for One’s Children
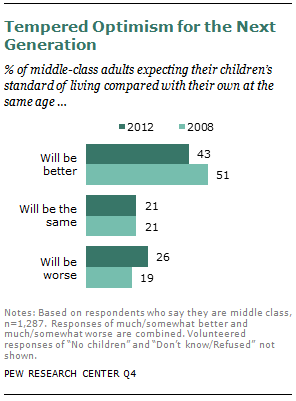
When it comes to the future, a plurality of middle-class adults think their children’s standard of living will be better than their own. Fully 43% think their children’s standard of living at the same stage of adult life will be better than their own, 21% think it will be about the same and 26% think their children will be worse off compared with their own standard of living.
While more middle-class adults are optimistic than pessimistic about their children’s future standard of living, that rosy glow is a little less pink today than it was in 2008, near the start of the recession. In 2008, half (51%) of middle-class adults expected their children to have a better standard of living (down 8 points to 43% today), 19% expected their children’s standard of living to be worse than their own (up 7 points to 26% today) and about two-in-ten (21%) thought it would be about the same.
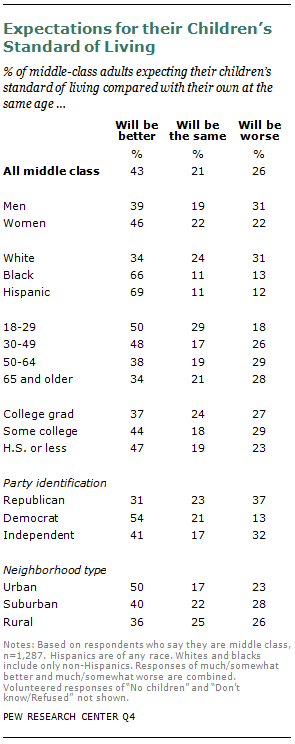
Hispanics and blacks are more optimistic than are middle-class whites about their children’s standard of living. About seven-in-ten middle-class Hispanics (69%) think their children’s standard of living will be better than their own at the same age, 12% think it will be worse and about one-in-ten (11%) think it will be about the same as theirs is now. Among middle-class blacks, two-thirds (66%) expect their children’s standard of living will outpace their own, 13% think it will be worse and about one-in-ten (11%) think it will be about the same as their own. By contrast, a third of middle-class whites (34%) expect their children’s standard of living will exceed their own, a nearly equal share (31%) think their children’s standard of living will be worse than theirs, and 24% think it will be about the same.
Middle-class adults under age 50 are more optimistic about their children’s future standard of living than are their older counterparts in the middle class. For example, among those ages 18 to 29, half (50%) think their children’s standard of living will exceed their own at the same point in life. Among those ages 65 and older, about a third (34%) say the same.
There is a tendency for middle-class adults with less education to be more optimistic about their children’s future than others in the middle class. Fully 47% of those with a high school diploma or less think their children’s standard of living will surpass their own; 37% of college graduates say the same.
Middle-class Democrats are more upbeat about the next generation’s standard of living than are Republicans; 54% of Democrats compared with 31% of Republicans think their children’s standard of living will exceed their own. Independents fall in between, with 41% expecting their children’s standard of living will surpass their own.
Middle-class urban dwellers are more upbeat about the financial future of their children than are those in the suburbs or rural areas. Half (50%) of middle-class urbanites think their children’s standard of living will be better than their own, compared with four-in-ten (40%) among the suburban middle class and 36% among the rural middle class.
Middle-class men tend to be more pessimistic than middle-class women about their children’s future standard of living. Three-in-ten middle-class men (31%) expect their children’s standard of living will be worse than theirs; 22% of middle-class women say this.
Costing Out a Middle-class Lifestyle

The survey also asked how much annual income a family of four would need to lead a middle-class lifestyle. The median response among those who consider themselves middle class is $70,000, meaning that half of middle-class adults say it would take more than $70,000 annually and half say it would take less than that amount.
Public estimates of how much money it takes for a family of four to live a middle-class lifestyle are quite close to the Pew Research Center’s analysis based on U.S. Census Bureau data that the median income for a four-person household is $68,274.12
As expected from the varying cost of living across the country, the annual family income seen as necessary for a middle-class lifestyle is a median of $85,000 in the East and $60,000 in the Midwest (with a median of $70,000 in both the South and the West). Similarly, the median among middle-class adults living in rural areas is $55,000; among suburban and urban dwellers it is $75,000 and $70,000, respectively.
Perceptions of income needs for a middle-class lifestyle vary with race and ethnicity. Among middle-class Hispanics, the median annual income needed for a middle-class lifestyle is $50,000, compared with $70,000 among middle-class whites and $75,000 among middle-class blacks.
Older adults in the middle class (ages 65 and older) have a lower income threshold for leading a middle-class lifestyle.
Education is also related to perceptions of income needs for a middle-class lifestyle; those who have more formal education tend to see higher annual incomes as necessary for a middle-class lifestyle compared with those who have less formal education.
As expected, one’s current annual income tends to be related to perceptions of the necessary annual income for a middle-class lifestyle.


