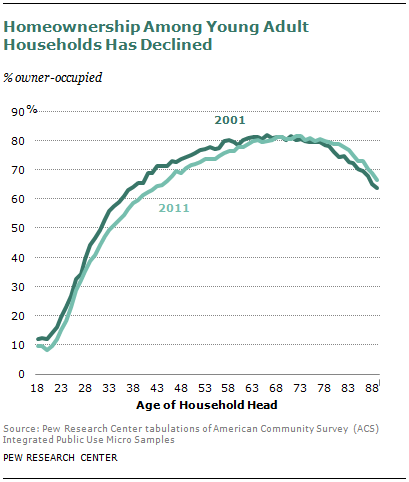
Homeownership has fallen over the decade, and younger households have experienced a greater decline than older households. Census Bureau data indicate that among households headed by those 65 and older, homeownership increased between 2001 and 2011. Homeownership among the nation’s seniors was at near-record levels in 2011 (Joint Center for Housing Studies, 2012). Among households headed by young adults, only 34% owned their home in 2011, down from 38% in 2001.
Though suggestive, this does not imply necessarily that young adults have become more reticent to purchase homes. The homeownership rate reveals the share of households who are owners at the survey date and reflects both the decisions of renters to become homeowners and the movement of homeowners to become renters (either voluntarily or through foreclosure). In principle the homeownership rate could be lower because fewer homeowners remain owners rather than homeownership having lost its allure to young renters.
New Homeowners
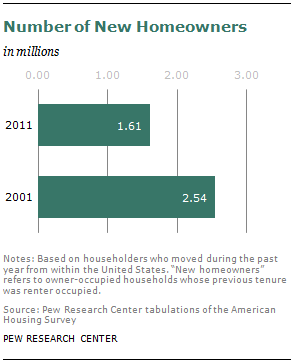
The American Housing Survey is a household survey that reveals the previous and current tenure of “recent movers,” that is, households who moved within the past year from within the United States. To gauge the attraction of homeownership, we can examine the number of “new homeowners” — recent movers who previously rented and now own their homes.
The ranks of new homeowners fell between 2001 and 2011. In 2001, 2.54 million previous renters became homeowners within the prior year. In 2011, 1.61 million renter-occupied households became homeowners within the prior year.
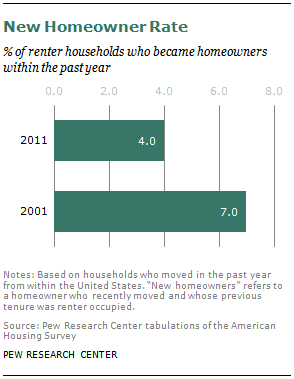
The number of new homeowners does not account for the size of the pool of renters who could have become homeowners. To adjust for changes in the number of renters who could have become owners, a rate is derived by dividing the number of new homeowners by the number of current renters and new homeowners.
In 2001, seven of every 100 renters moved and became a homeowner over the prior year. Moving into homeownership was substantially down by 2011. In 2011 only four of every 100 renters moved and became a homeowner.
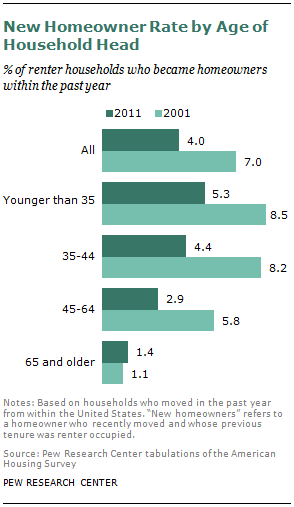
However, tabulating “new homeowner rates” by the age of the household head reveals that young adult households were not unique in increasingly staying put and continuing to rent. In 2011 about 53 out of every 1,000 eligible young adult renters moved and became a homeowner. This was much lower than the 85 out of every 1,000 eligible to become a homeowner in 2001. Very large declines in the new homeowner rate also occurred among renters aged 35 to 44 and 45 to 64. Only among renter households headed by those 65 and older was there an uptick in the movement into homeownership over the decade. So homeownership appears to have lost its allure for a wide swath of non-elderly households, not just young adult households.
New Renters
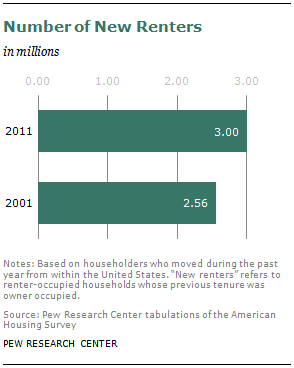
The recent mover data also illuminate the flows out of homeownership, or how many recent movers who previously were owner-occupied are now renters. In 2011, 3.0 million recent movers who were previously homeowners became renters. This is substantially greater than the flow into renter status observed in 2001, when 2.56 million prior homeowners became renters.
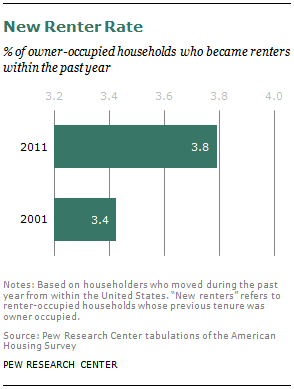
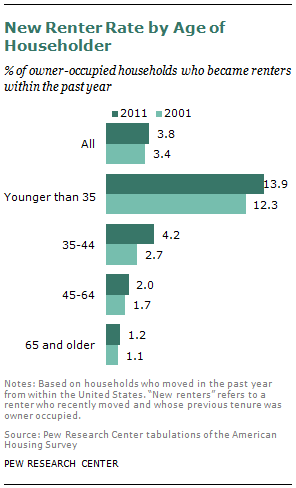
Adjusting for the pool of households eligible to become renters does not alter the conclusion that more homeowners became renters later in the decade than earlier. In 2001, 34 out of every 1,000 eligible homeowners became renters over the prior year. By 2011, the new renter rate upticked to 38 per 1,000 eligible.
The increased movement from homeownership to renting was concentrated among younger households, though not exclusively households younger than 35. In 2001, 123 out of every 1,000 eligible young adult homeowners became renters over the prior year. By 2011, the new renter rate among young adult homeowners had increased to 139. The new renter rate is much lower among households 35 and older and did not increase as much over the decade.
So the recent mover data suggest that the attraction to homeownership among renters clearly declined over the decade, but that tendency among young adults was no more protracted than among other adults. However, whether voluntarily or through foreclosure, homeowners can also become renters, and that tendency is much greater among young adults once one adjusts for the many fewer homeowners among young adult households.
The Dynamics of Young Adults in the Housing Market
The recent household mover data reveal how the predilections of young adult households have changed over the decade. In both 2001 and 2011 a similar number of young adult households moved within the past year (from within the United States): about 8.5 million in 2001 and 8.3 million in 2011. In both years, it was young adult households who tended to be on the move. In both years, about 15.5 million households were recent movers in toto, so the majority of recent movers in both years tended to be households headed by young adults.
In 2001 the flows into and out of homeownership among young adults roughly balance each other. About 1.3 million young adults who had been renters became homeowners over the prior year. However, in 2001 about 1.4 million young adult households who were previously homeowners became renters over the prior year.
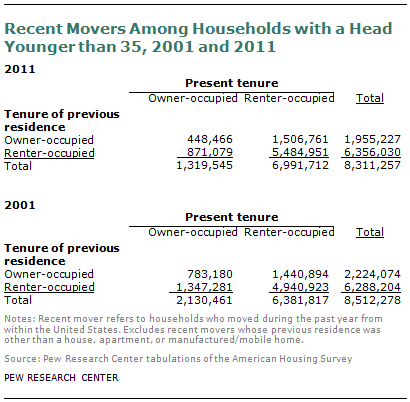
By 2011 the flows in and out of homeownership among young adults were more lopsided. About 1.5 million young adult households who were previously homeowners became renters. This outflow was not matched by a comparable inflow of renters into homeownership. In 2011 less than 0.9 million young adult renters became homeowners over the year. So the flow into homeownership among young adults was noticeably constricted in 2011 compared with 2001.
