One of the most significant changes in American society in the past half century is women’s increasing presence in the workplace. In 1965, 42% of women ages 16 to 64 were employed, about half of the rate among men (85%). Women’s employment rate rose steadily and peaked at 68% in 2000. In the past decade, the employment rate has dropped for both women and men, especially as the recession took a heavy toll on workers. By 2011, about 71% of men ages 16 to 64 were employed, as were 62% of women in the same age bracket.19
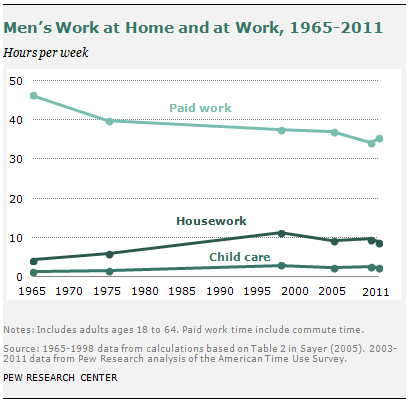
The changes in employment have affected how men and women use their time, both at work and at home. In 1965, working-age men (ages 18 to 64) on average spent 46 hours per week at paid work; by 2011, the number had fallen to about 35 hours per week.20 Working-age women doubled their time at paid work, from 15 hours per week in 1965 to 30 hours per week in 1998; the amount has gone down somewhat in the recent decade, to 25 hours per week in 2011.
On the home front, men are spending more time doing housework than they did in the 1960s, while women have cut back their hours in this area. Men’s housework time has doubled from four hours per week in 1965 to about nine hours per week in 2011. Women, meanwhile, have cut their housework time almost in half, from about 28 hours per week to 15 hours per week during the same period.
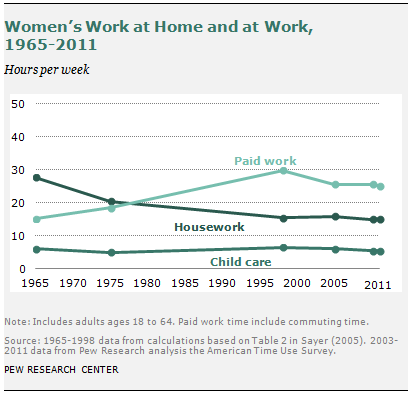
Child care time for men has increased over time, from one hour per week to about two hours. For women, the average time spent taking care of children has been relatively stable, ranging from five to six hours per week. Because not all men or women have children, the average child care time for all is much lower than it is for parents.
Child care: Married mothers with young children are the major driving force for the rise of women’s employment rate. In 1968, about 37% of working-age married women with young children were employed; in 2011, it was about 65%.21
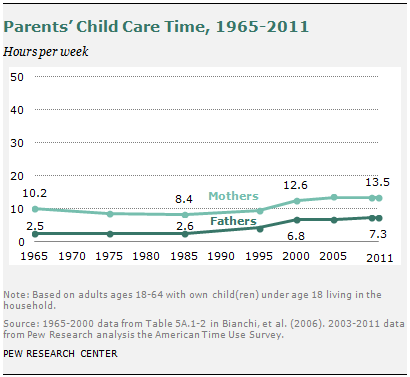
Despite the trend of more mothers working for pay, American parents’ time with children continues to go up. Fathers have nearly tripled the time they spend with their children (from 2.5 hours in 1965 to 7.3 hours today). After a slight decline in the 1970s and ’80s, mothers’ time with children has also increased, and today’s mothers spend more time with their children than mothers did in the 1960s.
The trend applies to both married and single parents, although married parents generally spend more time with their children than single parents. The time married mothers devoted to child care increased from 10.6 hours per week in 1965 to 14.3 hours per week in 2011, and married fathers’ time spent on child care increased from 2.6 hours to 7.2 hours during the same period. In contrast, single mothers increased the time they spend with their children from 5.8 hours per week in 1985 to 11.3 hours per week in 2011. Single fathers’ time with their children increased from less than one hour per week in 1985 to about eight hours per week in 2011.22
Despite the increase in child care time, American mothers still spend about twice as much time with their children as fathers do. In 2011, child care time was 7.3 hours per week for fathers and 13.5 hours per week for mothers.
What Do Parents Think about Child Care?
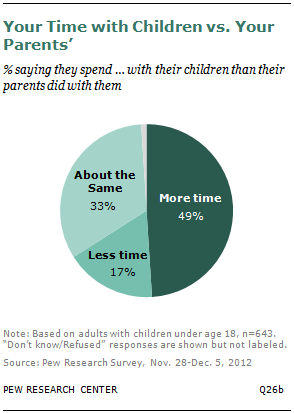
Public opinion toward child care time largely reflects these changes. When asked to compare the amount of time they spend with their children with how much time their parents spent with them, about half (49%) of adults with children under age 18 say they spend more time with their kids than their parents spent with them. One-third say they spend about the same amount of time, and only 17% say that they spend less time with their children than their own parents spent with them. Earlier surveys on this question in 1993 and 2009 show similar results.23
Married and unmarried parents hold similar views about this comparison, although unmarried parents are more likely than married parents to say that they spend less time with their kids than their parents spent with them (22% vs. 15%). Mothers working full time are more likely than mothers who either work part time or do not work for pay at all to say that they spend less time with their children than their parents spent with them (21% vs. 10%).
American parents generally feel OK about the amount of time they spend with their children. Six-in-ten parents with children under age 18 say that they spend the right amount of time with their children, while one-third say that the time they spend with their children is not enough. Married parents are more likely than unmarried parents to say that they spend the right amount of time with their children (64% vs.52%).
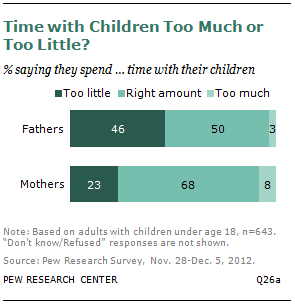
Time diary data show that fathers’ child care time is about half that of mothers, which may explain why fathers feel they spend insufficient time with their children. Some 46% of fathers with children under age 18 say that they spend too little time with their children. That is twice the share of mothers (23%) who say so. In contrast, the majority of mothers (68%) say that the time they spend with their children is about right, compared with half of fathers.
Working mothers are more likely than non-working mothers to say they spend too little time with their children (26% vs. 17%).
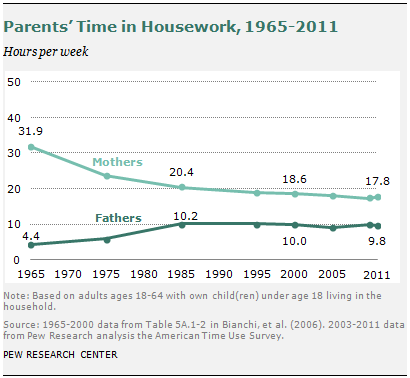
Housework: As with child care, American mothers spend more time than fathers doing housework. However, the gap has narrowed. In 1965, working-age mothers on average spent about 32 hours per week on housework—such chores as cleaning, cooking and laundry—while fathers spent about four hours per week on housework. Mothers’ time spent on housework has declined dramatically since the 1960s, and today’s mothers spend about half as much time doing household chores as mothers did in the 1960s. American fathers, meanwhile, are more involved in housework. Today’s fathers spend about 10 hours per week doing household chores—more than double the amount of time fathers spent on that in the mid-1960s. As a result, the gap between fathers’ and mothers’ time devoted to housework has decreased from 28 hours per week in 1965 to about eight hours per week in 2011.
The decline in time spent doing housework does not apply only to mothers. Working-age women in general have reduced their time in this area. And men overall, not just fathers, have increased the time they spend on housework activities. Wider use of household appliances such as washing machines and dryers, and dishwashers—not to mention the invention of microwave ovens—may have made time saving in household activities possible. In addition, as women and mothers spend more time at the workplace, they have less time available for household chores.
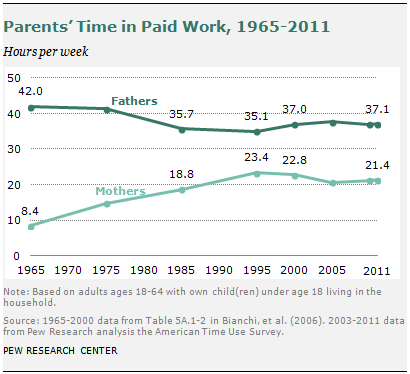
Paid work: Working-age American fathers spent 42 hours per week at paid work in 1965.24 Their paid work hours decreased gradually, hitting a low of 35 hours per week in the mid-1990s, and then crept back up over the past decade to about 37 hours per week. In contrast, mothers’ time in paid work has increased significantly since the 1960s, reaching a peak of 23 hours in the mid-1990s and then declining slightly.
As a result, the gap between fathers’ and mothers’ paid work time was the smallest in the mid-1990s (about 12 hours per week), and it increased to about 16 hours per week in 2011. But in both instances, the gap was much smaller than it was in the mid-1960s, when less than 40% of women with children under the age of 18 worked outside home,25 and the gap between fathers and mothers was nearly 34 hours per week.
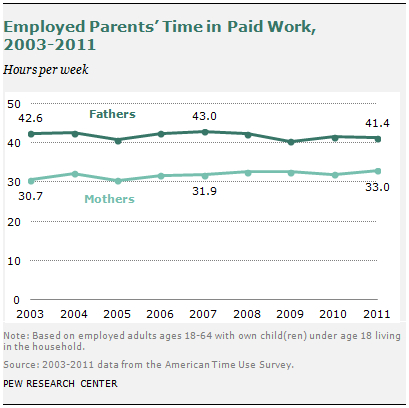
Time in paid work is determined largely by parents’ employment situation. The employment trend from 2003 to 2011 suggests that the share of mothers and fathers who are employed has gone down. However, among fathers who are employed, more are working part time: The share of employed fathers working part time increased from 3.8% in 2003 to 6.6% in 2011. Among working mothers, the share of part-time workers has changed only slightly during the same period, from 25.8% to 26.6%.26
The trend in paid work time among employed parents is somewhat different from the one among all parents. Employed mothers worked an average of 30.7 hours per week in 2003 and 33 hours per week in 2011. The opposite trend occurred for employed fathers; their time at work has declined from 42.6 hours per week in 2003 to 41.4 hours per week in 2011.
Commuting time is another factor that is related to the work time, even though it is unpaid. Between 2003 and 2011, commuting time for employed adults ages 18 to 64 went up from 2.8 hours per week to 3.2 hours. On average, men spend about one hour more per week commuting than women do. Parents’ commuting hours are similar to adults overall, and fathers spend more time commuting than do mothers.

