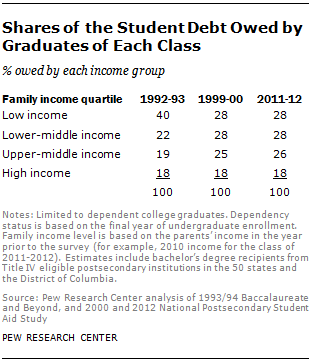
Another way of looking at changing patterns in student borrowing is to look at how all student debt is distributed across various groups. In the class of 1992-93, graduates from the lowest income quartile owed 40% of the class’ overall student debt. In other words, the poorest quarter of graduates owed 40% of the class’ aggregate debt.
Over time, student debt has become more evenly distributed across income groups. By 2011-12, graduates from the lowest income quartile owed 28% of the class’ overall student debt. The amount of debt owed by graduates from lower-middle and upper-middle income families increased over this time period, while the share owed by graduates in the highest income category held steady.
Since borrowing rates increased more for graduates from high-income families than for other graduates, why don’t they owe a greater share of the debt compared with the class of 1993? High-income graduates have become a greater proportion of borrowers over time. In the class of 1992-93, only 15% of borrowers were from the highest income quartile. Twenty years later, 19% of student borrowers are from the highest income quartile. But, their share of the debt depends not only on whether they borrow but on how much they borrow. Given the changes in the amounts borrowed, the share of the debt owed by graduates from the high-income families has not risen. In any event, a declining share of the debt incurred is owed by graduates from low-income families.

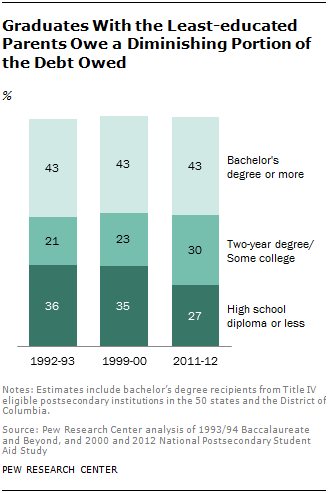
Similar shifts in the overall allocation of student debt are apparent when graduates are grouped according to their parents’ educational attainment. In the class of 1992-93, graduates whose parents’ education did not exceed high school owed 36% of the class’ debt. By 2011-12, graduates with similarly educated parents owed only 27% of the class’ education debt. The share of debt owed by graduates whose parents had some college education (but had not attained a bachelor’s degree) increased from 21% in the class of 1992-93 to 30% for the class of 2011-12
In the class of 1992-93, female graduates owed 53% of the class’ student debt. By 2011-12, female graduates owed 58% of the class’ debt (see figure in Appendix A).
The above changes in the ownership of the debt are partly influenced by changes in the composition of college graduating classes. For example, the fact that female graduates owed more of the debt (58%) in the class of 2011-12 compared with 1992-93 (53%) could be due to the fact that more college graduates are female and not to changes in borrowing behavior. However, the male-to-female ratio among college graduates has not changed enough to account for the shifting pattern in borrowing. In the class of 2011-12, 56% of the graduates were female, compared with 57% and 55%, respectively in the 1999-00 and 1992-93 class.


