Age
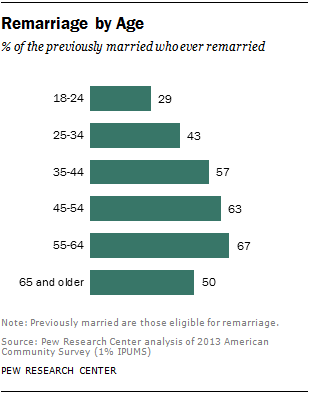
Remarriage is on the rise for Americans ages 55 and older, even as younger generations who have taken the plunge once are becoming less likely to have remarried. What has not changed is that older adults remain more likely to have remarried than their younger counterparts.
Remarriage generally becomes more common with age—not surprising, given that it takes some time to enter into one marriage, exit that marriage and then enter into a subsequent one.7 Only 29% of previously married adults ages 18 to 24 (admittedly a small group) had remarried in 2013, compared with 67% of those ages 55 to 64.
But the likelihood of having remarried has dropped sharply for those younger than 35. Among the small group of young adults who had already exited their first marriage, fully 72% had remarried by 1960. In 2013, only 42% of young adults who had been divorced or widowed had remarried.
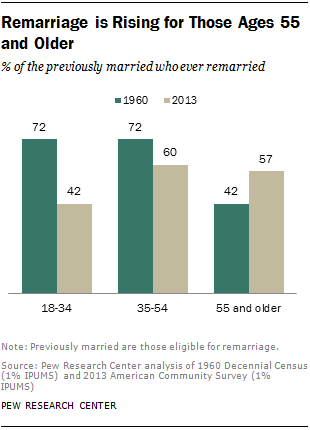
Over that same time period, the share of previously married adults ages 35 to 44 who had remarried dropped substantially (from 76% to 57%), and the share who had remarried among those ages 45 to 54 declined modestly (from 69% to 63%).
The trend in remarriage among adults ages 55 and older has gone in the opposite direction. In 2013, two-thirds (67%) of previously married adults ages 55 to 64 had remarried, up from 55% in 1960. And 50% of adults ages 65 and older had remarried, up from just 34% in 1960. These increases may in part be fueled by rising life expectancies. Some suggest that longer lifespans have contributed to increasing divorce at older ages as people realize they have many more years to live and want to find fulfillment in that extra time. The same factor may be contributing to increases in remarriage among older adults.8
Gender Gap in Remarriage
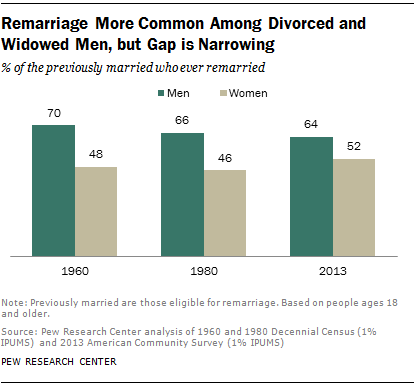
Among those eligible to remarry—adults whose first marriage ended in divorce or widowhood—men are much more likely than women to have taken the plunge again. In 2013, some 64% of eligible men had remarried, compared with 52% of women.9
This may reflect, in part, the fact that men who have been divorced or widowed are more likely to want to remarry than are similarly situated women. Some 29% of eligible men say they want to remarry, and 36% are not sure, according to a recent Pew Research Center survey; only 30% say they do not want to marry again. In contrast, just 15% of previously married women want to remarry, and 27% are not sure; about half of these women (54%) report that they do not want to remarry.
While the gender gap in the likelihood to marry again is notable, it has narrowed over time, as men have become somewhat less likely to remarry, and women have become somewhat more likely to do so. Today’s 12-point gap was a 20-point gap in 1980, when 66% of eligible men and 46% of women had remarried. In 1960, the gap was even larger—70% of eligible men had remarried, compared with 48% of women.
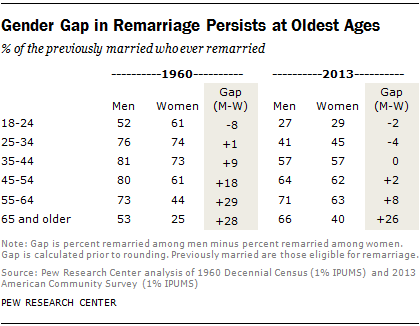
The gender gap has closed mainly among younger and middle-aged adults who are eligible to remarry. Divorced or widowed women ages 25 to 54 are now about as likely as men in that age range to have remarried. Among those ages 55 and older, the gap remains substantial.
Looking at educational attainment, the gender gap persists across groups but has narrowed most dramatically among those with a bachelor’s degree. In 1960, among college graduates, only 40% of divorced or widowed women had remarried, compared with 75% of men. By 2013, that share had risen to 52% among women, but had fallen to 67% among men. In less-educated groups, remarriage among women has remained stable during this time period, while it has declined markedly among men.
Race and Ethnicity
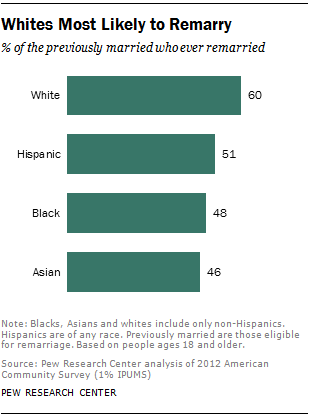
Among adults who have been divorced or widowed and are thus eligible to remarry, whites are the most likely to have married again, and this likelihood has increased somewhat in recent decades.10 By contrast, previously married Hispanic, black and Asian adults are less likely to have remarried than in the past. These patterns mirror those seen in rates of first marriage, where whites are more likely than blacks or Hispanics to enter into marriage for the first time.11
In 2012, six-in-ten whites who had been married before had remarried, compared with 51% of Hispanics, 48% of blacks, and 46% of Asians. Age composition is playing a role in these patterns—the fact that whites tend to be older may contribute to their higher likelihood of remarriage, for instance. However, some racial and ethnic differences persist, even controlling for age.
Over time, the share of previously married whites who remarry has increased somewhat, up from 55% in 1960. In contrast, remarriage has declined since 1960 for non-whites and Hispanics. At that time, 63% of blacks, 62% of Hispanics and 49% of Asians had remarried.
The increasing prevalence of remarriage among whites is driven entirely by increases among white women. In 1960, 47% of divorced or widowed white women had remarried, and this share rose to 55% by 2012. By contrast, the share of previously married white men who remarried declined from 69% to 66% over that same time period. For all other racial and ethnic groups, both men and women were less likely remarry in 2012 compared with 1960.
Looking at all currently married adults, one-fourth of whites (26%) and blacks (25%) had been married previously in 2012. This share was lower among married Hispanics (16%) and Asians (10%).
Nativity
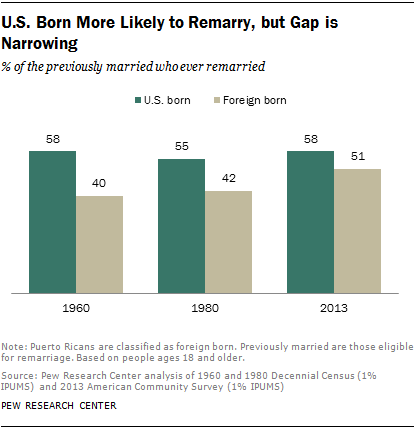
Among adults who are eligible to remarry, those born in the U.S. are more likely to do so than those born outside of the U.S., but the gap has narrowed over time as immigrants have become more likely to remarry.12 In 2013, 58% of divorced or widowed U.S.-born adults had remarried, compared with 51% among the foreign born. In 1960, those shares were 58% and 40%, respectively, and in 1980, the shares were 55% among the U.S. born and 42% among the foreign born.
Among all married adults, about a quarter (26%) of those born in the U.S. are remarried, compared with 14% of foreign-born adults.
Serial Remarriage: Who Has Married Three Times or More?
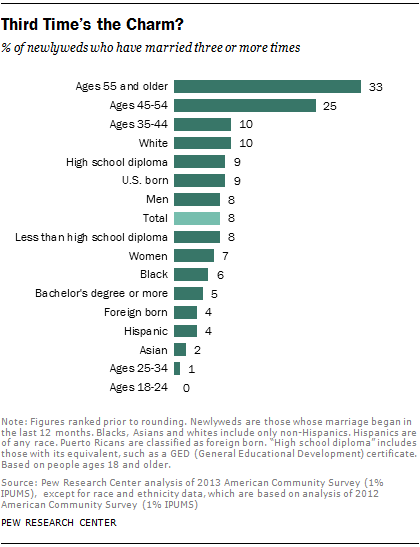
Among newly married adults in 2013 (those who had wed in the past 12 months), 29% had been married at least once before, and 8% had been married two or more times previously. Older newlyweds are among those most likely to be entering their third marriage. Fully 33% of those ages 55 and older fall into this category, as do 25% of those ages 45 to 54.
Not surprising, newly married adults younger than 45 were much less likely to be entering into (at least) their third marriage.
Newlyweds with just a high school diploma are almost twice as likely as those with a bachelor’s degree to be entering their third marriage (9% vs. 5%, respectively). Some 8% of newlyweds without a high school diploma have been married at least twice before.
Ten percent of white newlyweds have been married at least twice before, compared with 6% of blacks, 4% of Hispanics and just 2% of Asians.
Native-born newlyweds are twice as likely as foreign-born newlyweds to be entering a third (or higher order) marriage. Nine percent are doing so, compared with just 4% among the foreign born.


