Multiracial Americans are at the cutting edge of social and demographic change in the U.S.—young, proud, tolerant and growing at a rate three times as fast as the population as a whole.
As America becomes more racially diverse and social taboos against interracial marriage fade, a new Pew Research Center survey finds that majorities of multiracial adults are proud of their mixed-race background (60%) and feel their racial heritage has made them more open to other cultures (59%).
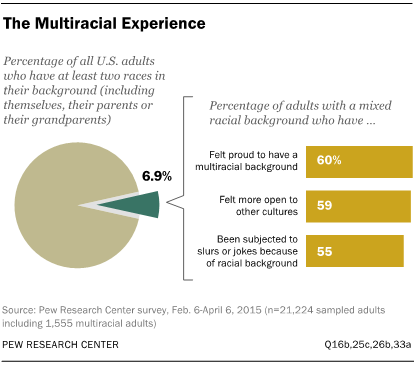
At the same time, a majority (55%) say they have been subjected to racial slurs or jokes, and about one-in-four (24%) have felt annoyed because people have made assumptions about their racial background. Still, few see their multiracial background as a liability. In fact, only 4% say having a mixed racial background has been a disadvantage in their life. About one-in-five (19%) say it has been an advantage, and 76% say it has made no difference.
While multiracial adults share some things in common, they cannot be easily categorized. Their experiences and attitudes differ significantly depending on the races that make up their background and how the world sees them. For example, multiracial adults with a black background—69% of whom say most people would view them as black or African American—have a set of experiences, attitudes and social interactions that are much more closely aligned with the black community. A different pattern emerges among multiracial Asian adults; biracial white and Asian adults feel more closely connected to whites than to Asians. Among biracial adults who are white and American Indian—the largest group of multiracial adults—ties to their Native American heritage are often faint: Only 22% say they have a lot in common with people in the U.S. who are American Indian, whereas 61% say they have a lot in common with whites.1
The U.S. Census Bureau finds that, in 2013, about 9 million Americans chose two or more racial categories when asked about their race.2 The Census Bureau first started allowing people to choose more than one racial category to describe themselves in 2000. Since then, the nation’s multiracial population has grown substantially. Between 2000 and 2010, the number of white and black biracial Americans more than doubled, while the population of adults with a white and Asian background increased by 87%. And during that decade, the nation elected as president Barack Obama—the son of a black father from Kenya and a white mother from Kansas.
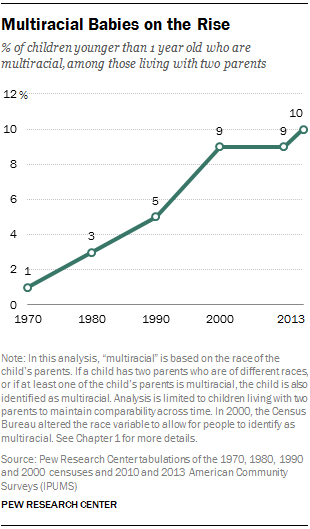
The share of multiracial babies has risen from 1% in 1970 to 10% in 2013.3 And with interracial marriages also on the rise, demographers expect this rapid growth to continue, if not quicken, in the decades to come.
Try our email course on the U.S. census
Learn about why and how the U.S. census is conducted through five short lessons delivered to your inbox every other day.
Sign up now!
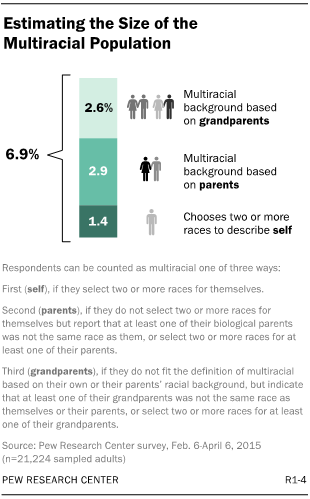
Yet the Pew Research survey findings suggest that the census’s estimate that 2.1% of the adult population is multiracial may understate the size of the country’s mixed-race population. Taking into account how adults describe their own race as well as the racial backgrounds of their parents and grandparents—which the census count does not do—Pew Research estimates that 6.9% of the U.S. adult population could be considered multiracial. This estimate comprises 1.4% in the survey who chose two or more races for themselves, an additional 2.9% who chose one race for themselves but said that at least one of their parents was a different race or multiracial, and 2.6% who are counted as multiracial because at least one of their grandparents was a different race than them or their parents.4
These findings emerge from a nationally representative survey of 1,555 multiracial Americans ages 18 and older, conducted online from Feb. 6 to April 6, 2015. The sample of multiracial adults was identified after contacting and collecting basic demographic information on more than 21,000 adults nationwide. For comparative purposes, an additional 1,495 adults from the general public were surveyed, including an oversample of non-Hispanic adults who are black and have no other races in their background and who are Asian and no race.
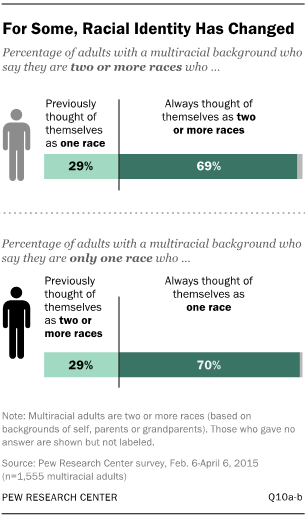
To be sure, not all adults with a mixed racial background consider themselves “multiracial.” In fact, 61% do not. An added layer of complexity is that racial identity can be fluid and may change over the course of one’s life, or even from one situation to another. About three-in-ten adults with a multiracial background say that they have changed the way they describe their race over the years—with some saying they once thought of themselves as only one race and now think of themselves as more than one race, and others saying just the opposite.
In addition to painting a portrait of multiracial Americans, the survey findings challenge some traditional ideas about race. The Census Bureau currently recognizes five racial categories: white, black or African American, American Indian or Alaska Native, Asian, and Native Hawaiian or Pacific Islander. Hispanic origin is asked about separately as an ethnicity and is not considered a race.
But when Latinos are asked whether they consider being Hispanic to be part of their racial or ethnic background, the survey finds that about two-thirds of Hispanics say it is, at least in part, their race. For the majority of this report, Hispanic origin is treated as an ethnicity, rather than a race, and multiracial Hispanics are those who say they are Hispanic and two separate races (for example, someone who is Hispanic and also chooses black and white as his or her races). This is consistent with how the Census Bureau counts mixed-race Hispanics. However, because Hispanic identity is tied to both race and ethnicity for many Latinos, Chapter 7 of this report explores a broader definition of mixed race.
The Multiracial Experience
The survey finds that many multiracial adults, like other racial minorities, have experienced some type of racial discrimination, from racist slurs to physical threats, because of their racial background.
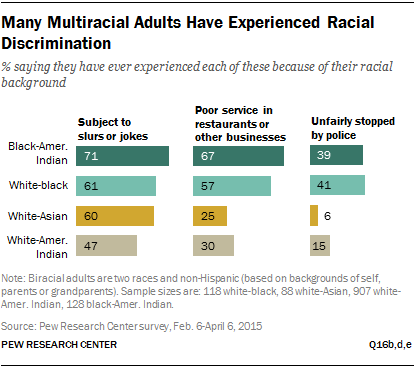
Again, the specific races that make up an individual’s background matter. For example, while about four-in-ten mixed-race adults with a black background say they have been unfairly stopped by the police because of their racial background, only 6% of biracial white and Asian adults and 15% of white and American Indian adults say they have had this experience. A similar pattern is evident for other types of racial discrimination.
For multiracial adults with a black background, experiences with discrimination closely mirror those of single-race blacks. Among adults who are black and no other race, 57% say they have received poor service in restaurants or other businesses, identical to the share of biracial black and white adults who say this has happened to them; and 42% of single-race blacks say they have been unfairly stopped by the police, as do 41% of biracial black and white adults. Mixed-race adults with an Asian background are about as likely to report being discriminated against as are single-race Asians, while multiracial adults with a white background are more likely than single-race whites to say they have experienced racial discrimination.
Demographically, multiracial Americans are younger—and strikingly so—than the country as a whole. According to Pew Research Center analysis of the 2013 American Community Survey, the median age of all multiracial Americans is 19, compared with 38 for single-race Americans.
The Pew Research survey finds that multiracial adults also are less likely than other adults to be college graduates and less likely to be currently married. But when they do wed, mixed-race Americans are more likely than other adults to marry someone who also is multiracial. Mixed-race adults are also more likely than the general public to have close friends or neighbors who are multiracial.
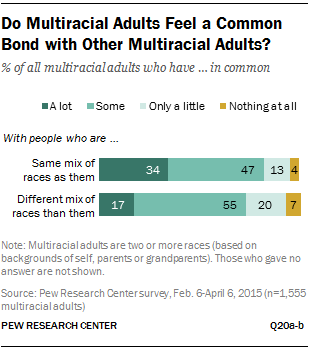
Even so, shared multiracial backgrounds do not necessarily translate into shared identity. Only about a third (34%) of all multiracial Americans think they have a lot in common with other adults who are the same racial mix that they are, while only half as many (17%) think they share a lot with multiracial Americans whose racial background is different from their own.
The Size of the Multiracial Population
It was less than 50 years ago that the U.S. Supreme Court, in the case bearing the evocative title Loving v. Virginia, struck down laws prohibiting mixed-race marriages. And it has been only 15 years since the U.S. Census Bureau first allowed Americans to choose more than one race when filling out their census form.
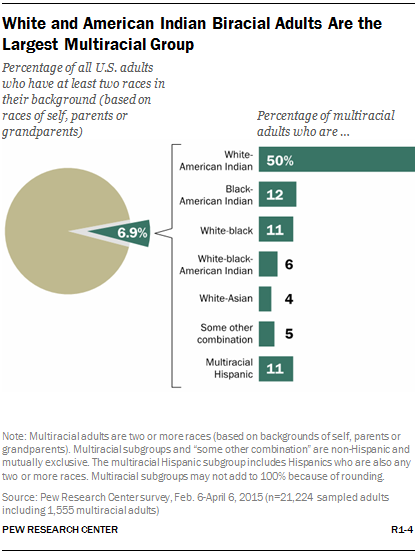
Since then the multiracial population has grown significantly. To measure its size, the Pew Research Center used a different method than the Census Bureau for determining an individual’s racial background. In addition to self-reported race, Pew Research took into account the racial backgrounds of parents and grandparents. This approach led to the estimate that multiracial adults currently make up 6.9% of the adult American population.
Using this definition, the Pew Research survey finds that biracial adults with a white and American Indian background comprise half of the country’s multiracial population—by far the country’s largest multiracial group but also the one whose members are the least likely to consider themselves “multiracial” despite their mixed-race background.5
Black and American Indian biracial adults account for an additional 12% of the total multiracial adult population, while those with a white and black background make up 11%. Those with white, black and American Indian in their racial background make up 6% of the mixed-race population, and white and Asian biracial adults account for 4%. An additional 11% are Hispanic multiracial adults.6 The remaining share of the mixed-race population is scattered across the 16 other combinations of races represented in the Pew Research sample.
The relatively small share of all U.S. adults who are mixed race obscures the rapid growth of the multiracial population. If current trends continue—and evidence suggests they may accelerate—the Census Bureau projects that the multiracial population will triple by 2060.
Feeding this growth is the increase in mixed-race couples and, as a natural consequence, births of children who have a multiracial background. For example, since 1980 the share of marriages between spouses of different races has increased almost fourfold (from 1.6% to 6.3% in 2013).
The share of multiracial children is growing at an even faster rate. In 1970, among babies living with two parents, only 1% had parents who were different races from each other. By 2013, that share had risen to 10%.7 Today, nearly half (46%) of all multiracial Americans are younger than 18. By contrast, only 23% of the overall U.S. population is under the age of 18.
As the multiracial population in the U.S. grows, its profile is also changing. While biracial white and American Indian is currently the predominant group among mixed-race adults, in 2013 a majority of mixed-race babies8 were either biracial white and black (36%) or biracial white and Asian (24%). Some 11% were white and American Indian.
The Multiracial Identity Gap
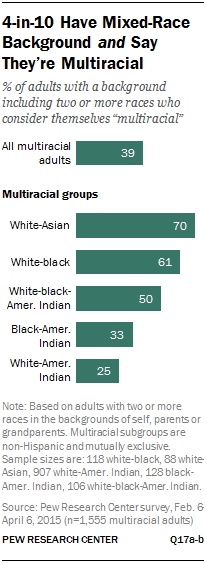
Multiracial identity is complicated, as much an attitude that can change over a lifetime as it is a genetic or biological certainty. Only four-in-ten adults with a mixed racial background (39%) say they consider themselves to be “mixed race or multiracial.” Fully 61% say they don’t consider themselves to be multiracial.
When asked why they don’t identify as multiracial, about half (47%) say it is because they look like one race. An identical share say they were raised as one race, while about four-in-ten (39%) say they closely identify with a single race. And about a third (34%) say they never knew the family member or ancestor who was a different race. (Individuals were allowed to select multiple reasons.)
This multiracial “identity gap” plays out in distinctly different ways in different mixed-race groups. A quarter of biracial adults with a white and American Indian background say they consider themselves multiracial. By contrast, seven-in-ten white and Asian biracial adults and 61% of those with a white and black background say they identify as multiracial.
For some mixed-race Americans, the pressure to identify as a single race is a significant part of the multiracial experience. According to the survey, about one-in-five (21%) say they have felt pressure from friends, family or “society in general” to identify as a single race.
A similar share says they have attempted to look or behave a certain way in order to influence the way others perceive their race.
Defining “Multiracial”
The way racial identity is classified in the U.S. has evolved over 200 years as Americans’ views about their own backgrounds have changed and as the racial and ethnic fabric of the nation has been transformed through immigration and demographic change. Nationally, the single largest data collection on Americans’ racial identity is the U.S. Census Bureau’s decennial census. The decennial census and other Census Bureau surveys now categorize people into the following racial groups: white, black or African American, American Indian or Alaskan Native, Asian, Native Hawaiian or other Pacific Islander and “some other race.” Prior to the 2000 census, respondents were allowed to choose only one racial category to describe themselves. Since 2000, respondents have had the option to choose more than one race. People who mark two or more races in their answer to the race question are included in the multiple-race population by the Census Bureau. Although respondents are also asked, in a separate question, about their Hispanic or Latino origin, only answers to the race question are used in classifying people into the multiple-race population.
While the definition of multiracial adults used in most of the analysis contained in this report is guided by the Census Bureau’s definition of race, we know that many Hispanics consider Hispanicity to be a race. In our survey, for example, roughly two-thirds of Hispanics say being Hispanic is part of their racial background. With that in mind, a separate part of our analysis includes an expanded definition of multiracial that includes Hispanics who report one census race for themselves, their parents and their grandparents and also say they consider being Hispanic part of their racial background. Chapter 7 of this report focuses on the experiences and attitudes of multiracial Hispanics, using both the census-based and the expanded definitions.
For a more detailed description of our methodology, see Appendix A.
Being Mixed Race
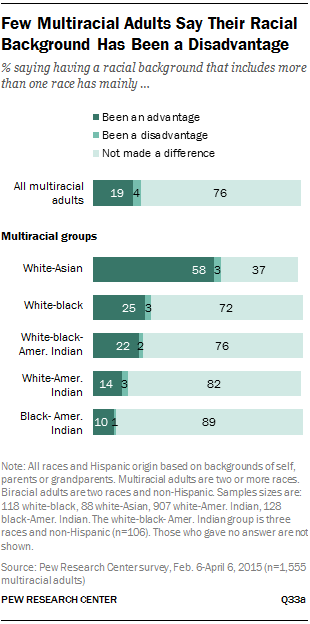
A majority of multiracial adults say they are proud of their mixed racial background (60%), more see their racial background as an advantage than a disadvantage (19% vs. 4%), and they overwhelmingly say they have rarely if ever felt ashamed or like an outsider because of their mixed racial background.
While these views are broadly shared by each of the five biggest multiracial groups, the large proportion of white and Asian biracial adults who see their racial background as an advantage stands out. About six-in-ten in this group (58%) say their racial background has been an advantage to them in life. In the other four groups, only about one-in-four or fewer say their racial heritage has been as helpful.
This contrast further sharpens when white and Asian biracial Americans are compared with single-race whites and Asians. According to the survey, white and Asian biracial Americans are even more likely than single-race whites (58% vs. 32%, respectively) or Asians (15%) to say their racial background has been an advantage.
Social Connections
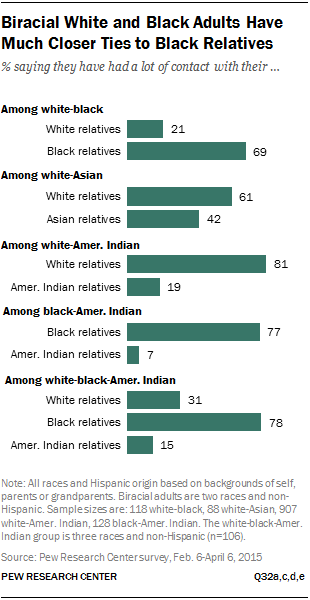
Mixed-race adults often straddle two or more worlds, and their experiences and relationships reflect that.
Overall, biracial adults who are both white and black are three times as likely to say they have a lot in common with people who are black than they do with whites (58% vs. 19%). They also feel more accepted by blacks than by whites (58% vs. 25% say they are accepted “very well”) and report having far more contact with their black relatives: 69% say they’ve had a lot of contact with family members who are black over the course of their lives, while just 21% report similar levels of contact with their white relatives. About four-in-ten (41%) say they have had no contact with family members who are white.
By contrast, biracial adults who are white and Asian say they have more in common with whites than they do with Asians (60% vs. 33%) and are more likely to say they feel accepted by whites than by Asians (62% vs. 47% say they are accepted “very well”). More also say they have had a lot of contact with family members who are white than say the same about Asian members of their family (61% vs. 42%).
For biracial adults who are white or black and American Indian, their connections with the white or black community are often stronger than the ones they feel toward Native Americans; about one-in-four or fewer in each group say they have a lot in common with American Indians.
Other survey findings suggest these differences may slow the development of a multiracial group identity similar to the sense of linked fate and shared experience that unites many blacks and other minority groups.9 Overall, the Pew Research survey finds that few multiracial adults think they have much in common with other mixed-race Americans—even those who share their racial background.
Marriage and Friendships
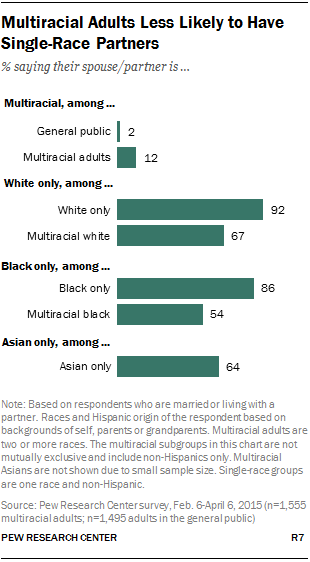
As a group, mixed-race adults are much more likely than all married adults to have a spouse or partner who is also multiracial, the survey finds. Among all mixed-race adults who are married or living with a partner, about one-in-eight (12%) say their spouse or partner is two or more races. By comparison, only 2% of adults among the general public who are married or living with a partner say the same.
The survey also finds that multiracial adults with a white background are significantly less likely than single-race whites to have a white partner (67% vs. 92%). Multiracial adults with a black background are also less likely than single-race blacks to have a spouse or partner who is black only (54% vs. 86%).10
A similar pattern emerges when the focus turns to the friendships formed by multiracial Americans. Mixed-race adults are more likely than the general public to have friends who are multiracial. According to the survey, eight-in-ten multiracial adults say at least some of their friends are mixed-race, compared with 62% for all adults.
The Politics of Multiracial Americans
Overall, the politics of multiracial Americans resemble the country as a whole. About six-in-ten (57%) multiracial adults identify with or lean toward the Democratic Party, while 37% support or lean toward the Republican Party, and 6% favor neither major party. Among the general public, about half (53%) tend to favor Democrats, while 41% support or lean toward the GOP.
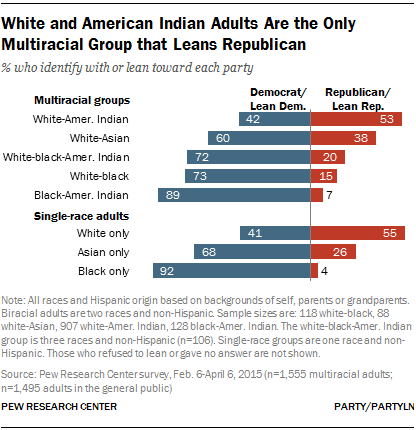
But just as the country is a mix of individuals and groups with different party preferences and ideological leanings, multiracial Americans are likewise politically diverse.
Multiracial Americans with a black background favor the Democratic Party, similar to the party preferences of single-race blacks. For example, about nine-in-ten biracial black and American Indian adults (89%) identify or lean toward the Democratic Party, as do 92% of all single-race blacks. By contrast, single-race whites favor the Republican Party over the Democrats by a ratio of 55% to 41%.
White and Asian biracial adults also tend to favor the Democratic Party over the GOP (60% vs. 38%), roughly similar to the 68% to 26% advantage held by Democrats among single-race Asians.
The political leanings of biracial white and American Indians—the country’s largest multiracial group—closely resemble those of single-race whites. Among this group, the Republican Party holds a 53% to 42% advantage over the Democrats, making it the only major mixed-race group that tilts toward the GOP. (The sample of single-race Native Americans was too small to analyze.)
The remainder of this report examines in greater detail the attitudes, experiences and demographics of multiracial Americans. Chapter 1 traces the history of efforts by the U.S. Census Bureau to measure race and reports on the latest government estimates of the size of the multiracial population. Chapter 2 describes how the Pew Research Center used a different method than the Census Bureau to measure racial background and how that method produces a significantly larger estimate of the country’s multiracial population. Chapter 3 describes how multiracial adults see their own racial identity and how they believe others see their racial background. Chapter 4 focuses on how the racial backgrounds of the country’s largest multiracial groups shape their attitudes and experiences in different ways, including the likelihood they have encountered racial discrimination. Chapter 5 describes the social connections of multiracial Americans, including how much mixed-race adults say they have in common with other races and how accepted they feel by different racial groups. Chapter 6 examines the party preferences and political ideology of multiracial adults as well as their views on abortion, aid to the poor, marijuana legalization and other issues. Chapter 7 reports on the elements of Hispanic identity and the percentage of Hispanics who consider their Hispanic background to be, at least in part, their race. It also explores an expanded definition of multiracial adults that includes Hispanics who are one race but say they consider their Hispanic background to be part of their racial background.
Other Key Findings
- In their ideological preferences, white and American Indian biracial adults are the only group where political conservatives outnumber liberals (37% to 18%), virtually identical to the ideological preferences of single-race whites. Biracial Americans who are white and Asian or white and black tilt toward the political left.
- Few multiracial adults (9%) say a relative or member of their extended family has treated them badly because they are mixed race. But these experiences vary considerably by multiracial group. For example, white and black biracial adults are much more likely than adults with a biracial white and American Indian background to say they have been treated badly by a family member (21% vs. 4%).
- Today’s mixed-race parents are more likely to have talked to their own children about being multiracial. Fully 46% of multiracial parents say they talked to their adult children when they were growing up about having a mixed-race background. By contrast, about a third (32%) say their parents had similar conversations with them.
- One-in-four mixed-race adults say people are often or sometimes confused by their racial background. And one-in-five (19%) say that they have felt like they were a go-between or “bridge” between different racial groups.
- For multiracial adults, as for the general public, race is not the most important element of their personal identity. Some 26% of multiracial adults say their racial background is “essential” to their identity (as do 28% of all adults). Both multiracial adults and the general public are much more likely to point to gender (50% for multiracial adults, 51% for the general public) or religion (39% for both groups) as essential parts of their identity.
Notes on Terminology
The terms “multiracial” and “mixed race” are used interchangeably throughout this report. For more details on how the sample of multiracial adults was defined, see the “Defining ‘Multiracial’” textbox on page 13 or Appendix A. “Adults” are those who are ages 18 and older.
Unless otherwise noted, survey results based on all multiracial adults include Hispanics who are two or more races. In analysis of the Pew Research survey, biracial groups and other subgroups such as “multiracial whites” include only non-Hispanics. Single-race whites, blacks and Asians include only non-Hispanics. In the analysis of multiracial subgroups based on census data (in Chapter 1), Hispanics are included.
Throughout this report, the terms “American Indian” and “Native American” are used interchangeably and “Amer. Indian” is used as an abbreviation in charts and tables. Alaska Natives are included among those with some American Indian background in the survey analysis.
The terms “Latino” and “Hispanic” are used interchangeably.
The terms “black” and “African American” are used interchangeably.