To understand how U.S. adults see their own masculinity and femininity, we asked men and women to rate themselves on two scales:
- A masculinity scale from 0 to 4, where 0 means not at all masculine and 4 means extremely masculine.
- A femininity scale from 0 to 4, where 0 means not at all feminine and 4 means extremely feminine.
We then subtracted ratings on the femininity scale from ratings on the masculinity scale to come up with an overall rating for each respondent. For example, if someone rated themselves a 4 on the masculinity scale and a 1 on the femininity scale, their overall rating would be 3. We created the following categories based on overall ratings:
- Highly masculine (4, 3)
- Lean masculine (2, 1)
- Neither masculine nor feminine or equally masculine and feminine (0)
- Lean feminine (-1, -2)
- Highly feminine (-3, -4)
How men and women rate themselves on a masculine-feminine scale
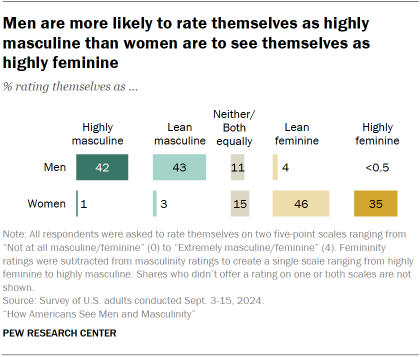
Overall, 42% of men rate themselves as highly masculine, while a similar share (43%) lean masculine. About one-in-ten men (11%) are neither masculine nor feminine or equally both, and 4% say they either lean feminine or are highly feminine.
Among women, 35% rate themselves as highly feminine. A higher share (46%) lean feminine, while 15% are neither feminine nor masculine, or both equally. And 4% of women say they either lean masculine or are highly masculine.
The number of people in the survey who do not identify as a man or a woman is too small to analyze separately.
Differences by race and ethnicity
Among men
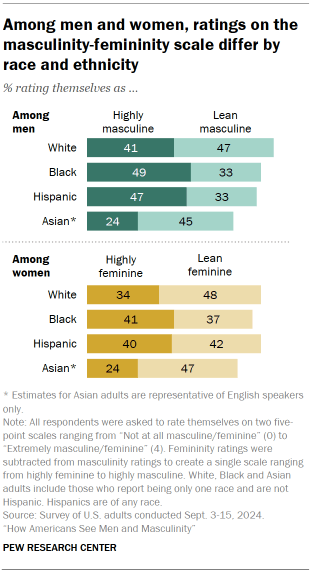
About four-in-ten or more White (41%), Hispanic (47%) and Black (49%) men rate themselves as highly masculine. A smaller share of Asian men (24%) see themselves this way.
Among Asian men, 31% rate themselves in the middle or on the feminine side of the scale, as do 20% of Hispanic men and 18% of Black men. These shares are higher than the 10% of White men who rate themselves this way.
Among women
About four-in-ten Black (41%) and Hispanic (40%) women rate themselves as highly feminine. These are higher than the shares of White (34%) and Asian (24%) women who rate themselves this way.
About three-in-ten Asian women (29%) say they are either in the middle or on the masculine side of the scale, as do 21% of Black women and 17% each among Hispanic and White women.
Differences by age
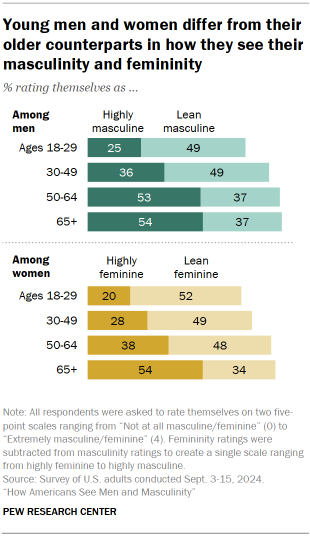
Men under 30 are less likely than older men to rate themselves as highly masculine. A quarter of young men see themselves this way, compared with 36% of men ages 30 to 49 and just over half of those 50 to 64 (53%) or 65 and older (54%).
Similarly, younger women are less likely than older women to rate themselves as highly feminine. But those ages 65 and older stand out as being far more likely than women in any other age group to see themselves this way. Some 54% of women in the oldest age group rate themselves as highly feminine, compared with 38% of those ages 50 to 64, 28% of those 30 to 49, and 20% of women under 30.
Among both men and women, age differences remain when looking separately at Democrats and Republicans.
Differences by party and ideology
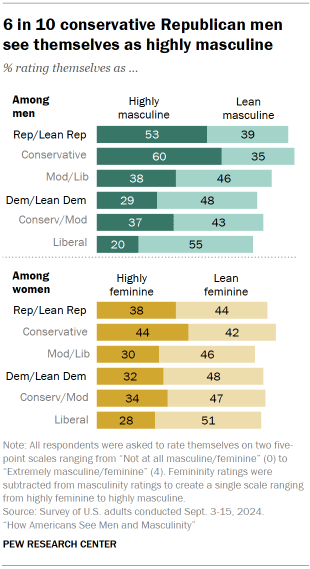
Republican and Republican-leaning men (53%) are far more likely than men who identify with or lean toward the Democratic Party (29%) to rate themselves as highly masculine.
Among women, 38% of Republicans see themselves as highly feminine, compared with 32% of Democrats.
Republican men who describe their political views as conservative are the most likely to rate themselves as highly masculine (60%). In turn, liberal Democratic men are the least likely to rate themselves this way (20%).
Among women, conservative Republicans also stand out. Some 44% of women in this group rate themselves as highly feminine, compared with 30% of moderate or liberal Republican women, 34% of moderate or conservative Democratic women, and 28% of liberal Democratic women.
Among Democratic men, ratings differ considerably by race and ethnicity. Some 47% of Black Democratic men and 39% of Hispanic Democratic men rate themselves as highly masculine. These shares are much larger than the 22% of White Democratic men who rate themselves this way.
White (53%) and Hispanic (54%) Republican men are about equally likely to rate themselves as highly masculine.
(There aren’t enough Asian Democratic or Republican men or Black Republican men in the sample to analyze separately.)
Influences on views about what it means to be a man or a woman
We also asked men and women about factors that may have influenced their views of what it means to be a man or a woman, respectively.
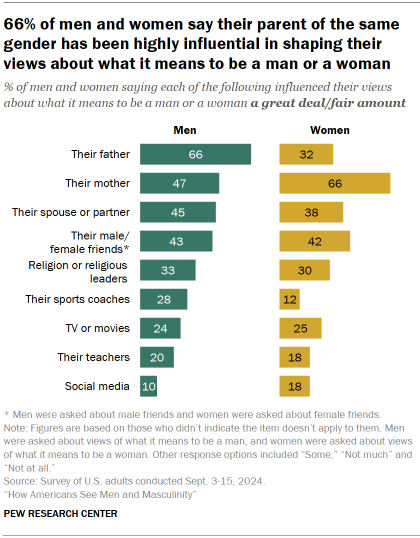
In many ways, sources of influence don’t vary much by gender. For example, most men (66%) say their father influenced their views about how to be a man a great deal or a fair amount. The same share of women say their mother influenced their views on being a woman.
Interestingly, men are more likely to say their mother had a lot of influence on their views about what it means to be a man (47%) than women are to say their father influenced their views about being a woman (32%).
(The figures in this analysis exclude those who say the item does not apply to them.)
Beyond their parents, similar shares of men and women point to each of the following as having a great deal or a fair amount of influence on their views:
- Their friends of the same gender
- Religion or religious leaders
- Television or movies
- Their teachers
There are some differences, however. Men (28%) are more than twice as likely as women (12%) to say sports coaches have had a great deal or a fair amount of influence on their views.
In turn, women are more likely than men to point to social media as a source of influence. About two-in-ten women (18%) say social media has had at least a fair amount of influence on their views of what it means to be a woman. One-in-ten men say social media has influenced their views on being a man.
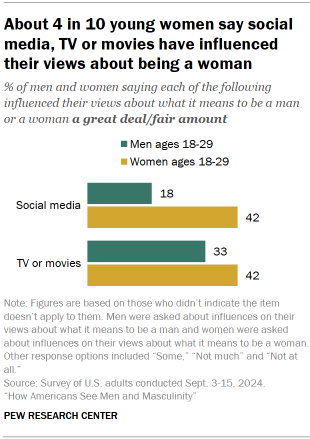
Men and women ages 18 to 29 are more likely than their older counterparts to say social media and TV or movies have influenced their views a great deal or a fair amount. But the share saying this is much higher among young women than among young men.
Among adults under 30, about four-in-ten women say social media (42%) and TV or movies (42%) have had at least a fair amount of influence. A third of young men say the same about TV or movies, while 18% say social media has had at least a fair amount of impact.
Differences among men
For the most part, the shares of men across demographic and partisan groups that say each of the items has had a great deal or a fair amount of influence on their views about what it means to be a man vary little if at all. But there are some notable differences.
Republican and Republican-leaning men are more likely than Democratic and Democratic leaners to say their father (72% vs. 58%) and religion or religious leaders (40% vs. 23%) have had at least a fair amount of influence on their views of what it means to be a man.
Some 44% of Black men say religion or religious leaders have influenced their views about being a man. This is larger than the shares of Hispanic (32%), White (31%) or Asian (24%) men who say the same.
Men under 30 (18%) are much more likely than men ages 30 to 49 (9%), 50 to 64 (8%) and 65 and older (5%) to say social media has had at least a fair amount of influence. And 33% of young men say the same about TV or movies, compared with smaller shares of those ages 30 to 49 (26%), 50 to 64 (19%) and 65 and older (18%).
Differences among women
As is the case among men, there is little variation, if any, in the shares of women who report each of the items has been highly influential. But there are some differences across partisan and demographic groups.
Republican women (35%) are more likely than Democratic women (25%) to point to religion or religious leaders as a highly influential factor in their views about what it means to be woman. And Black women (41%) are more likely to say this than Hispanic (31%), Asian (31%) or White (27%).
Additionally, a larger share of Black women (72%) than White (66%) or Hispanic (59%) women say their mother had at least a fair amount of influence in their views on being a woman. In fact, roughly half of Black women (49%) say their mother had a great deal of influence, compared with 37% of White women, 38% of Hispanic women and 32% of Asian women.
Women under 30 are more likely than women in older groups to say each of the following has influenced their views at least a fair amount:
- Their female friends: 51% of women ages 18 to 29, 42% of those 30 to 49, 38% of those 50 to 64, and 39% of those 65 and older.
- TV or movies: 42% of women ages 18 to 29, 27% of those 30 to 49, 21% of those 50 to 64, and 13% of those 65 and older.
- Social media: 42% of women ages 18 to 29, 17% of those 30 to 49, 8% of those 50 to 64, and 6% of those 65 and older.