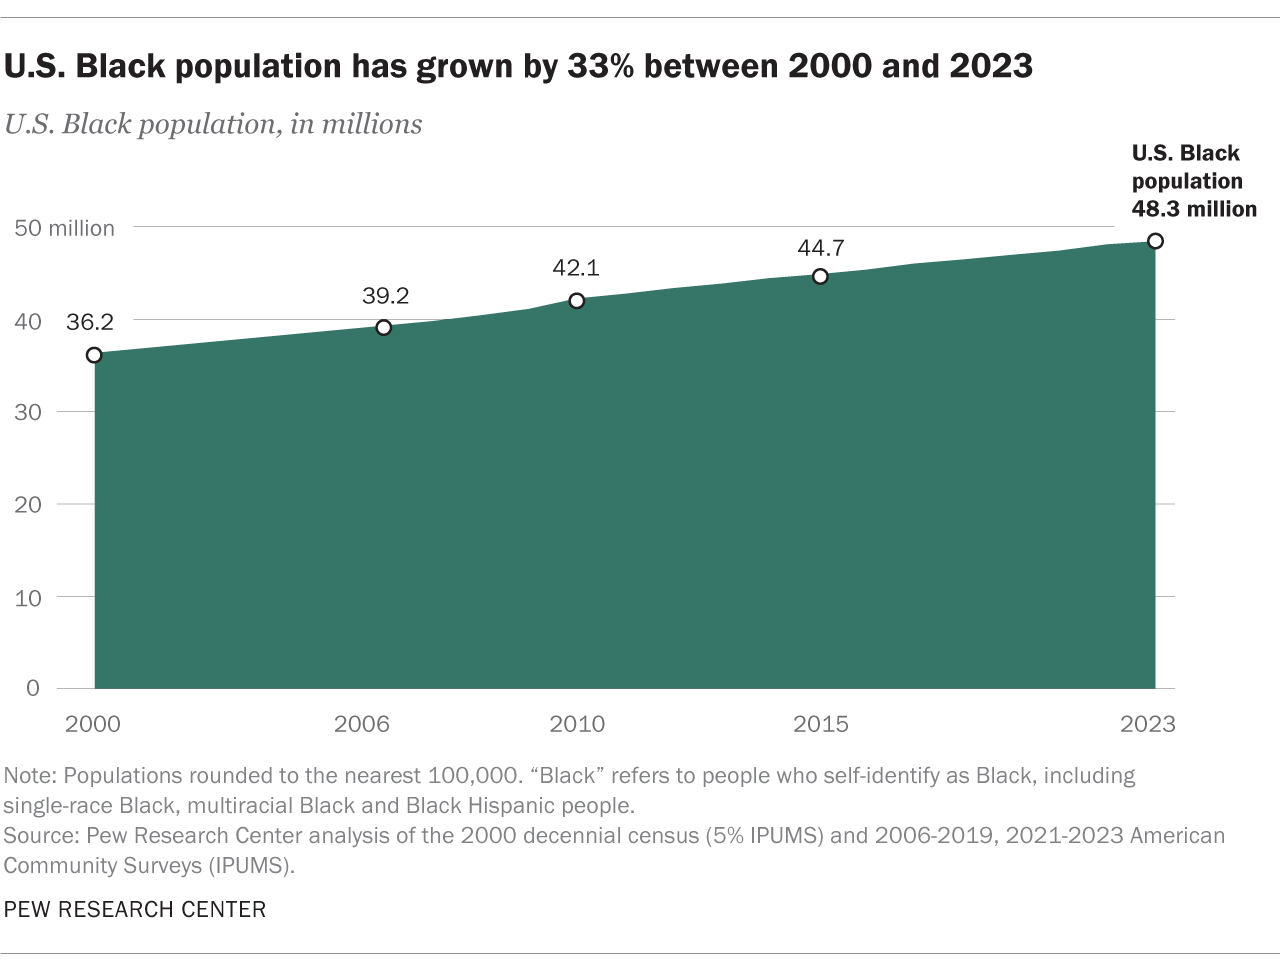
The Black population of the United States is growing. In 2023, an estimated 48.3 million people self-identified as Black, making up 14.4% of the country’s population. This marks a 33% increase since 2000, when there were 36.2 million Black people living in the U.S.
The Black American population is diverse. This group consists of people with varied racial and ethnic identities and experiences. It includes those who say their race is Black, either alone or in combination with other racial backgrounds. It also includes Hispanics who say their race is Black (though this group is not necessarily the same as the Afro-Latino population).
This fact sheet is a profile of the demographic, geographic and economic characteristics of the U.S. Black population in 2023, presented through the lens of four different groups:
- The total U.S. Black population
- Single-race, non-Hispanic Black people
- Multiracial, non-Hispanic Black people
- Black Hispanic people
Scroll down or click through the navigation list to learn more.
Click here for a downloadable spreadsheet of these findings.
Related: Key facts about the U.S. Black population
Population growth
Contents
An estimated 48.3 million people in the U.S. identified as Black in 2023. The Black population has grown by more than 12 million since 2000, up from 36.2 million – a 33% increase over roughly two decades.
In 2023, more than 5 million Black Americans were foreign born, about 11% of the U.S. Black population. (Read the cautionary note in “How we did this” about data on immigrants.) This is an increase from 2000, when 2.4 million people, or 7%, among the Black population were foreign born.
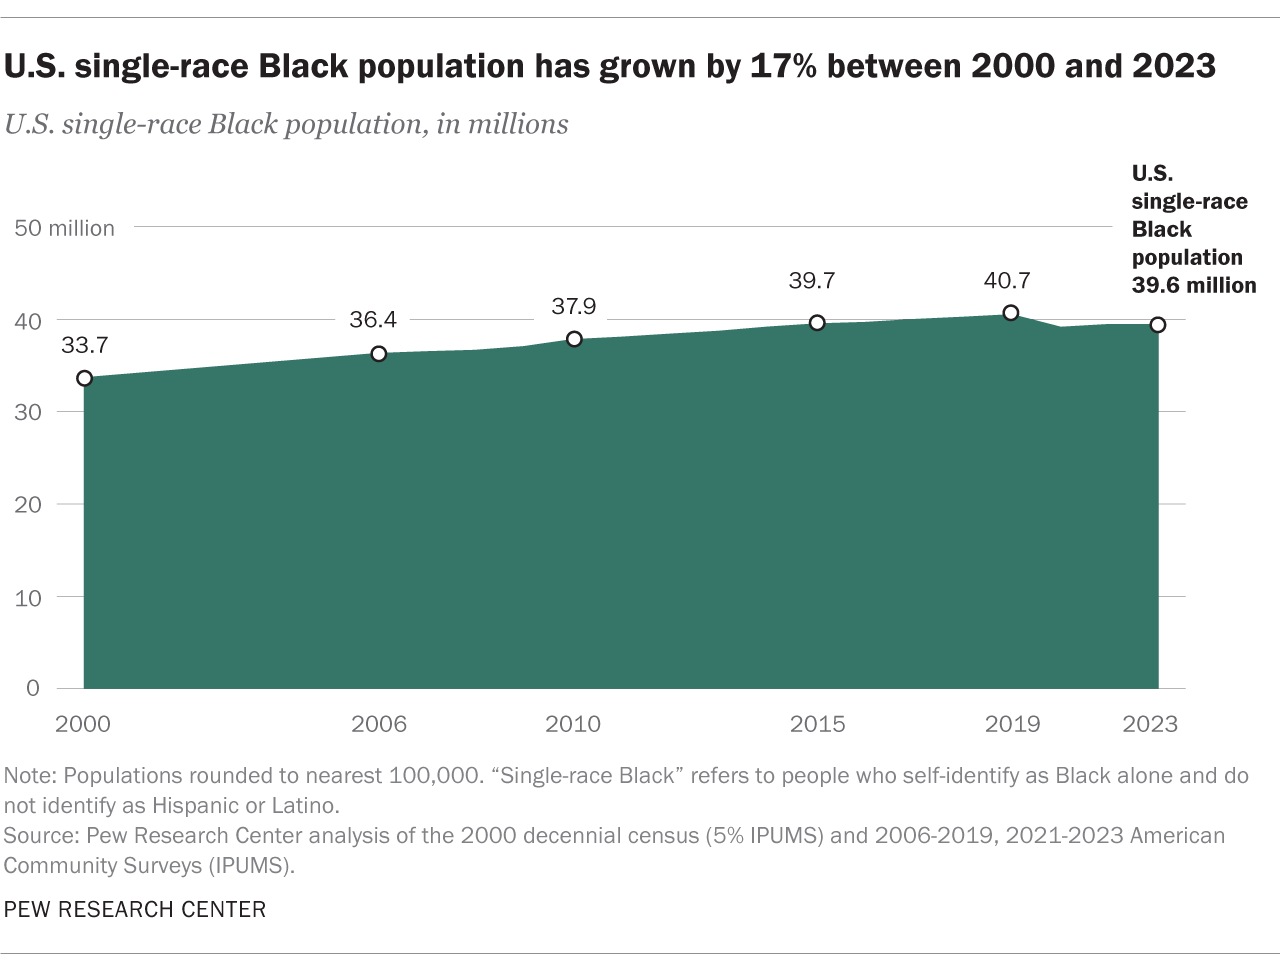
In 2023, the single-race, non-Hispanic Black population was the largest demographic subgroup of U.S. Black population, numbering 39.6 million or 82% of the total. The population has grown 17% since 2000, when the population was 33.7 million.
More than 4 million members of this population are immigrants from other countries, meaning 11% of single-race Black people are foreign born in 2023. (Read the cautionary note in “How we did this” about data on immigrants.) This is an increase since 2000, when 1.9 million people (roughly 6%) among the Black alone, non-Hispanic population were foreign born.
The share of the U.S. population who self-identify with more than one race has grown in recent years. Part of this is due to changes in how the U.S. Census Bureau asks about ethnic and racial identity. Starting in 2000, the Census Bureau has provided respondents with the option to identify as more than one race. And in 2020, further changes to both the decennial census form and the Census Bureau’s approach to coding responses led to a marked spike in the number of Americans who say they are of two or more races. Additionally, younger people are more likely to identify with multiple racial or ethnic identities, on forms or otherwise.
Some people with multiple racial identities in their family history do not describe their racial identity as two or more races. This suggests there is likely a discrepancy between the number of multiracial Black people in the U.S., as reported through demographic data analysis, and the number of multiracial Black people who identify in this way.
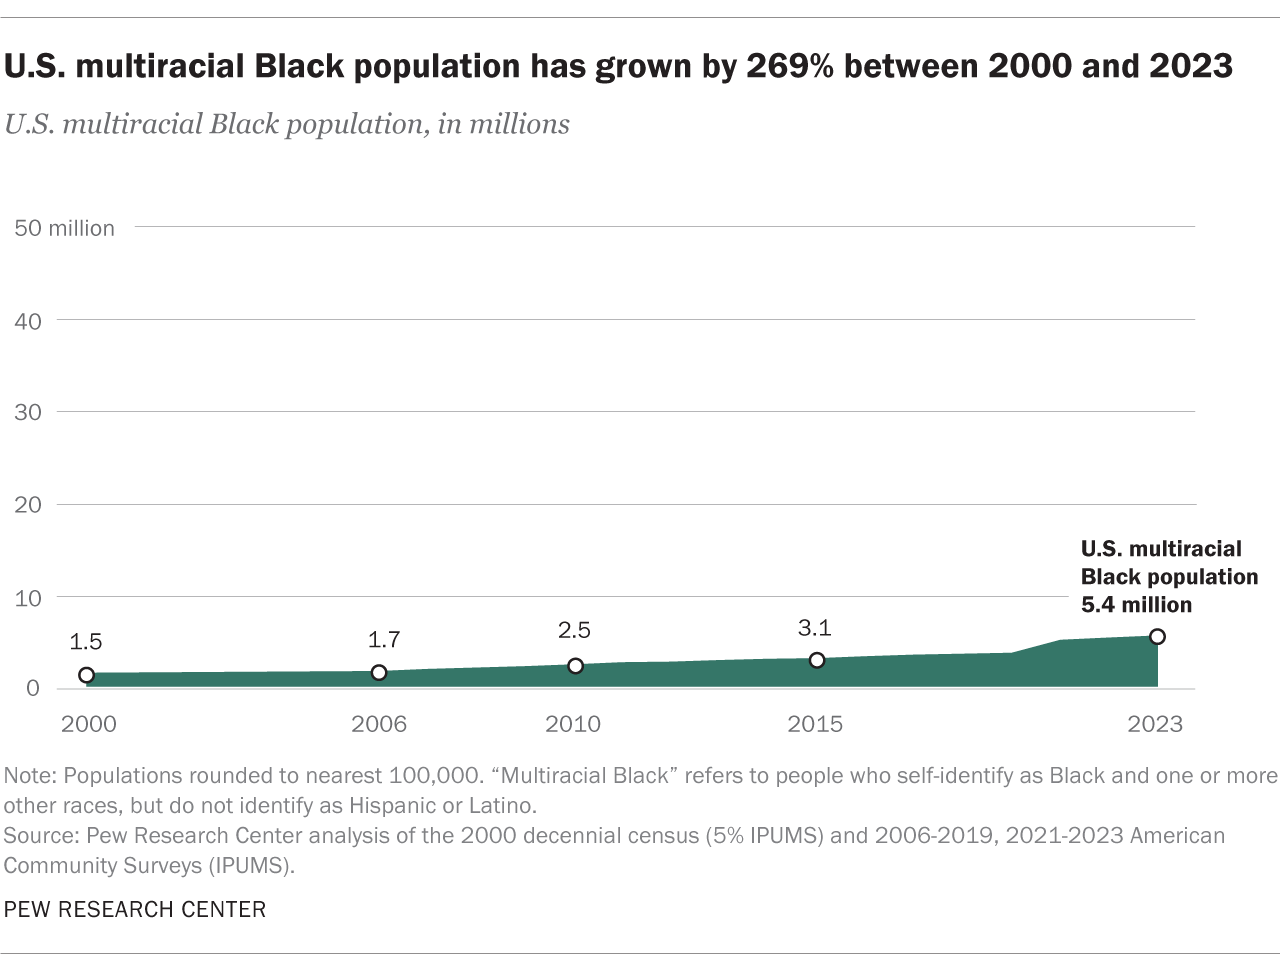
The multiracial non-Hispanic Black population is the second-largest subgroup among Black Americans, with 5.6 million people – accounting for 12% of the overall Black population in 2023. It has grown from 1.5 million in 2000, a 269% increase.
Additionally, more than 400,000 multiracial Black people (8%) are foreign born as of 2023. (Read the cautionary note in “How we did this” about data on immigrants.) The number of foreign-born members of this group has increased from 250,000 people in 2000, but their share of the multiracial Black population has decreased from 16% in 2000.
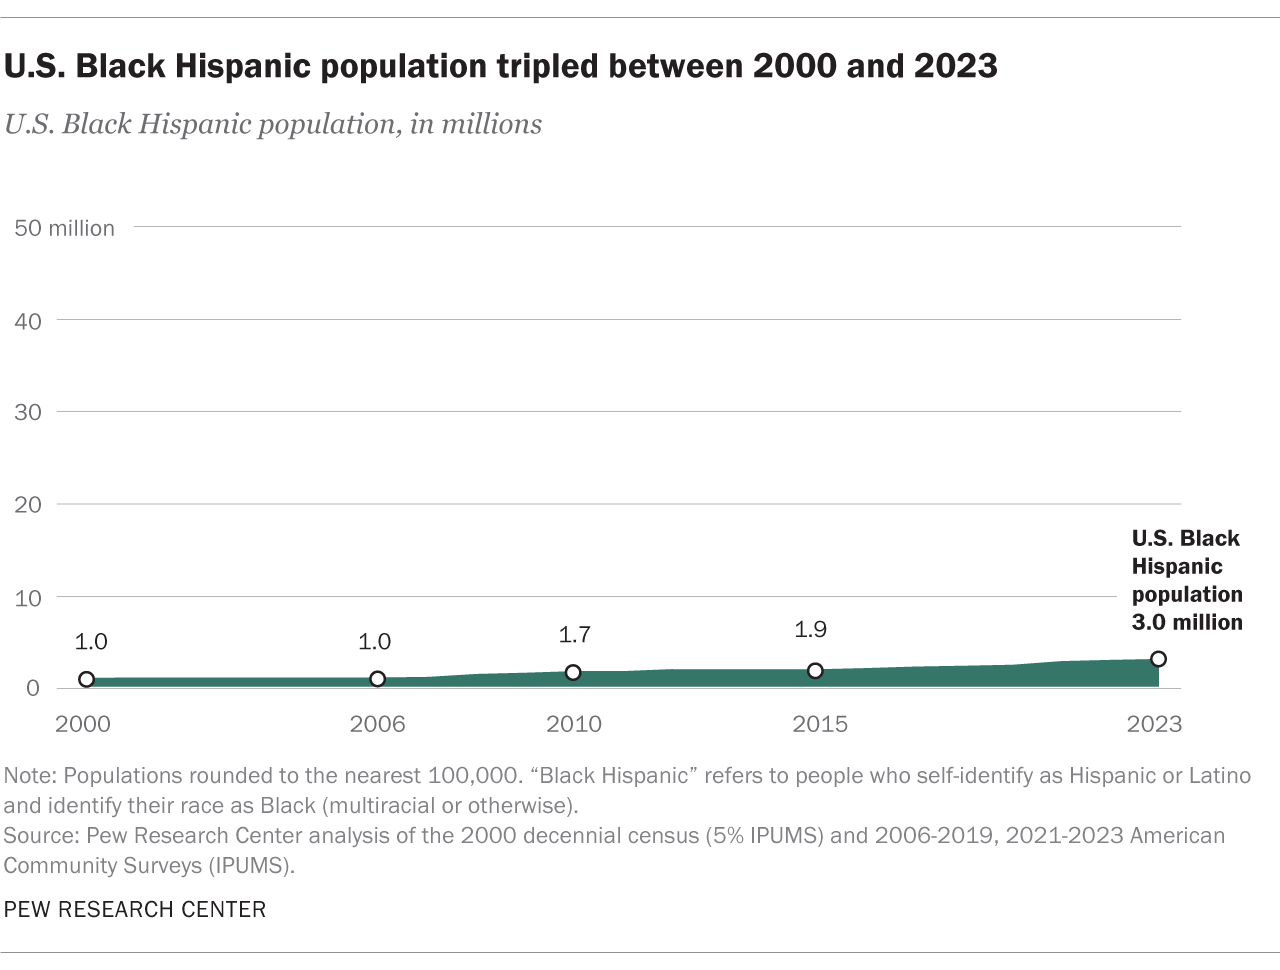
There were 3.0 million Black Hispanic people in the U.S. in 2023, or 6% of the total Black population, making this subgroup the smallest population group in this analysis. This population has grown from 980,000 in 2000, an increase of 210%.
Additionally, more than 600,000 Black Hispanics are immigrants to the U.S., which means nearly one-in-five Black Hispanics (19%) are foreign born. (Read the cautionary note in “How we did this” about data on immigrants.) The number of foreign-born members of this group has increased from 260,000 people in 2000, but their share of the Black Hispanic population has decreased from 27% in 2000.
Notably, the Black Hispanic U.S. population is not necessarily the same as the nation’s Afro-Latino population. Not all people who say they are Black and Hispanic identify as Afro-Latino, and not all Afro-Latinos self-identify as Black, Hispanic or with both identities.
Age structure
Contents
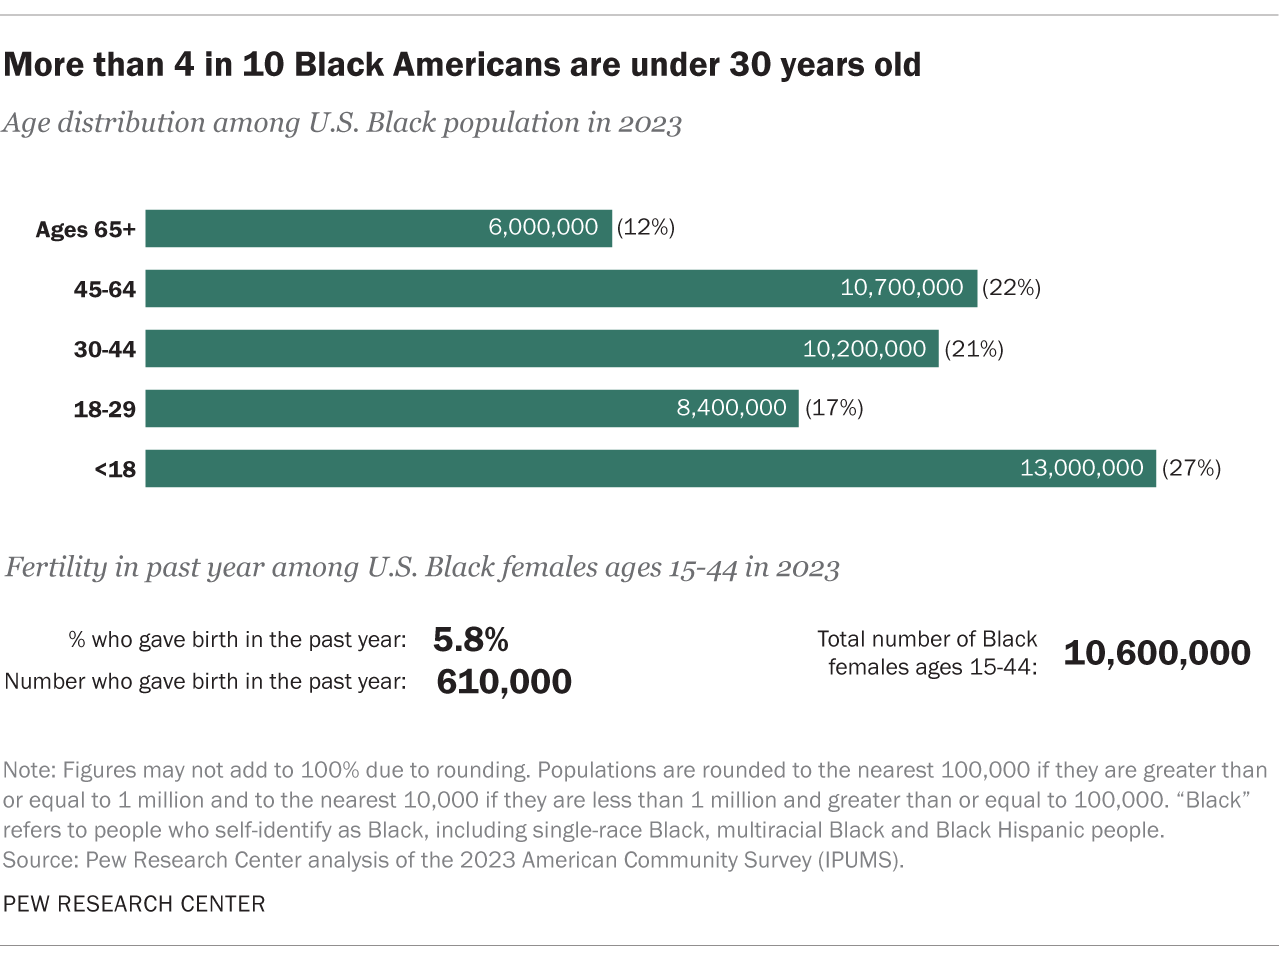
The U.S. Black population is young. The median age of Black people in 2023 was 32.6 years, about six years younger than the U.S. population’s median age of 38.2. Roughly 30% of the entire Black population was below the age of 20, while 12% were 65 or older.
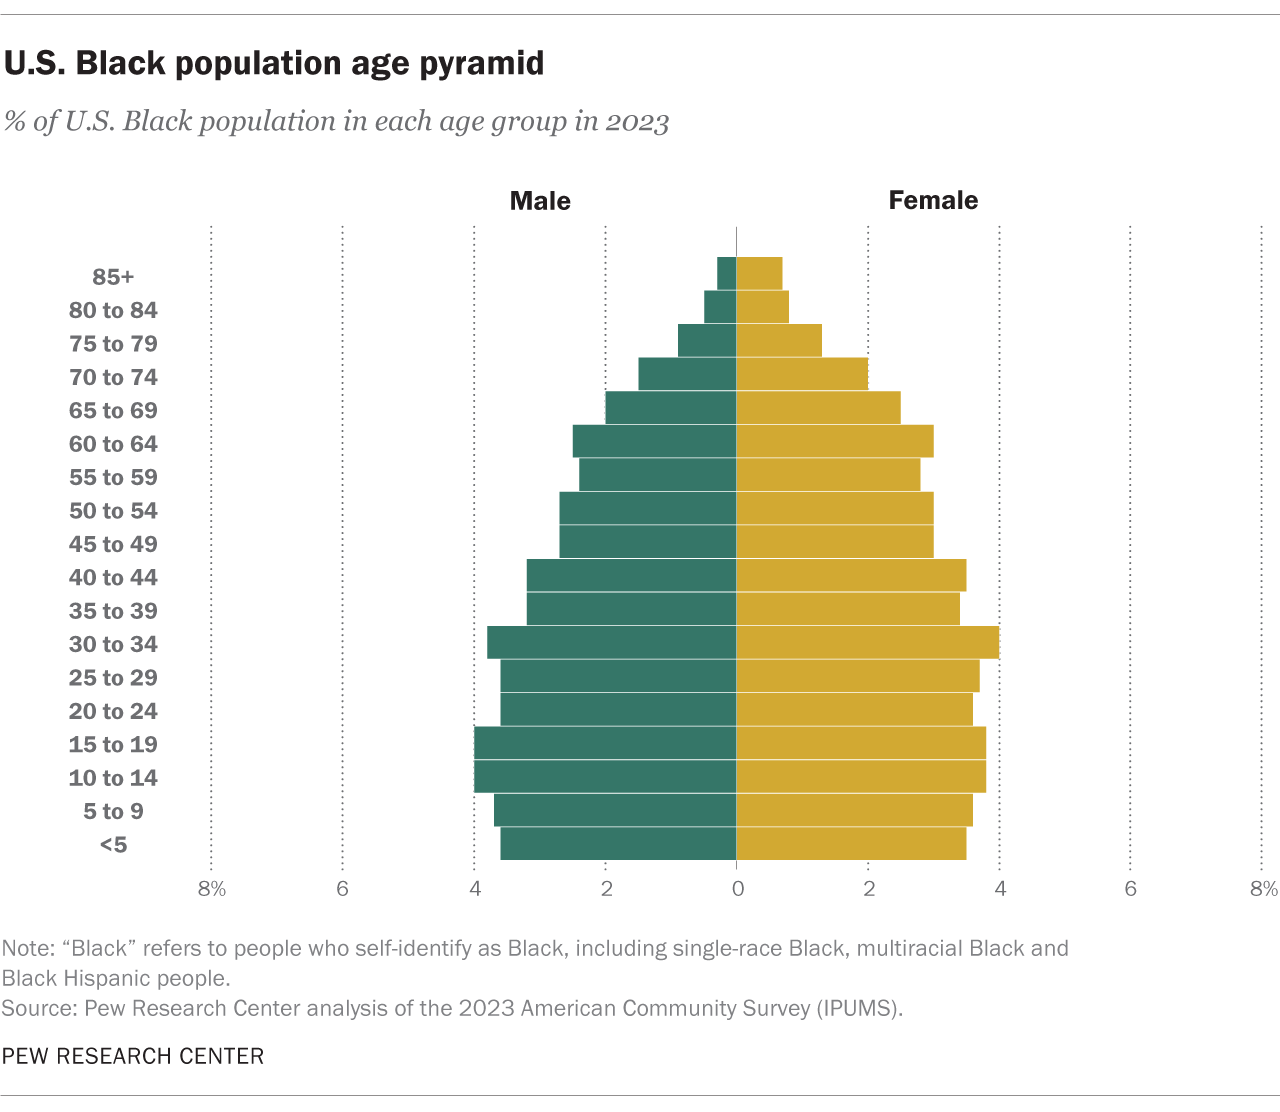
More than four-in-ten Black Americans (44%) were younger than 30 in 2023. A similar share (43%) were between 30 and 64 years old.
About a quarter of Black Americans are under 18 years old (27%).
Fertility in the past year
The general fertility rate among Black females ages 15 to 44 was 5.8% in 2023, meaning that 5.8% of females in this age group had a birth in the previous 12 months.
The single-race, non-Hispanic Black population is young. The median age of the group in 2023 was 35.4, about three years younger than the full U.S. population’s median age of 38.2. Roughly 26% of the single-race Black population was below the age of 20, and 14% were 65 or older.
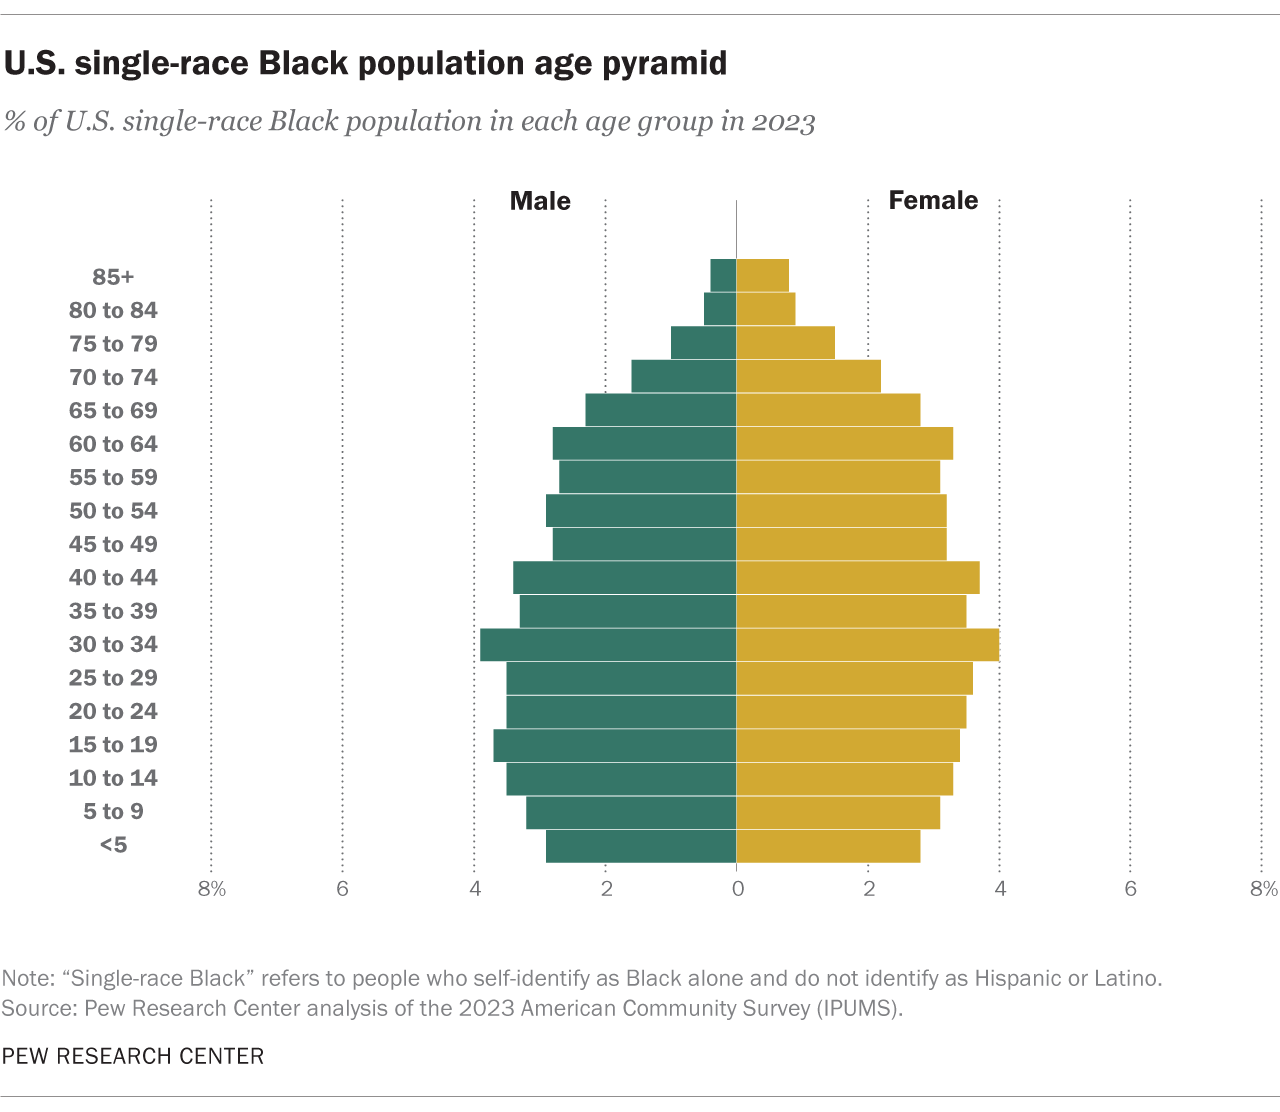
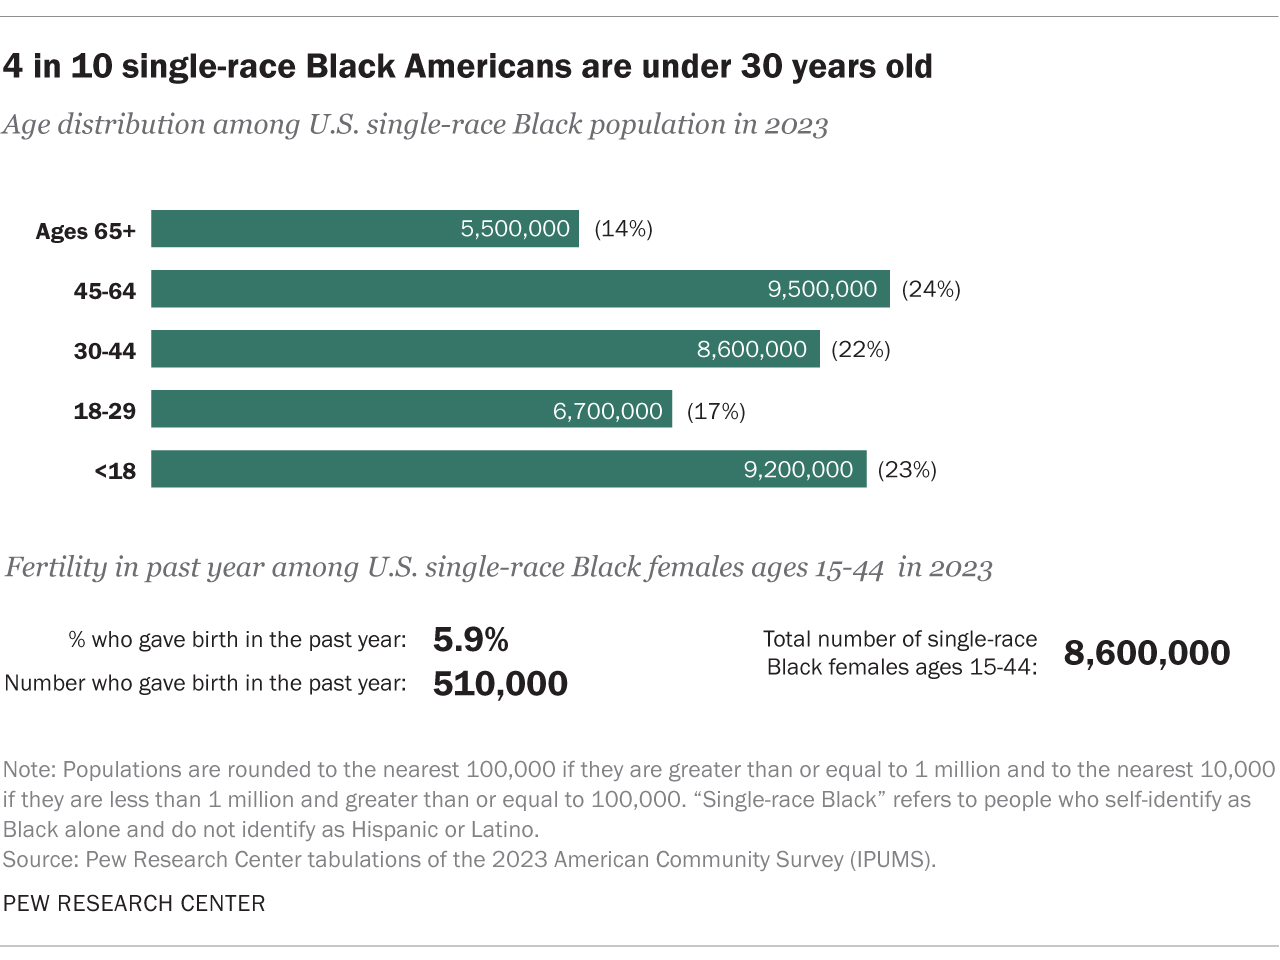
Among the single-race non-Hispanic Black population in the U.S., 40% were under 30 in 2023. An additional 46% were ages 30 to 64.
Some 23% of this group are under 18 years old.
Fertility in the past year
The general fertility rate among single-race non-Hispanic Black females ages 15 to 44 in the U.S. was 5.9% in 2023, meaning that 5.9% of females in this age group had a birth in the previous 12 months.
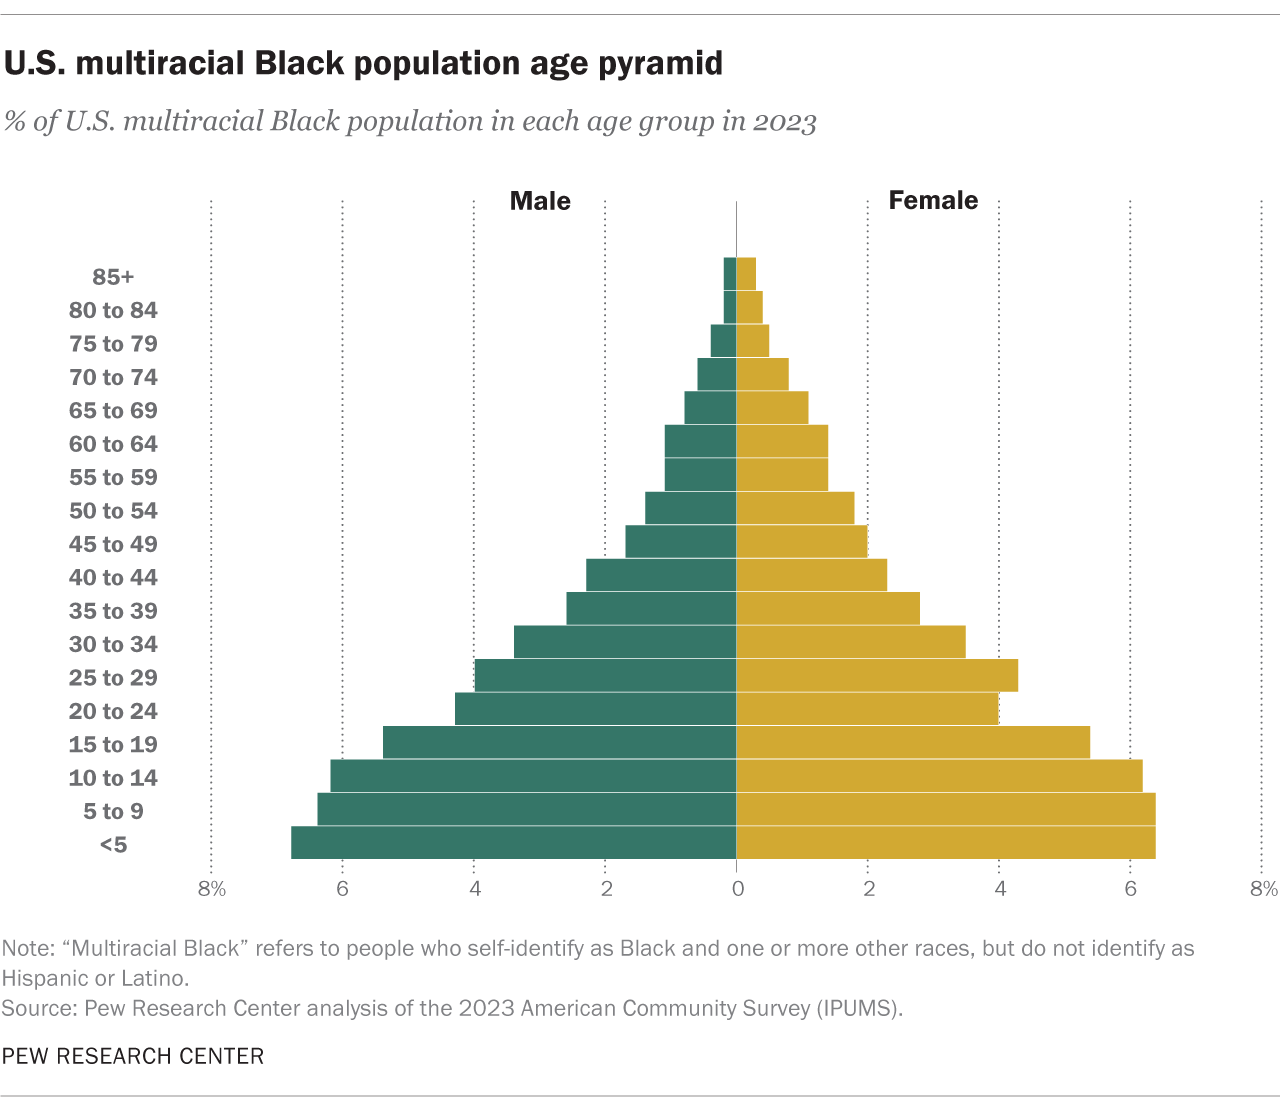
The multiracial, non-Hispanic Black population is particularly young. The median age of the group in 2023 was 19.5, making this the youngest subgroup of the Black population and significantly younger than the U.S. population overall (median age of 38.2). About half (49%) of the multiracial Black population was below the age of 20 in 2023, and only 5% were age 65 or older.
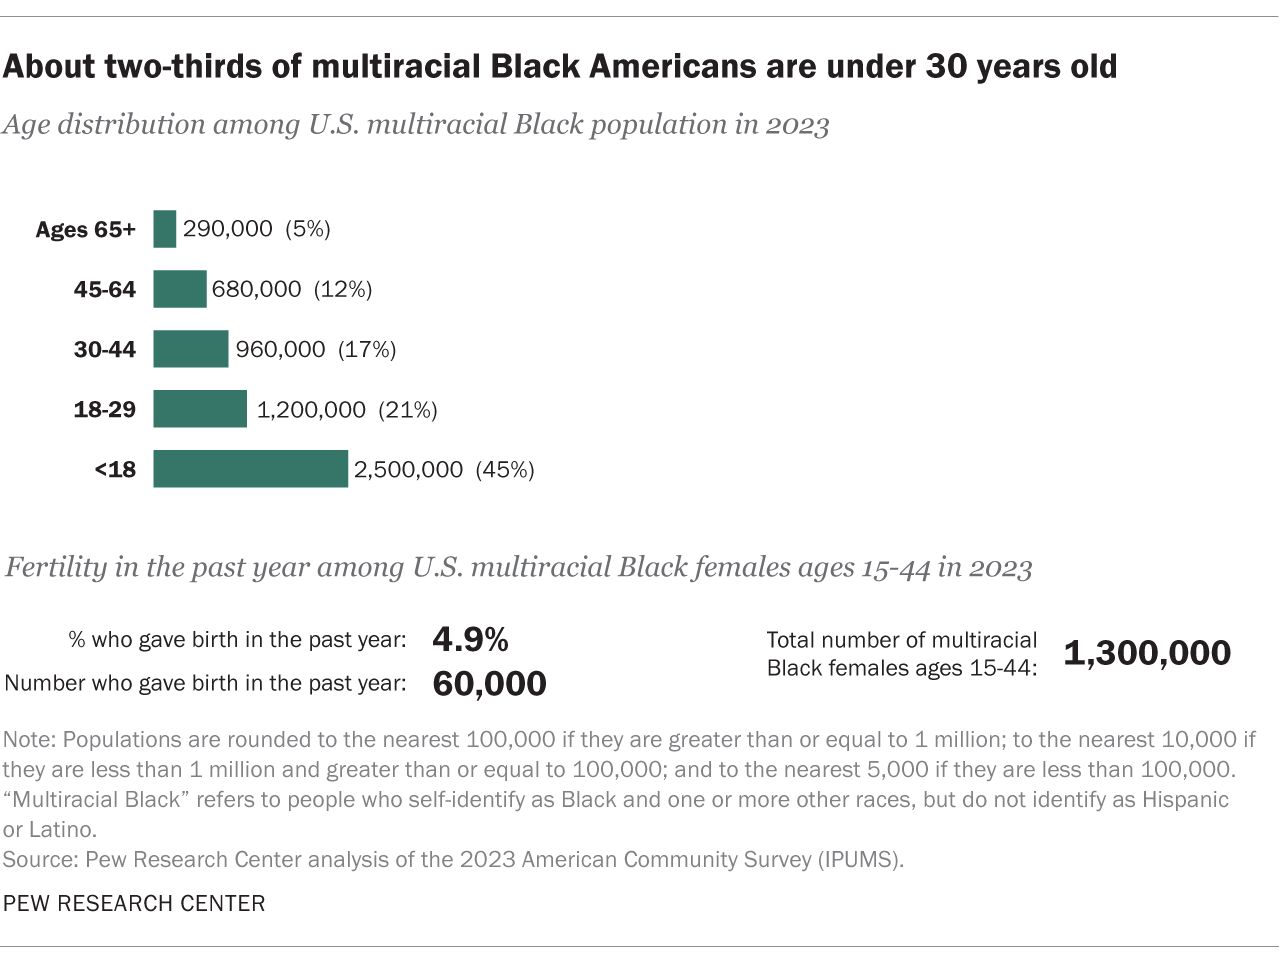
In 2023, two-thirds (66%) of multiracial Black people in the U.S. were under 30, while about three-in-ten (29%) were ages 30 to 64.
Nearly half of this group is under 18 years old (45%).
Fertility in the past year
The general fertility rate among multiracial non-Hispanic Black females ages 15 to 44 in the U.S. was 4.9% in 2023, meaning that 4.9% of females in this age group had a birth in the previous 12 months.
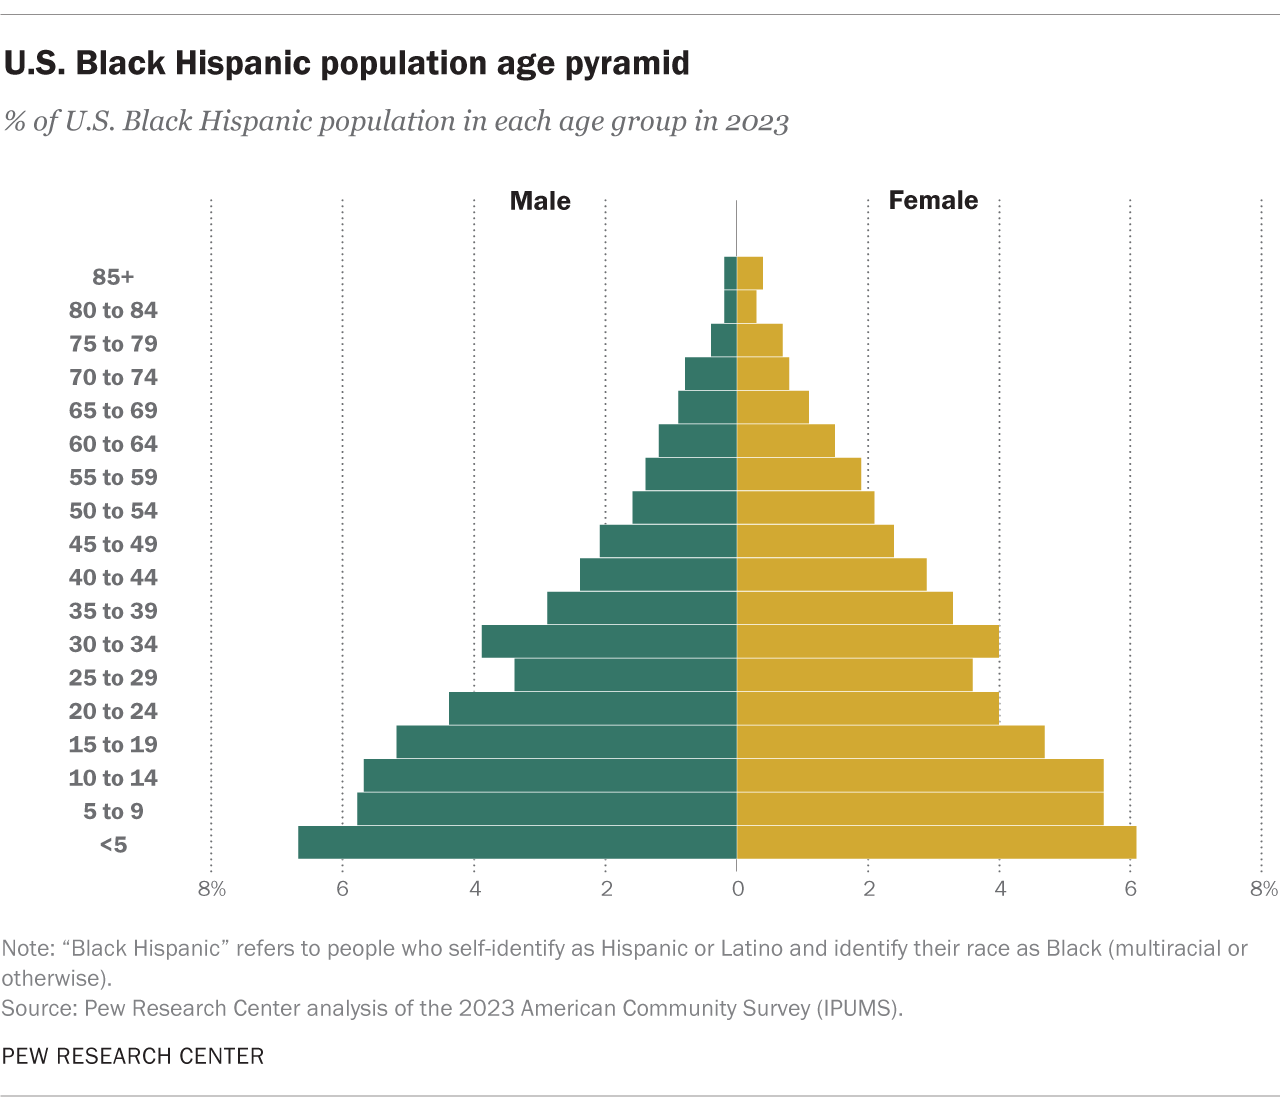
The total Black Hispanic population is quite young. The median age of this population group in 2023 was 21.7 years, making Black Hispanics the second-youngest group included in this analysis, and notably younger than the U.S. population, which had a median age of 38.2 years. Almost half (45%) of the Black Hispanic population was below the age of 20, and only 6% were 65 or older.
In 2023, 61% of the Black Hispanic population in the U.S. was under the age of 30. An additional 33% were ages 30 to 64.
About four-in-ten Black Hispanics are below the age of 18 (42%).
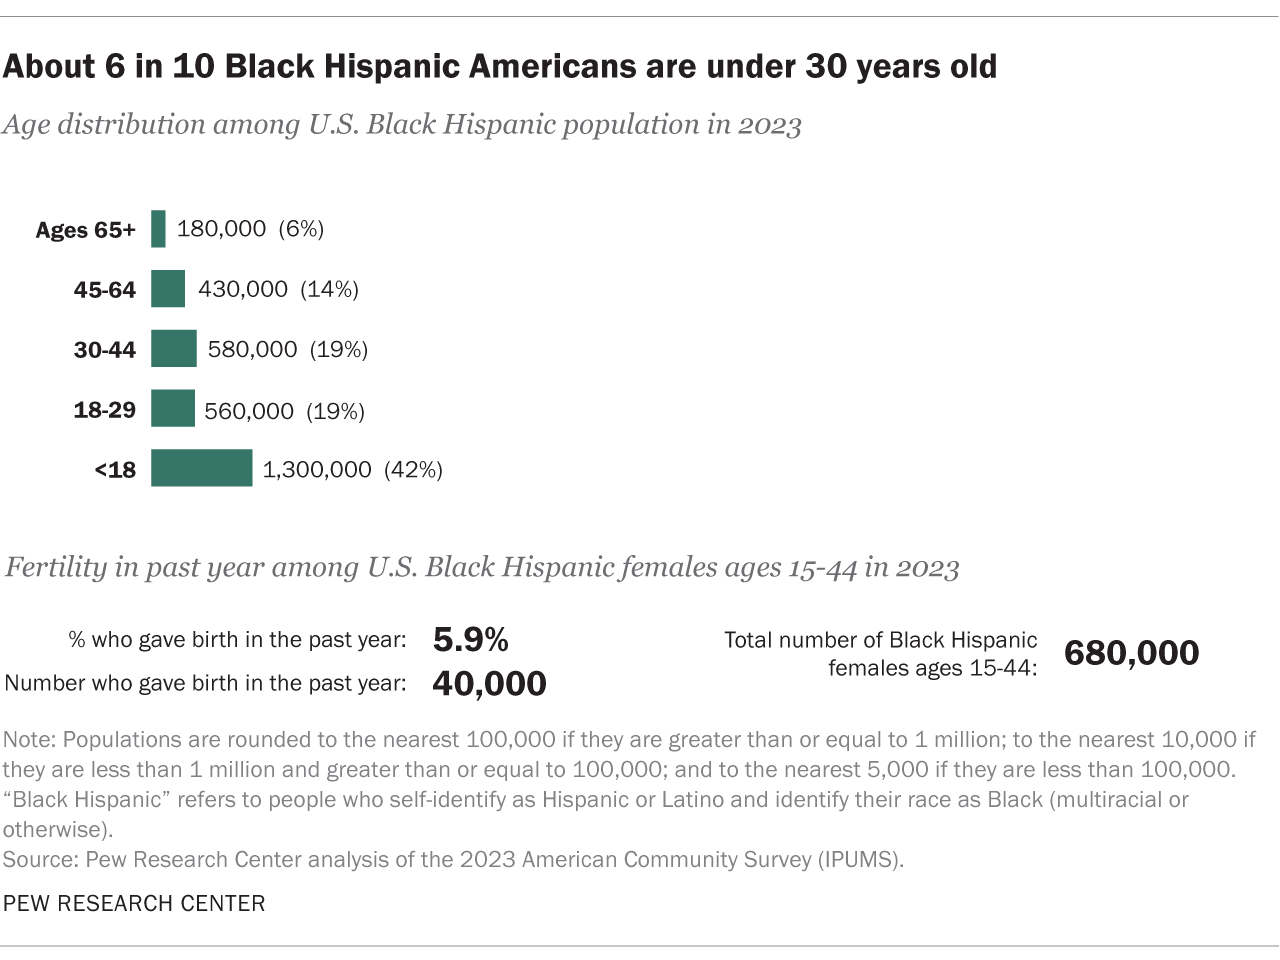
Fertility in the past year
The general fertility rate among Black Hispanic females ages 15 to 44 in the U.S. was 5.9% in 2023, meaning that 5.9% of females in this age group had a birth in the previous 12 months.
Languages
Contents
The vast majority (96%) of the Black population as of 2023 either speaks only English (88%) or speaks another language at home and say they speak English very well (8%). Besides English, other languages spoken at home by the U.S. Black population include Spanish (4%), French or Haitian Creole (3%),* Niger-Congo languages (1%), and Amharic and other Ethiopian languages (1%). (Language use is among ages 5 and older.)
* “French or Haitian Creole” combines those whose language was recorded by the American Community Survey as either “French” or “French or Haitian Creole.
The vast majority (97%) of the single-race Black population in 2023 either speaks only English (90%) or, if they speak another language at home, say they also speak English very well (7%). Besides English, other languages spoken at home by this group include French or Haitian Creole (4%),* Niger-Congo languages (2%), Spanish (1%), and Amharic and other Ethiopian languages (1%). (Language use is among ages 5 and older.)
* “French or Haitian Creole” combines those whose language was recorded by the American Community Survey as either “French” or “French or Haitian Creole.
The vast majority (98%) of the multiracial, non-Hispanic Black population in 2023 either speaks only English (92%) or, if they speak another language at home, say also they speak English very well (6%). Besides English, Spanish is spoken by 2% of the multiracial Black population, and 1% of this population each speaks Portuguese, French or Haitian Creole,* or Arabic. (Language use is among ages 5 and older.)
* “French or Haitian Creole” combines those whose language was recorded by the American Community Survey as either “French” or “French or Haitian Creole.
A substantial majority (82%) of the Hispanic Black population in 2023 speaks either only English (52%) or, if they speak another language at home, say they also speak English very well (30%). Besides English, just under half (46%) of this population speaks Spanish, and 1% speaks French or Haitian Creole* at home. (Language use is among ages 5 and older.)
* “French or Haitian Creole” combines those whose language was recorded by the American Community Survey as either “French” or “French or Haitian Creole.
Geography
Contents
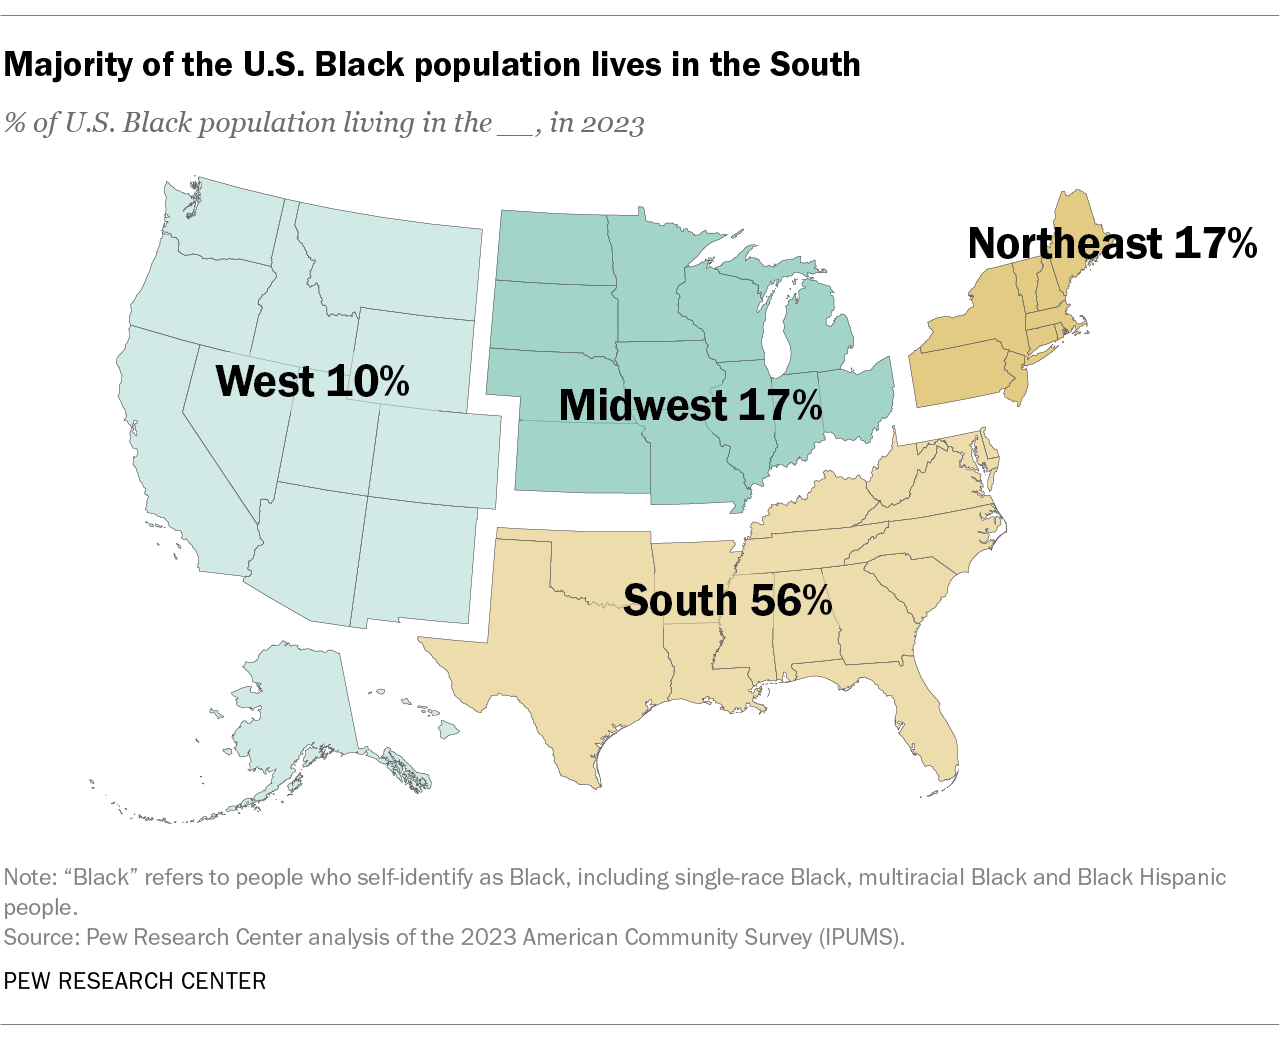
More than half of the U.S. Black population (56%) lives in the South as of 2023. Another 17% each live in the Midwest and Northeast, and 10% live in the West.
Texas is home to the largest Black population of any state, at about 4.3 million. Florida comes in a close second with 4.0 million, and Georgia comes in third with 3.7 million.
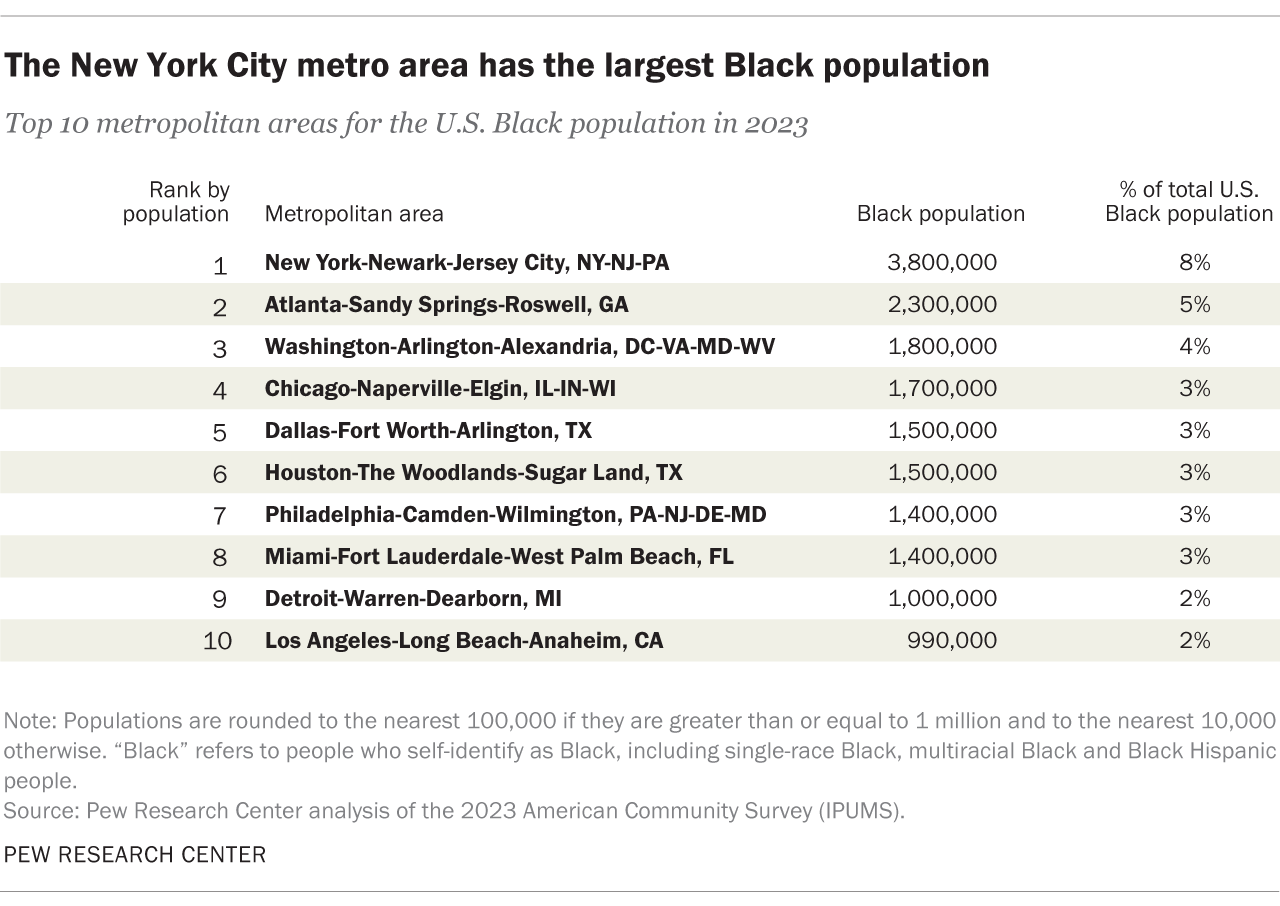
The New York City metropolitan area has the greatest number of Black residents (3.8 million). The second-largest Black metro area population is Atlanta with 2.3 million. The Washington, D.C., metro area is third-largest with 1.8 million Black residents.
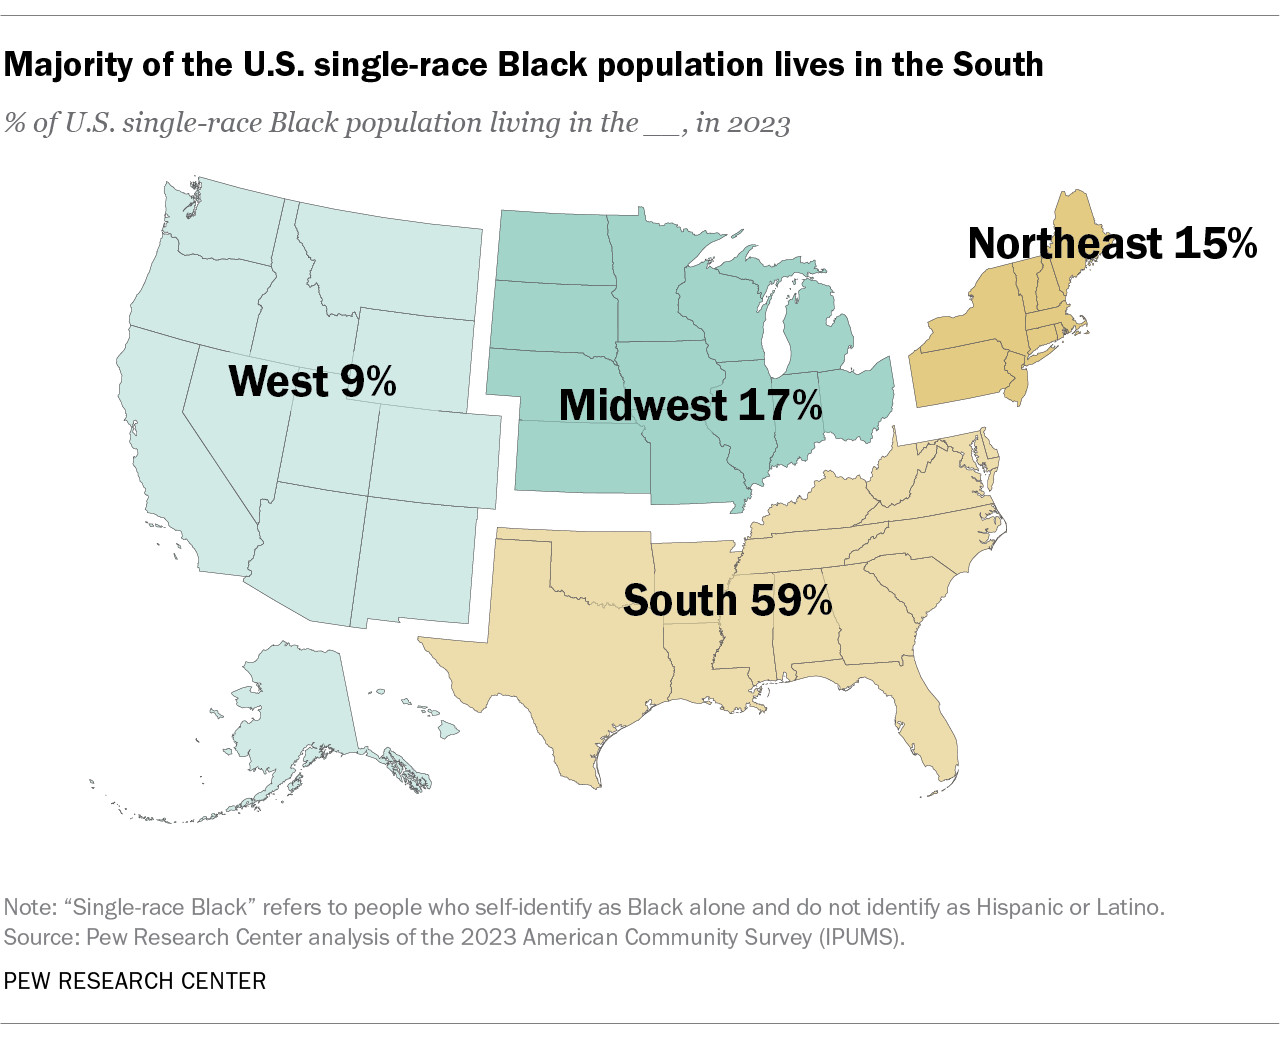
The South has the highest concentration of single-race, non-Hispanic Black residents: 59% live there as of 2023. The Midwest is home to 17%, while another 15% live in the Northeast and 9% live in the West.
The state of Texas has the largest number of single-race Black people (around 3.7 million), followed by Georgia (roughly 3.4 million) and Florida (about 3.2 million).
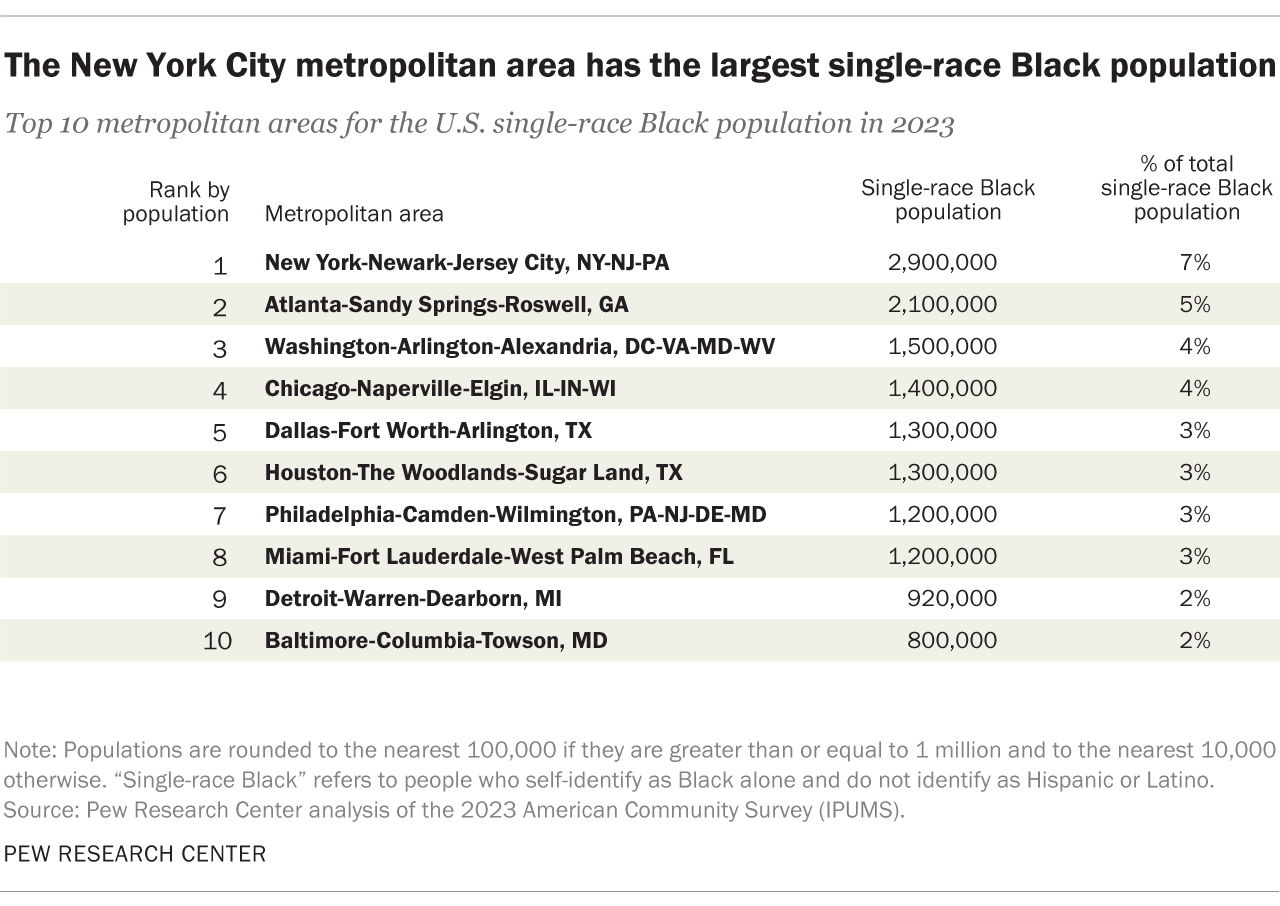
Among metropolitan areas, the New York City metro area has the nation’s largest Black alone, non-Hispanic population, with roughly 2.9 million. Other top metro areas include Atlanta; Washington, D.C.; Chicago; and Dallas.
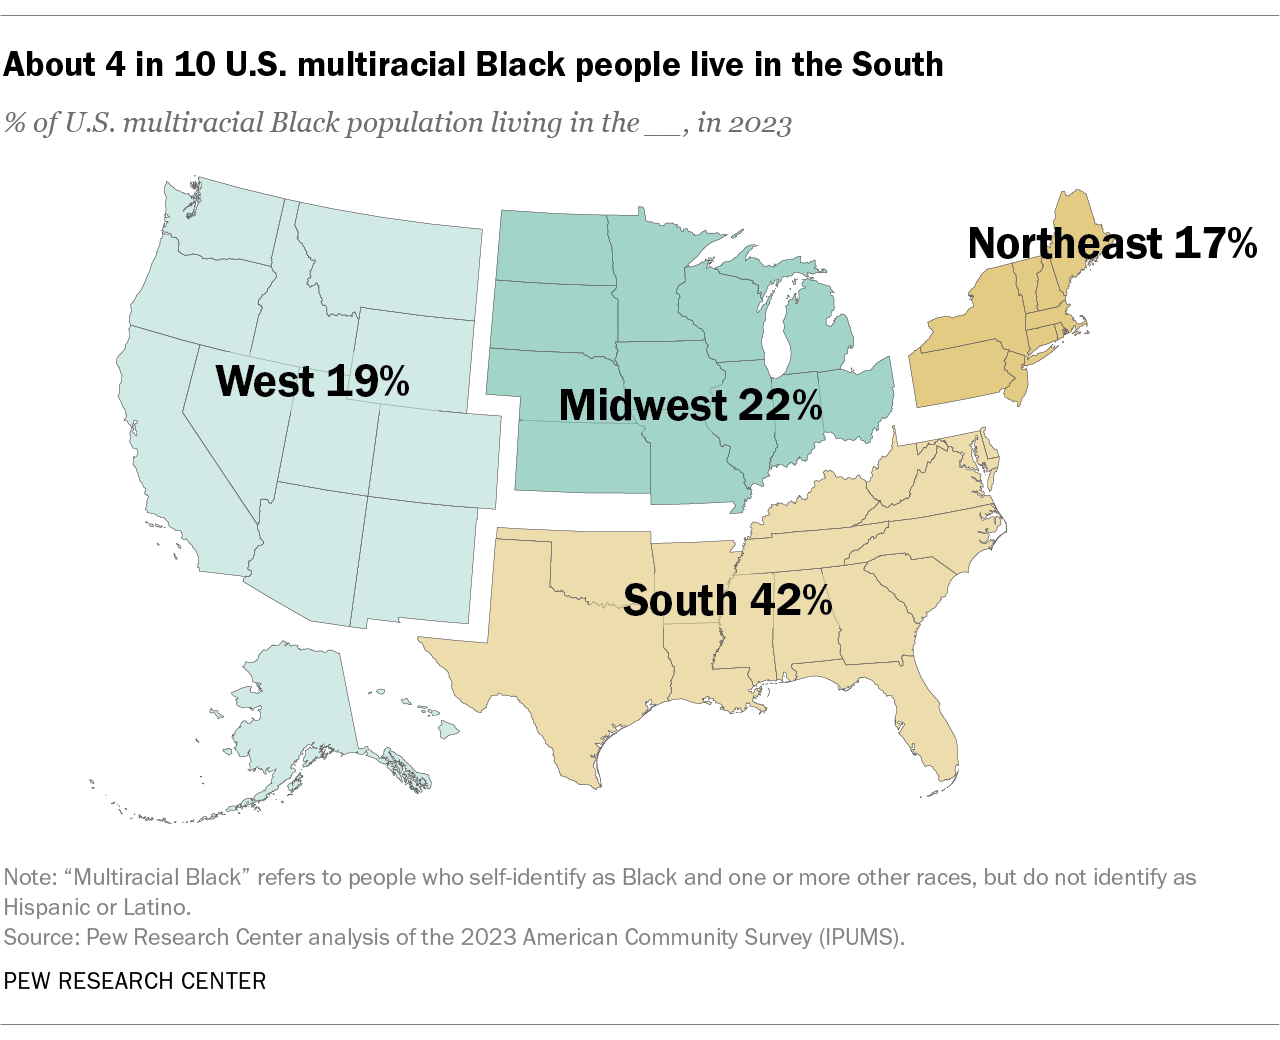
The South is home to the highest concentration of the multiracial Black population in the U.S., with 42% of the total as of 2023. Roughly two-in-ten each live in the Midwest (22%), the West (19%) and the Northeast (17%).
California is the top state of residence for multiracial Black people, with about 500,000 living there. Florida is home to 400,000 multiracial Black people, while Texas has 380,000.
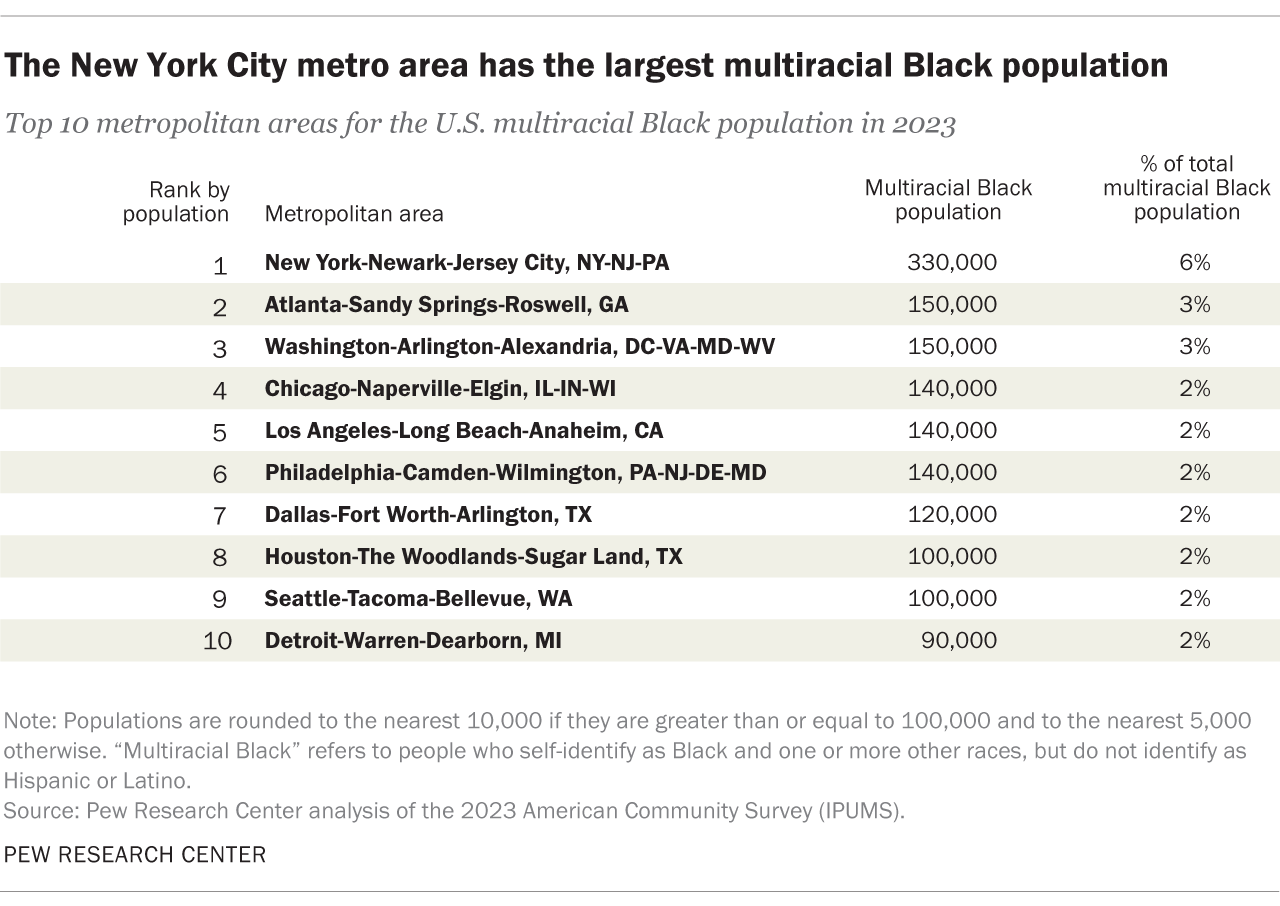
Among metropolitan areas, the New York City metro area has the highest number of multiracial Black residents (330,000). Other top metro areas for this subgroup include Atlanta; Washington, D.C.; Chicago; and Los Angeles.
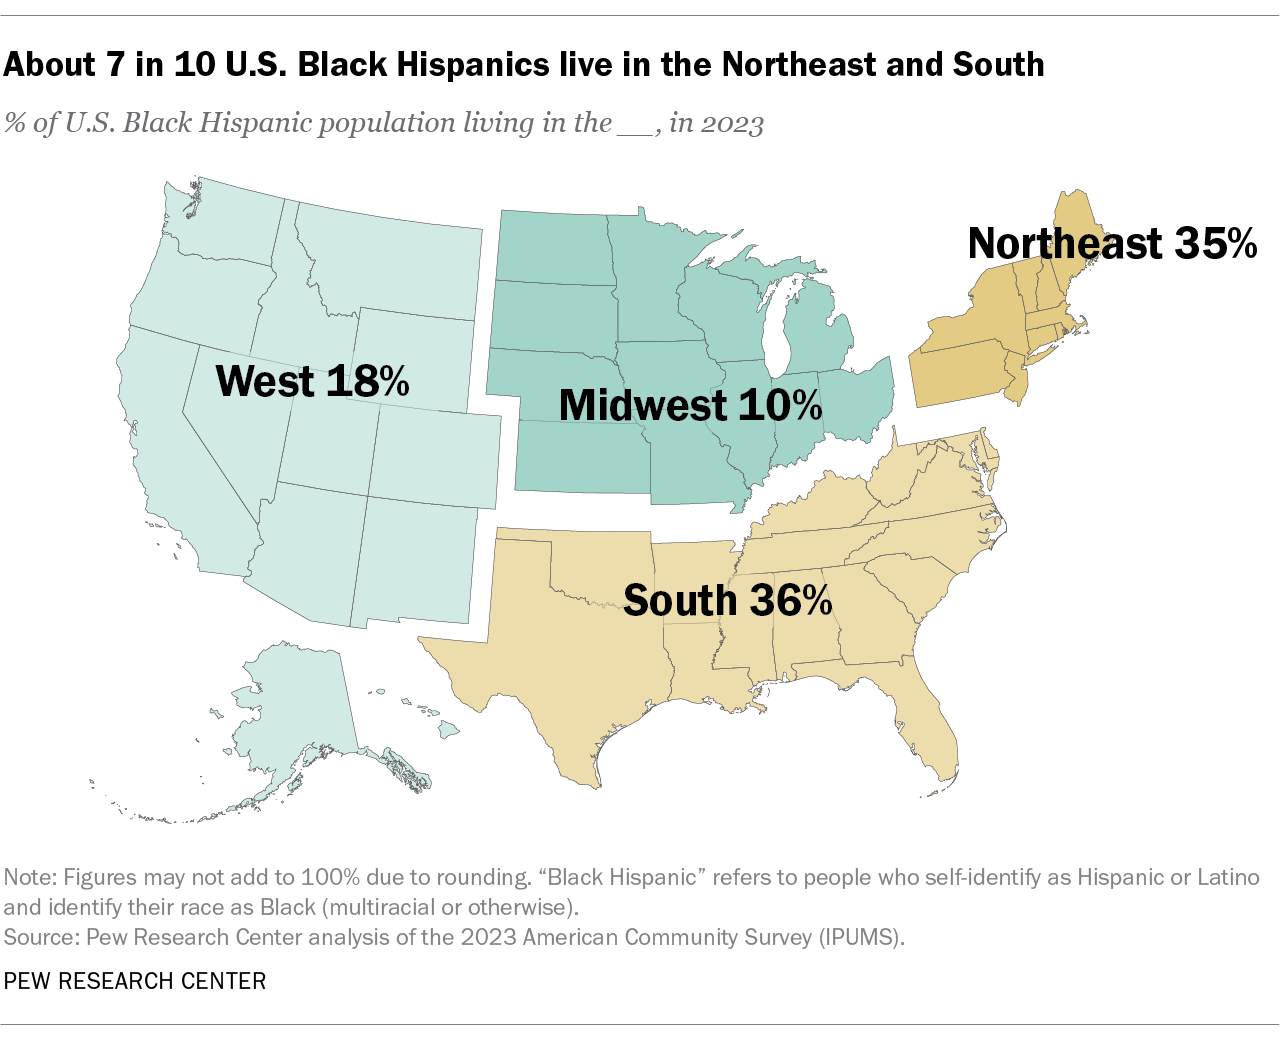
Black Hispanic people are largely concentrated in the Northeast and South (71% combined total). About one-in-five live in the West (18%) and 0ne-in-ten live in the Midwest as of 2023.
New York is the top state of residence for the Black Hispanic population, with 500,000 people living there. Florida is home to the second-highest number of this population (350,000), and California comes in third with 310,000 people.
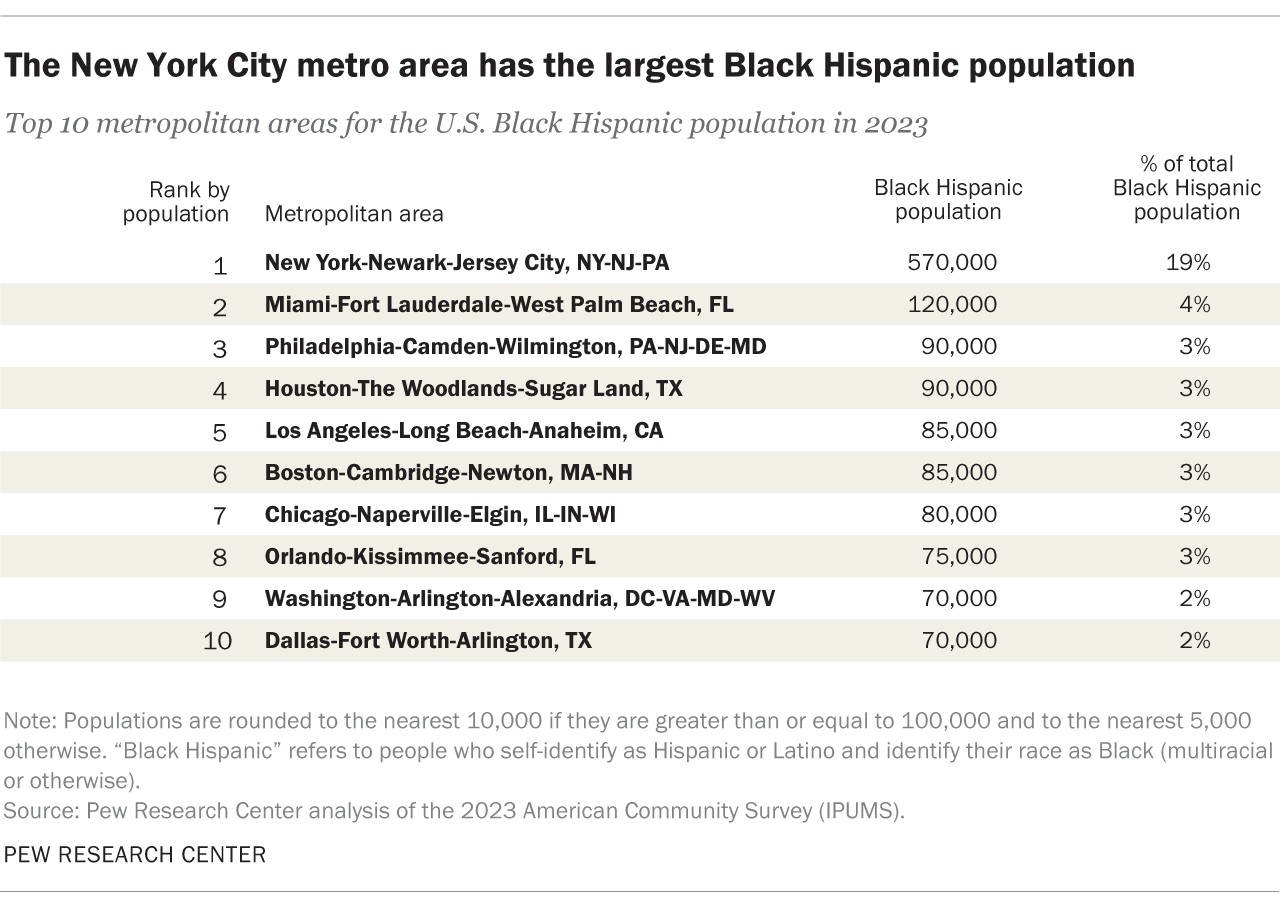
Among metropolitan areas, the New York City metro area has the largest Black Hispanic population (570,000 people). Other top metro areas for this subgroup include Miami, Philadelphia and Houston.
Household income
Contents
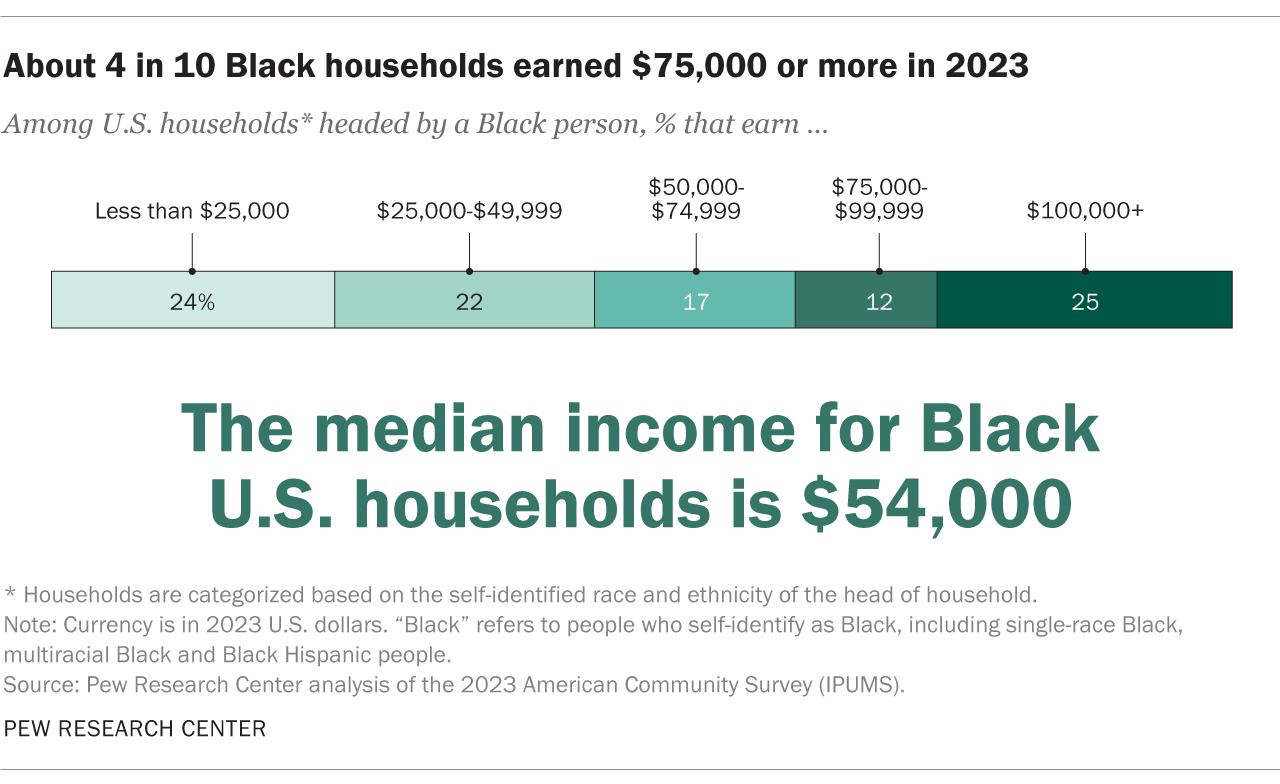
Median household income in 2023 for households headed by a Black person was $54,000, meaning half of Black households earned more than that and half earned less than that. Over a third of Black households (37%) earned $75,000 or more, including 25% that made $100,000 or more.
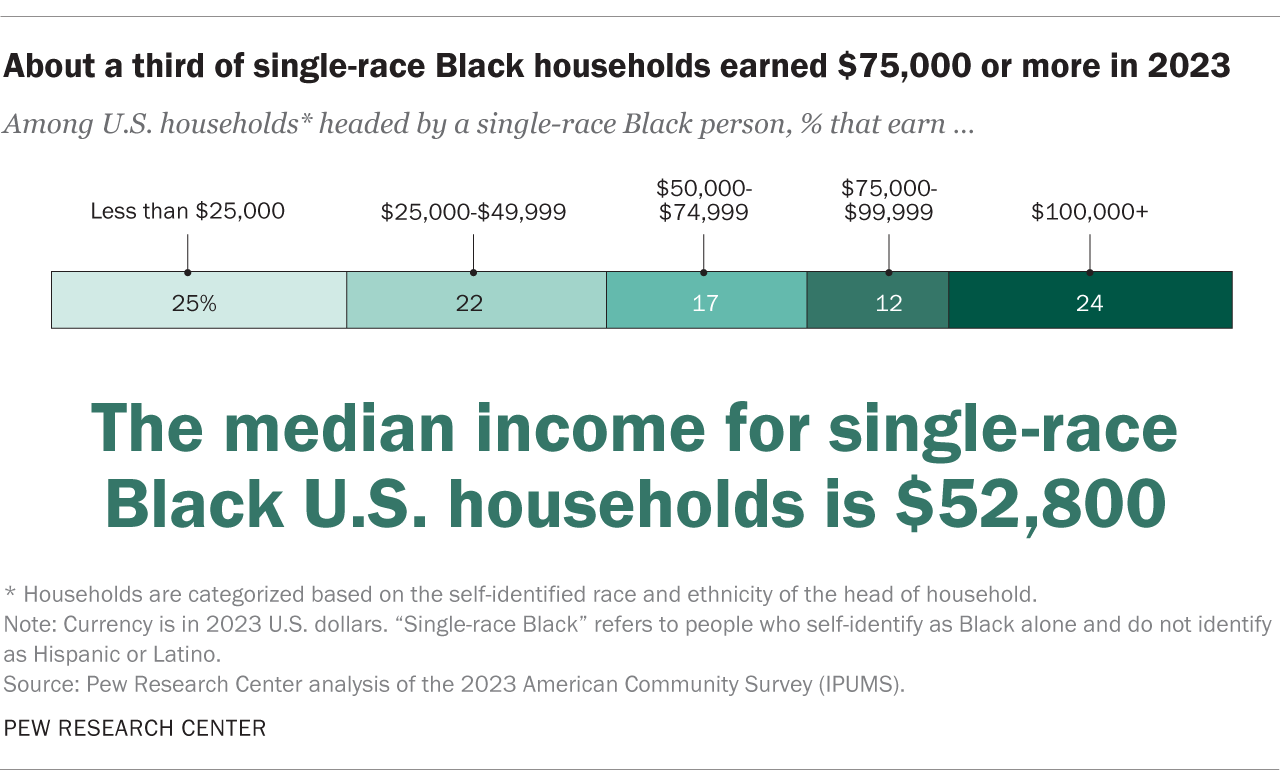
Median household income in 2023 for households headed by a single-race, non-Hispanic Black person was $52,800, meaning half of households in this category earned more than that and half earned less. About a third (36%) earned $75,000 or more, including about a quarter (24%) that made $100,000 or more.
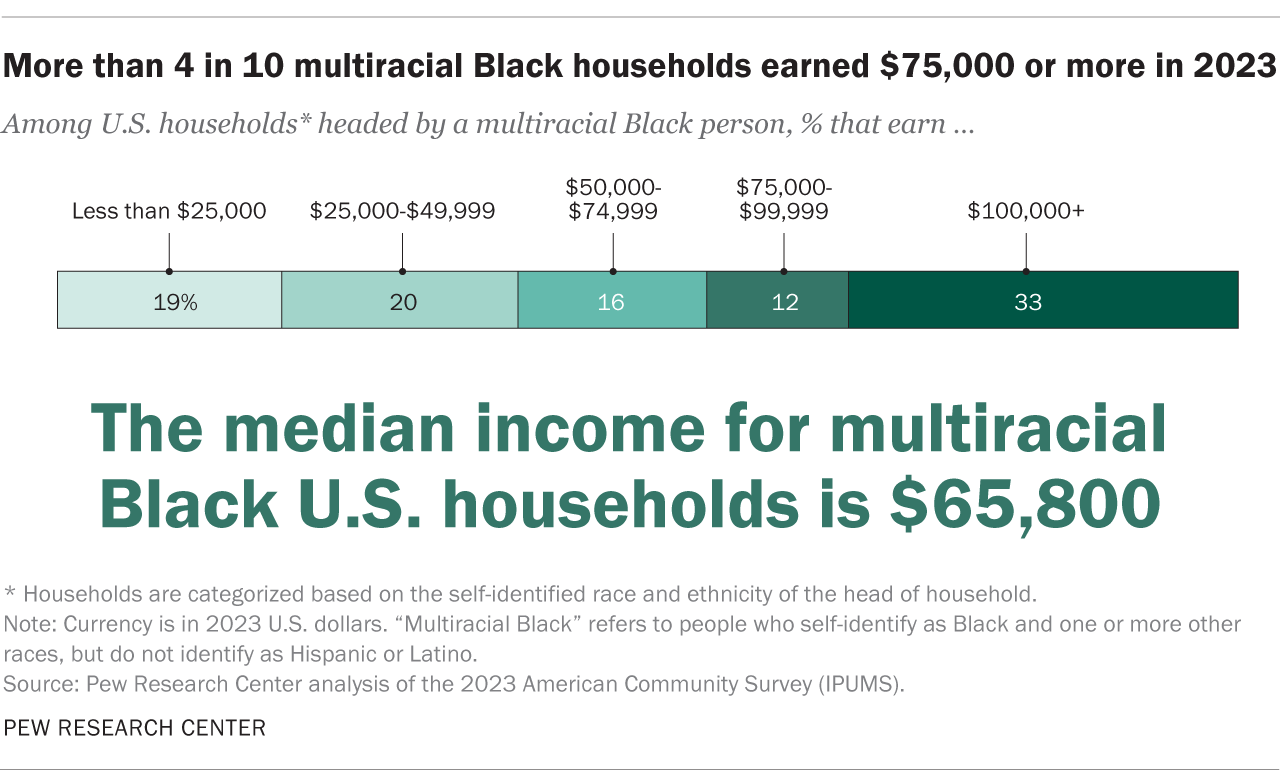
The median household income for multiracial, non-Hispanic Black U.S. households is $65,800.
In addition, 39% of households headed by a multiracial Black householder made less than $50,000, and 61% earned that amount or more. Over four-in-ten (45%) made $75,000 or more, including 33% that made $100,000 or more.
The median household income for Black Hispanic U.S. households is $60,000
About four-in-ten Black Hispanic-headed households (41%) earned less than $50,000, while 59% made over $50,000. A similar share of these households (40%) earned $75,000 or more, including roughly a quarter (28%) that made $100,000 or more.

Household type
Contents
About four-in-ten Black people in the U.S. (39%) live in households that are headed by married couples as of 2023. Three-in-ten Black people live in households whose household head is female, and 5% live in male-headed households. Fewer than two-in-ten (17%) are part of nonfamily households.*
* Nonfamily households include households where the householder lives alone or shares their home with only nonrelatives.

About four-in-ten (38%) single-race, non-Hispanic Black people in the U.S. live in households that are headed by married couples as of 2023. Roughly three-in-ten single-race Black people (31%) live in households with female household heads, and 5% live in male-headed households. About two-in-ten (18%) live in nonfamily households.*
* Nonfamily households include households where the householder lives alone or shares their home with only nonrelatives.

More than four-in-ten multiracial, non-Hispanic Black people in the U.S. (45%) live in households that are headed by married couples as of 2023. Roughly three-in-ten (27%) live in households whose head is female, and 5% live in male-headed households. Additionally, about one-in-ten multiracial Black people (11%) live in nonfamily households.*
* Nonfamily households include households where the householder lives alone or shares their home with only nonrelatives.

Roughly four-in-ten Black Hispanic people in the U.S. (43%) live in households headed by married couples in 2023. About three-in-ten Black Hispanic people (29%) live in female-headed households, and 5% live in households headed by male householders. One-in-ten Black Hispanic people live in nonfamily households.*
* Nonfamily households include households where the householder lives alone or shares their home with only nonrelatives.

Educational attainment
Contents
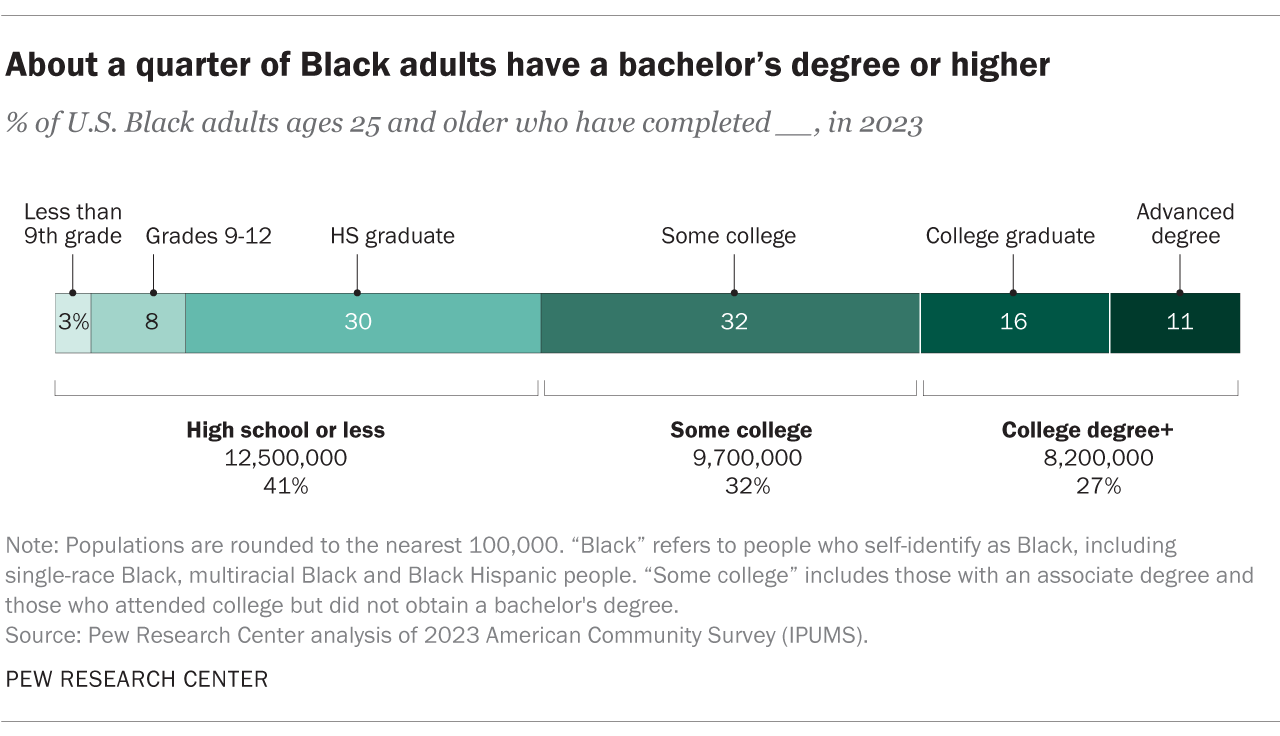
About a quarter (27%) of all Black U.S. adults ages 25 and older have a bachelor’s degree or more education: 16% earned a bachelor’s degree and 11% earned an advanced degree. As of 2023, about another third (32%) have completed some college without obtaining a bachelor’s degree, and 30% have, at most, graduated from high school (or earned an equivalent such as a GED certificate).
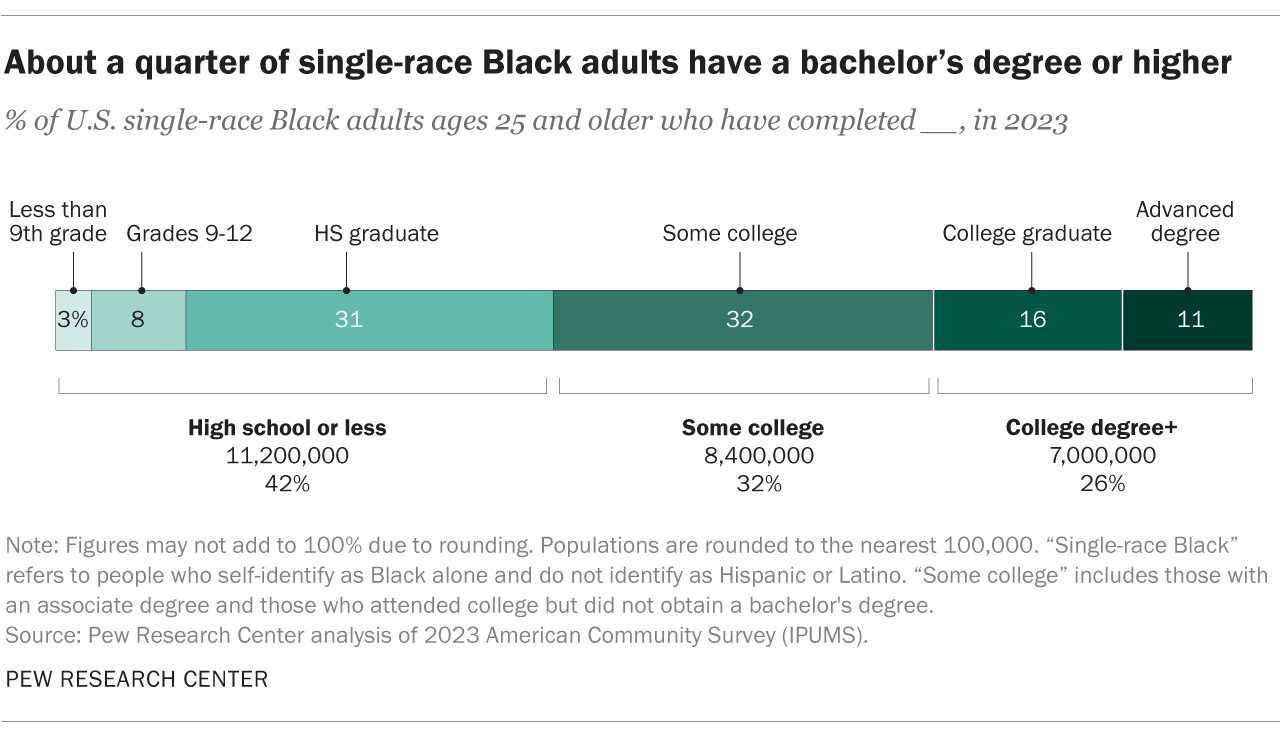
About a quarter (26%) of single-race, non-Hispanic Black U.S. adults ages 25 and older have earned a bachelor’s degree or higher as of 2023. Some 16% completed a bachelor’s degree and 11% completed an advanced degree. Roughly a third (32%) have completed some college without obtaining a bachelor’s, and 31% have, at most, graduated from high school or earned an equivalent certificate.
About a third (35%) of multiracial, non-Hispanic Black U.S. adults ages 25 and older have earned a bachelor’s degree or higher. As of 2023, 22% completed a bachelor’s degree and 13% completed an advanced degree. In addition, 34% have completed some college without obtaining a bachelor’s, and 23% have, at most, graduated from high school or its equivalent.

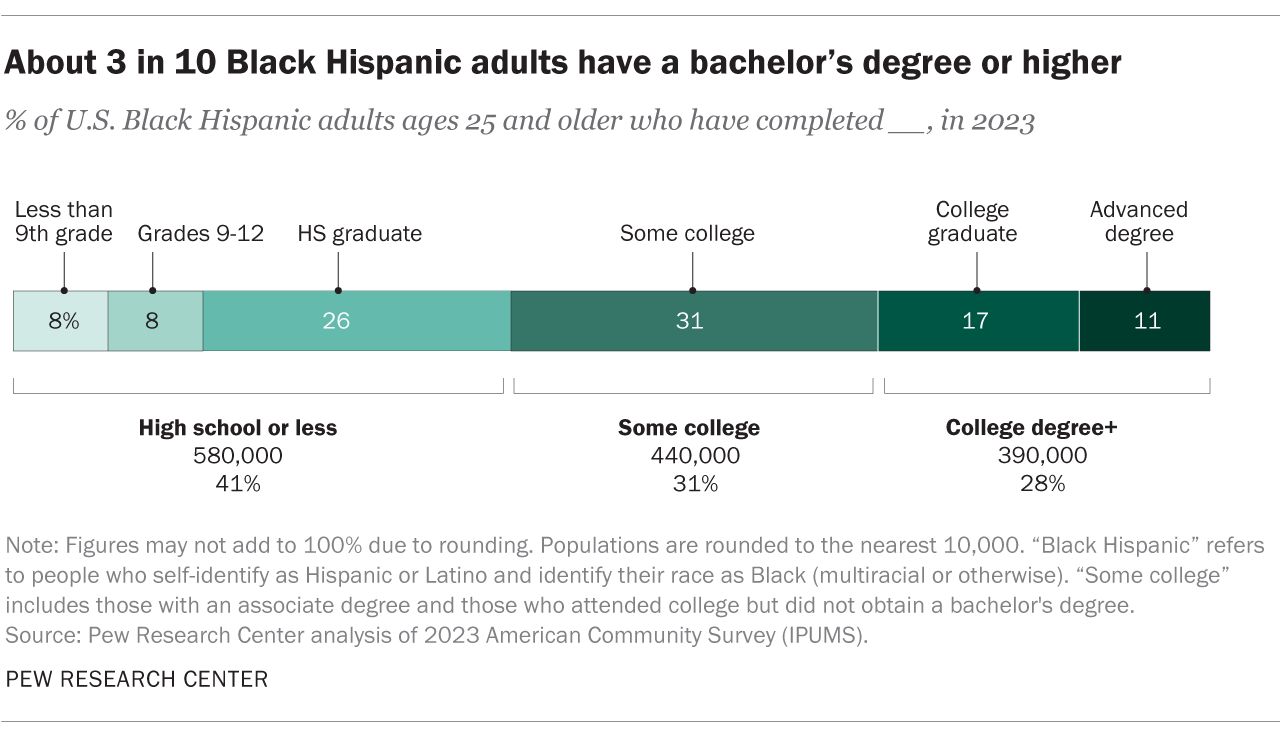
Almost three-in-ten Black Hispanic U.S. adults ages 25 and older (28%) have earned a bachelor’s degree or higher as of 2023. Some 17% completed a bachelor’s degree, and 11% completed an advanced degree. About a third (31%) have finished some college without obtaining a bachelor’s, while 26% have, at most, graduated from high school or its equivalent.