A record 137.5 million Americans voted in the 2016 presidential election, according to new data from the U.S. Census Bureau. Overall voter turnout – defined as the share of adult U.S. citizens who cast ballots – was 61.4% in 2016, a share similar to 2012 but below the 63.6% who say they voted in 2008.
A number of long-standing trends in presidential elections either reversed or stalled in 2016, as black voter turnout decreased, white turnout increased and the nonwhite share of the U.S. electorate remained flat since the 2012 election. Here are some key takeaways from the Census Bureau’s report, the data source with the most comprehensive demographic and statistical portrait of U.S. voters.
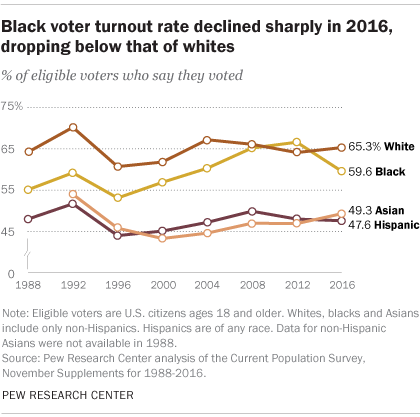
The black voter turnout rate declined for the first time in 20 years in a presidential election, falling to 59.6% in 2016 after reaching a record-high 66.6% in 2012. The 7-percentage-point decline from the previous presidential election is the largest on record for blacks. (It’s also the largest percentage-point decline among any racial or ethnic group since white voter turnout dropped from 70.2% in 1992 to 60.7% in 1996.) The number of black voters also declined, falling by about 765,000 to 16.4 million in 2016, representing a sharp reversal from 2012. With Barack Obama on the ballot that year, the black voter turnout rate surpassed that of whites for the first time. Among whites, the 65.3% turnout rate in 2016 represented a slight increase from 64.1% in 2012.
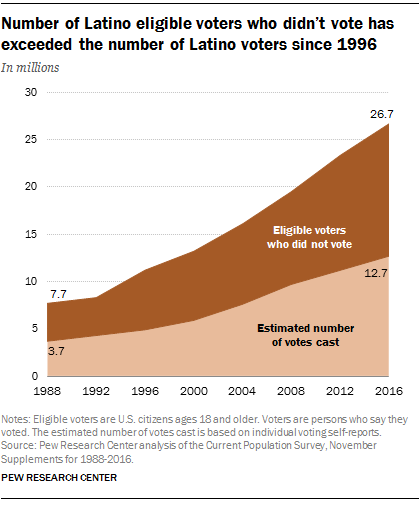
The Latino voter turnout rate held steady at 47.6% in 2016, compared with 48.0% in 2012. Overall turnout remained flat despite expectations heading into Election Day of a long-awaited, historic surge in Latino voters. Due largely to demographic growth, the number of Latino voters grew to a record 12.7 million in 2016, up from 11.2 million in 2012. Even so, the number of Latino nonvoters – those eligible to vote who do not cast a ballot, or 14 million in 2016 – was larger than the number of Latino voters, a trend that extends back to each presidential election since 1996. Meanwhile, the Asian voter turnout rate increased to 49.3% in 2016, up from 46.9% in 2012 and surpassing Hispanics for the first time since 1996. Asians continue to represent a smaller share of voters than Hispanics: Overall, about 5 million Asians voted in 2016, up from 3.8 million in 2012.
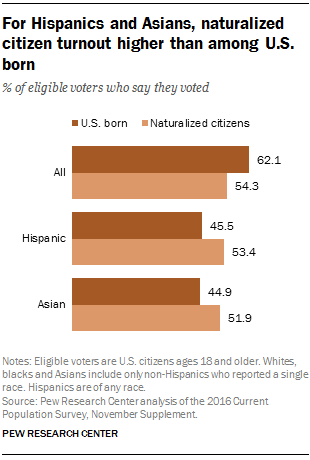
The number of naturalized-citizen voters reached 10.8 million in 2016, up from 9.3 million in 2012. In a year when immigration played a central role in the presidential campaign, turnout among naturalized-citizen voters (those who were immigrants born in another country who have naturalized to become U.S. citizens) was 54.3%, up from 53.6% in 2012. Overall, the voter turnout rate among foreign-born citizens trailed that of U.S.-born voters, who had a 62.1% turnout rate in 2016. But among Asians and Hispanics – the nation’s two largest immigrant groups – the pattern was reversed. In 2016, turnout among Asian naturalized citizens was 51.9%, compared with 44.9% for U.S.-born Asians. Among Hispanics, naturalized-citizen turnout was 53.4%, higher than the 45.5% turnout for U.S.-born Hispanics.
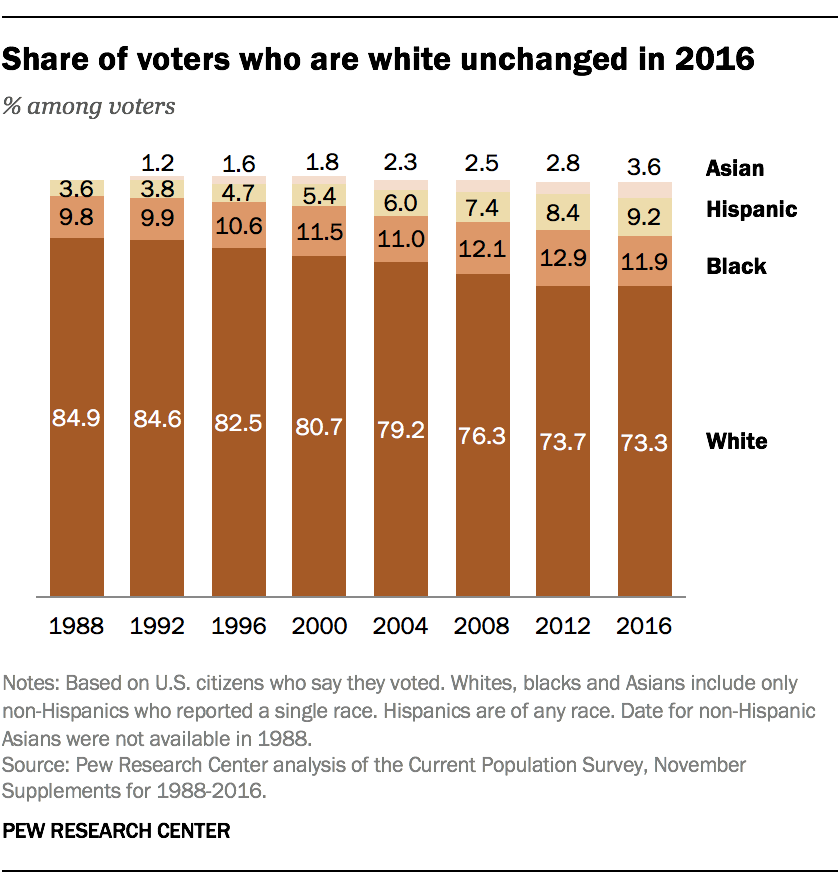
Blacks, Hispanics, Asians and other racial or ethnic minorities accounted for 26.7% of voters in 2016, a share unchanged from 2012. Leading up to the election, the overall eligible voting population was the most racially and ethnically diverse ever. However, whites made up 73.3% of voters in 2016, a share unchanged from 2012, when they accounted for 73.7%. Meanwhile, blacks made up 11.9% of voters in 2016, down from 12.9% in 2012 – the first time since 2004 that blacks have declined as a share of voters. Hispanics have accounted for a growing share of the electorate for decades, and this trend continued in 2016, when they made up 9.2% of voters, up from 8.4% in 2012. Asians made up 3.6% of all voters in 2016, up from 2.8% in 2012
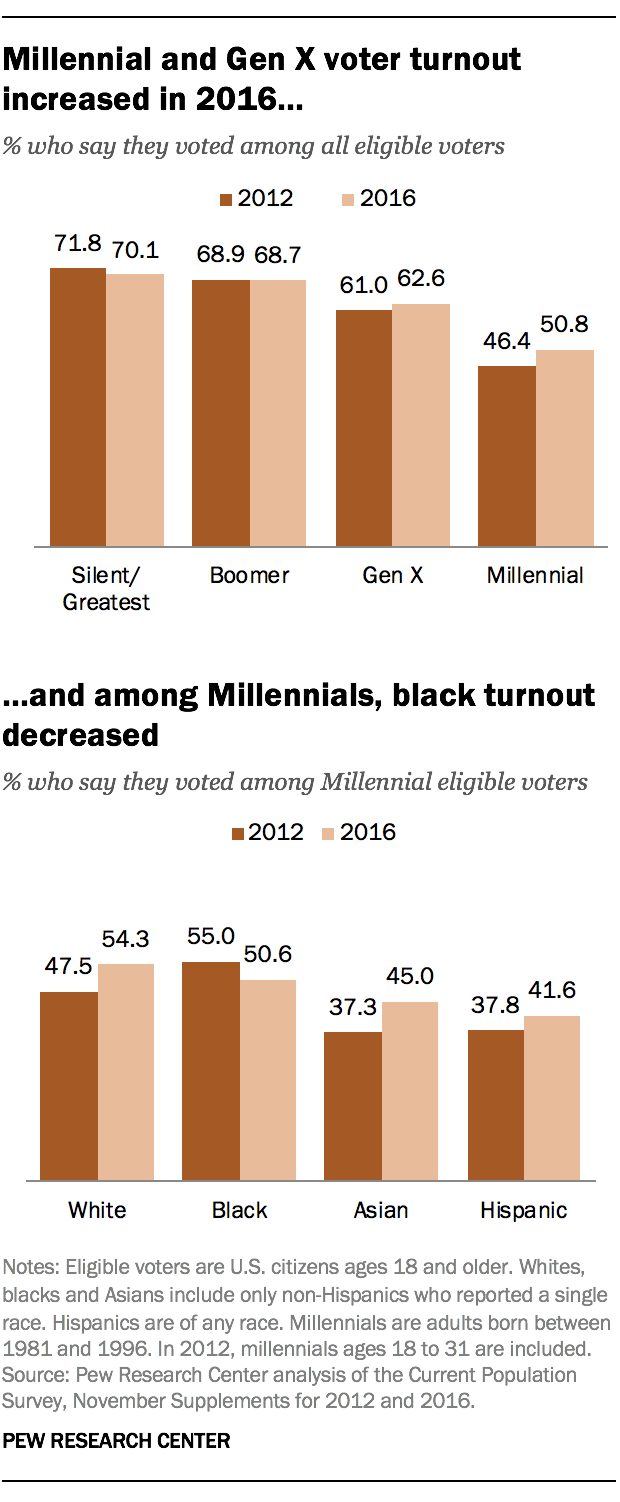
The voter turnout rate increased among Millennials and those in Generation X. Millennials (those ages 20 to 35 in 2016) had a 50.8% voter turnout rate in 2016, up from 46.4% in 2012 when they were ages 18 to 31. Their turnout rate increased across racial and ethnic groups, with the exception of black Millennials, 50.6% of whom turned out in 2016, compared with 55.0% in 2012. This increase in the Millennial voter turnout rate is not only because the generation has grown older (older voters vote at higher rates than younger voters), but also due to a higher turnout rate among its youngest members: 45.2% of 20- to 24-year-olds voted in 2016, up from 43.6% in 2012. Generation X (those ages 36 to 51 in 2016) turnout was 62.6%, up from 61.0% in 2012. By contrast, the voter turnout rate among older generations was flat. Turnout for Baby Boomers (those ages 52 to 70) was 68.7% in 2016, compared with 68.9% in 2012, while among the Silent and Greatest generations (those ages 71 and older), it was 70.1% in 2016, compared with 71.8% in 2012.
Note: Item No. 5 in this post and its corresponding chart, “Millennial and Gen X voter turnout increased in 2016,” were updated on Oct. 5, 2018, to reflect the Center’s revised definition of the Millennial generation
The voter turnout rate among women was 63.3% in 2016, mostly unchanged from 63.7% in 2012. The rate increased among white women, to 66.8% in 2016 from 65.6% in 2012. But it decreased among black women (64.1% in 2016 versus 70.7% in 2012). Among Hispanic women, the turnout rate stayed flat: 50% in 2016, compared with 49.8% in 2012. Meanwhile, among men, the voter turnout rate stayed flat (59.3% in 2016 versus 59.7% in 2012), trailing the rate among women.
Correction: Notes in the charts “Share of voters who are white unchanged in 2016” and “Millennial and Gen X voter turnout increased in 2016 … and among Millennials, black turnout decreased” have been corrected to reflect each chart’s correct universe of voters.
Note: Item No. 5 in this post and its chart were updated Oct. 5, 2018.

