Half of U.S. workers say they are extremely or very satisfied with their job overall. Another 38% say they are somewhat satisfied, and 12% are not too or not at all satisfied with their job.
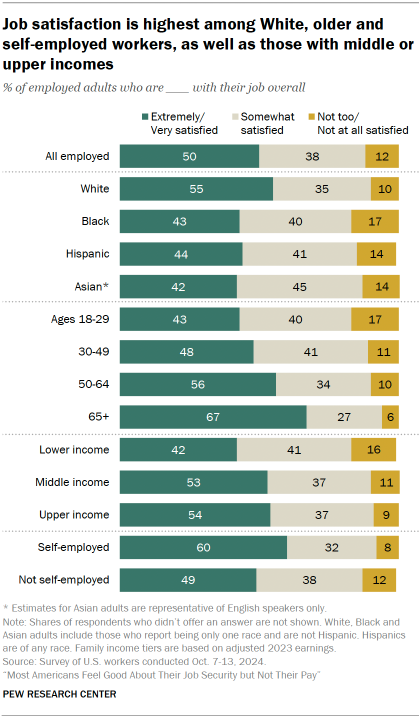
As was the case in 2023, self-employed workers (60%) are more likely than those who are not self-employed (49%) to be highly satisfied with their job.
There are also differences in the shares who say they are extremely or very satisfied by:
- Race and ethnicity: 55% of White workers versus 44% of Hispanic workers, 43% of Black workers and 42% of Asian workers.
- Age: 67% of workers ages 65 and older versus 56% of those 50 to 64, 48% of those 30 to 49 and 43% of those under 30.
- Income: 54% of workers with higher family incomes and 53% of those with middle incomes versus 41% of those with lower incomes.
How workers feel about specific aspects of their job
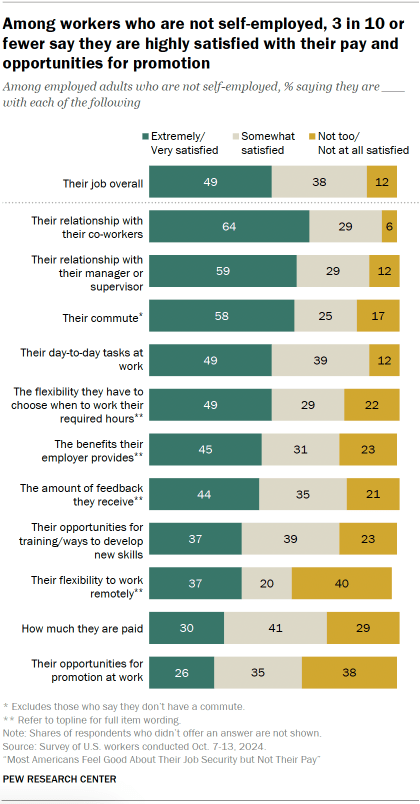
Majorities of workers say they are highly satisfied with:
- Their relationship with their co-workers (64%)
- Their relationship with their manager or supervisor (59%)
- Their commute (58% among those who have a commute)
When it comes to the amount of flexibility workers have, more say they are extremely or very satisfied with their flexibility to choose when they work their required hours (49%) than with their flexibility to work remotely (37%). In fact, 40% of workers express dissatisfaction with the amount of flexibility they have to work remotely.
Pay and opportunities for promotion are the two areas where workers express the lowest levels of satisfaction.
Only 30% say they are extremely or very satisfied with how much they’re paid. And about a quarter (26%) are highly satisfied with their opportunities for promotion at work.
Differences by race and ethnicity, age, and income
Just as overall job satisfaction varies across demographic groups, so do ratings of some specific aspects of work.
Among those who are not self-employed, White workers are more likely than Black, Hispanic and Asian workers to say they are extremely or very satisfied with their relationship with their co-workers, their relationship with their manager or supervisor, their opportunities for training and ways to develop new skills, and how much they are paid.
Workers ages 65 and older are the most likely to express high levels of satisfaction with their flexibility to choose when to work their required hours and with the amount of feedback they receive from their manager or supervisor.
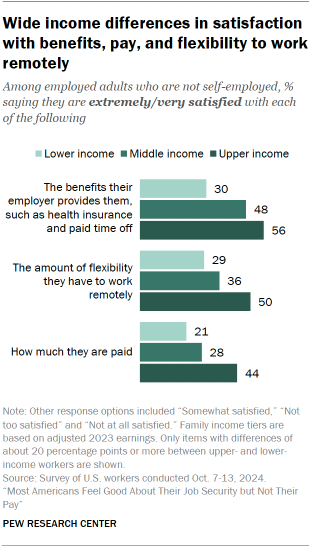
And a larger share of higher-income workers than with those with middle or lower incomes say they are extremely or very satisfied with eight of the 11 items we asked about. The gaps between those with upper and lower incomes are particularly wide when it comes to benefits, flexibility to work remotely and pay.
Changes in satisfaction since 2023
On seven of the nine items that were also asked last year, the shares of workers who express high levels of satisfaction have dropped by margins of 3 to 7 percentage points.
For example, 37% of workers now say they are extremely or very satisfied with their opportunities for training or ways to develop new skills, down from 44% in February 2023. And about a quarter (26%) say they are highly satisfied with their opportunities for promotion, compared with the already small share of 33% measured last year.
There have also been drops in the shares saying they are extremely or very satisfied with the amount of feedback they get (-5 points), the benefits their employer provides (-4), how much they are paid (-4), their relationship with their coworkers (-3), and their relationship with their manager or supervisor (-3).
Reasons for pay dissatisfaction
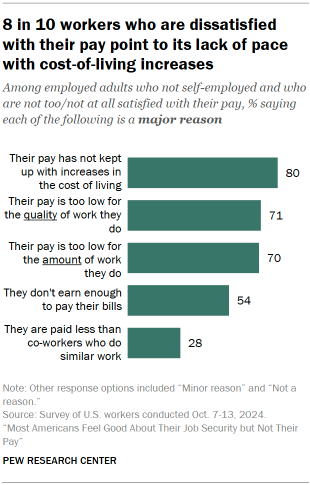
One of the aspects of work that employed adults express the least satisfaction with is how much they are paid. Large majorities of workers who are not self-employed and who are not too or not at all satisfied with their pay cite each of the following as major reasons:
- Their pay hasn’t kept up with increases in cost of living (80%)
- Their pay is too low for the quality of work they do (71%)
- Their pay is too low for the amount of work they do (70%)
Just over half (54%) say a major reason for their dissatisfaction with their pay is that they don’t earn enough to pay their bills. A smaller share (28%) say they are paid less than co-workers who do similar work.
Differences by gender
Majorities of men and women who are not too or not at all satisfied with how much they are paid cite their wages being too low for the quality and amount of work they do as major reasons for their dissatisfaction. But women are more likely than men to say these are major reasons.
Additionally, women are more likely than men to point to not earning enough to pay their bills as a major reason for their dissatisfaction (61% vs. 47%).
And while relatively small shares of both men and women say a major reason they’re dissatisfied is because they are paid less than co-workers who do similar work, women are more likely than men to cite this (32% vs. 24%).
Differences by income
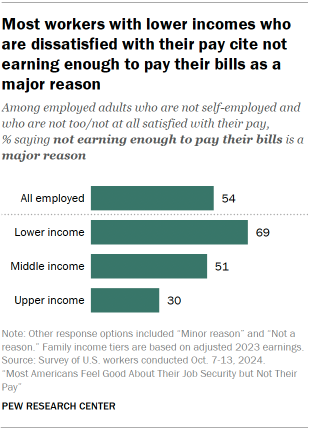
For the most part, workers across levels of family income who are dissatisfied with their pay give similar reasons for feeling this way. For example, about eight-in-ten workers with lower, middle and upper incomes say a major reason is that their pay hasn’t kept up with cost-of-living increases.
There are significant differences, however, in the shares that cite not earning enough to pay their bills. About seven-in-ten workers with lower incomes (69%) say this is a major reason they are dissatisfied with how much they are paid. Roughly half (51%) of those with middle incomes – and 30% of upper-income workers – say the same.
Do workers feel respected?
By their supervisor, co-workers, customers or clients
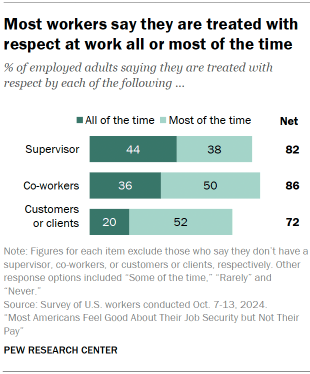
In addition to being highly satisfied with their workplace relationships, large shares of workers also say their co-workers (86%) and supervisors (82%) treat them with respect all or most of the time. About seven-in-ten (72%) say the same about their customers or clients.
(These figures exclude those who say they don’t have co-workers, supervisors, or clients or customers.)
While large majorities of workers across demographic groups say they are treated with respect all or most of the time, there are some differences in the shares saying this happens all of the time by:
- Race and ethnicity: White, Black and Hispanic workers are all more likely than Asian workers to say their supervisor and co-workers always treat them with respect. Hispanic workers are the most likely to say they’re always treated with respect by their clients or customers, but relatively small shares in each racial and ethnic group (26% or fewer) say this is the case.
- Age: 29% of workers ages 65 and older say their clients or customers always treat them with respect, compared with 23% or fewer among those in younger age groups.
- Income: Half of upper-income workers say their supervisor treats them with respect all of the time, compared with 43% of those with middle incomes and 38% of those with lower incomes. And while 40% of upper-income workers say their co-workers always treat them with respect, about a third of those with middle (35%) and lower (34%) incomes say the same.
- Education: 50% of workers with at least a bachelor’s degree say their supervisor always treats them with respect, and 40% say the same about their co-workers. Among those without a four-year college degree, these shares are 39% and 33%, respectively.
By most people in the U.S.
When asked how much respect they think most Americans have for people who do the type of work they do, 42% say most have a great deal or a fair amount of respect. Another 34% say most people have some respect, while 23% say most people have not much or no respect for people who do the type of work they do.
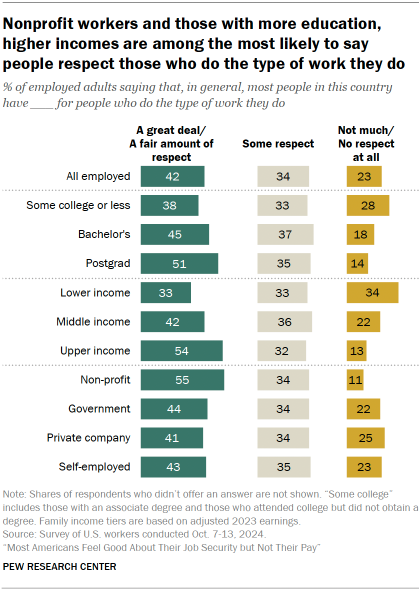
About half of workers with a postgraduate degree (51%) say most people have at least a fair amount of respect for people in their field, compared with 45% of those with a bachelor’s degree and 38% of those with some college or less education.
Upper-income workers are also more likely than those with middle or lower incomes to say most people have a great deal or a fair amount of respect for people in their field (54% vs. 42% and 33%).
Looking specifically at certain types of employers or industries:
- 55% of those who work for a nonprofit organization say most people have a great deal or a fair amount of respect, compared with 44% of those who work for the government, 43% of those who are self-employed and 41% of those who work for a private company.
- Workers in health care and social assistance fields are among the most likely to say that most people have at least a fair amount of respect (56%).
- Workers in the hospitality, service, arts, entertainment and recreation industries, along with those who work in retail or trade, are among the least likely to say most people have a great deal or a fair amount of respect for people in their field. About four-in-ten workers in these industries say people don’t have much respect or have no respect at all.
- Workers who say their job involves manual or physical labor are less likely than those who say it does not to say most people have at least a fair amount of respect for people who do the type of work they do (38% vs. 46%).
