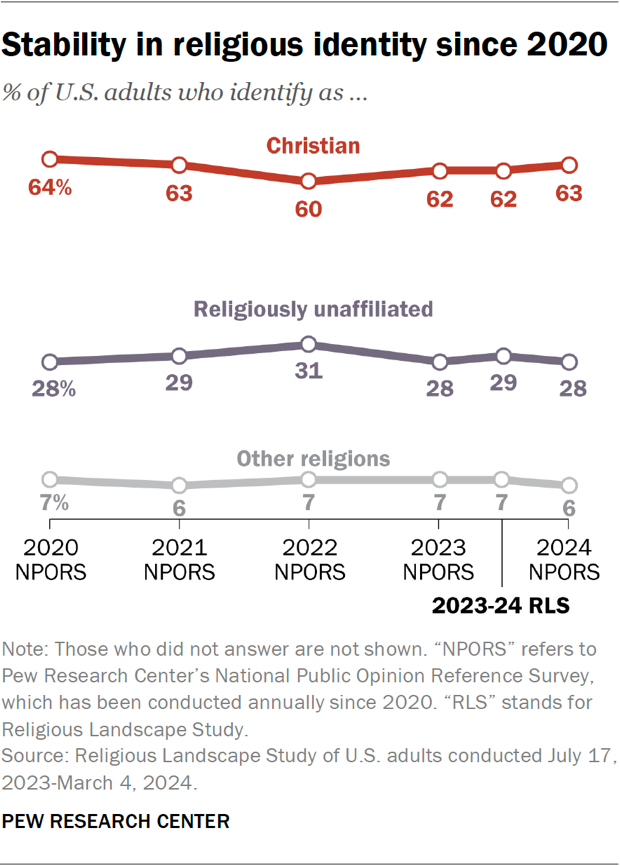
The religious composition of the United States has been fairly stable in half a dozen Pew Research Center surveys conducted since 2020. The Christian share of the adult population has been between 60% and 64% in these surveys, while the religiously unaffiliated share has ranged from 28% to 31%. Adherents of religions other than Christianity have consistently accounted for 6% or 7% of U.S. adults throughout this period.
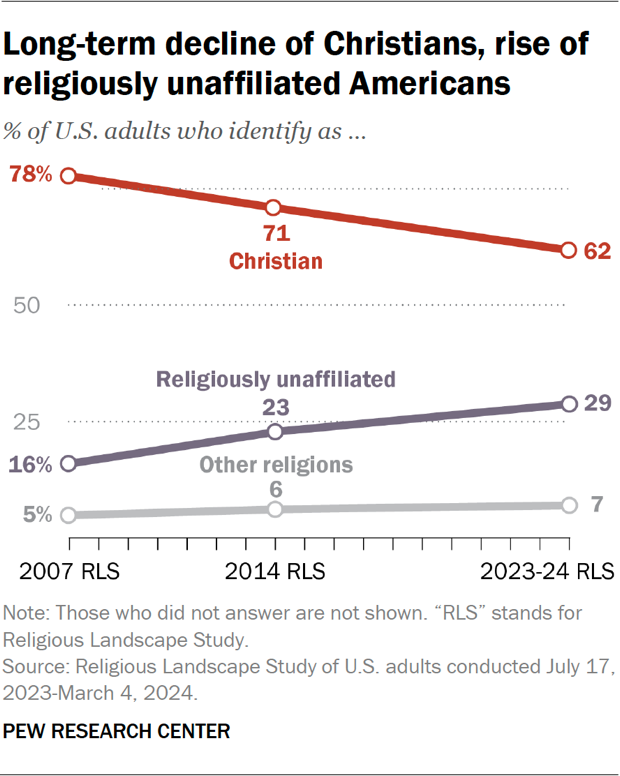
Over the longer term, however, Christians have been declining as a percentage of the U.S. adult population, while the share that is religiously unaffiliated has been rising.
(For an extended discussion of what explains the short-term stability in American religion amid a longer-term decline, refer to this report’s Overview.)
This chapter draws on the 2007, 2014 and 2023-24 Religious Landscape Studies to summarize the long-term trends in Americans’ religious identities.
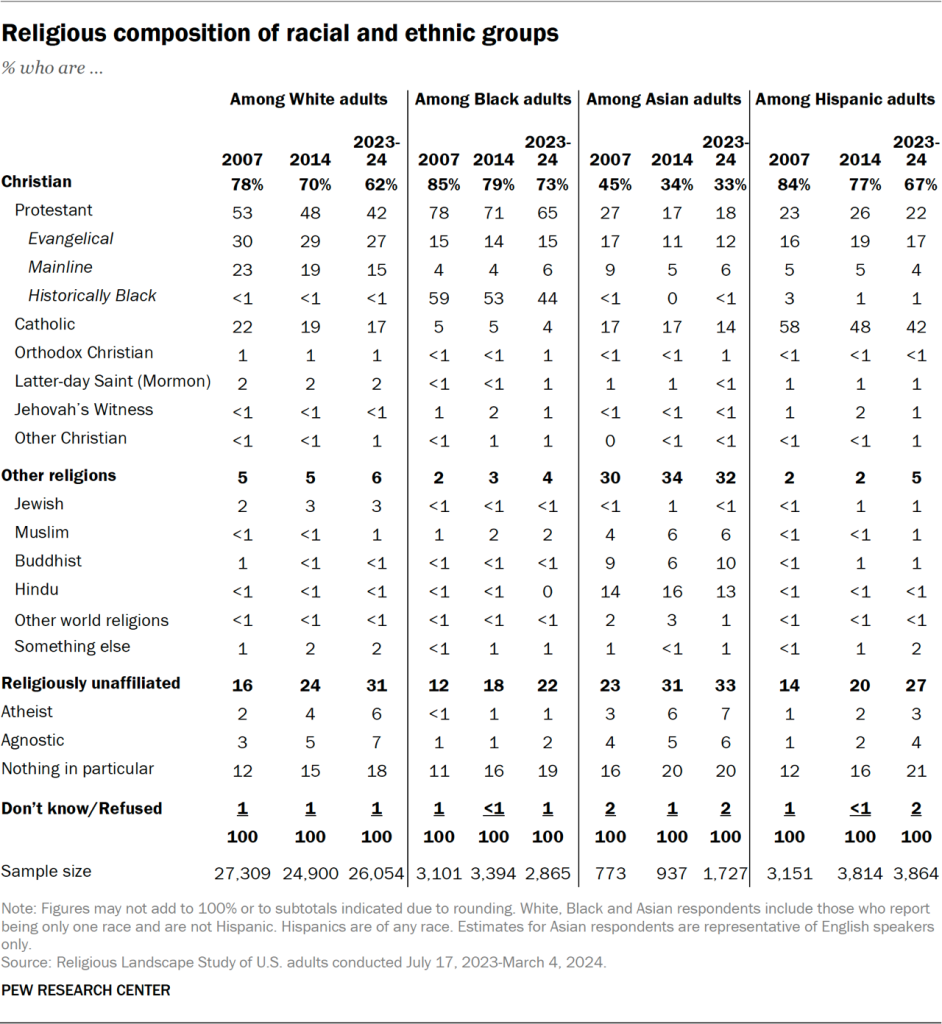
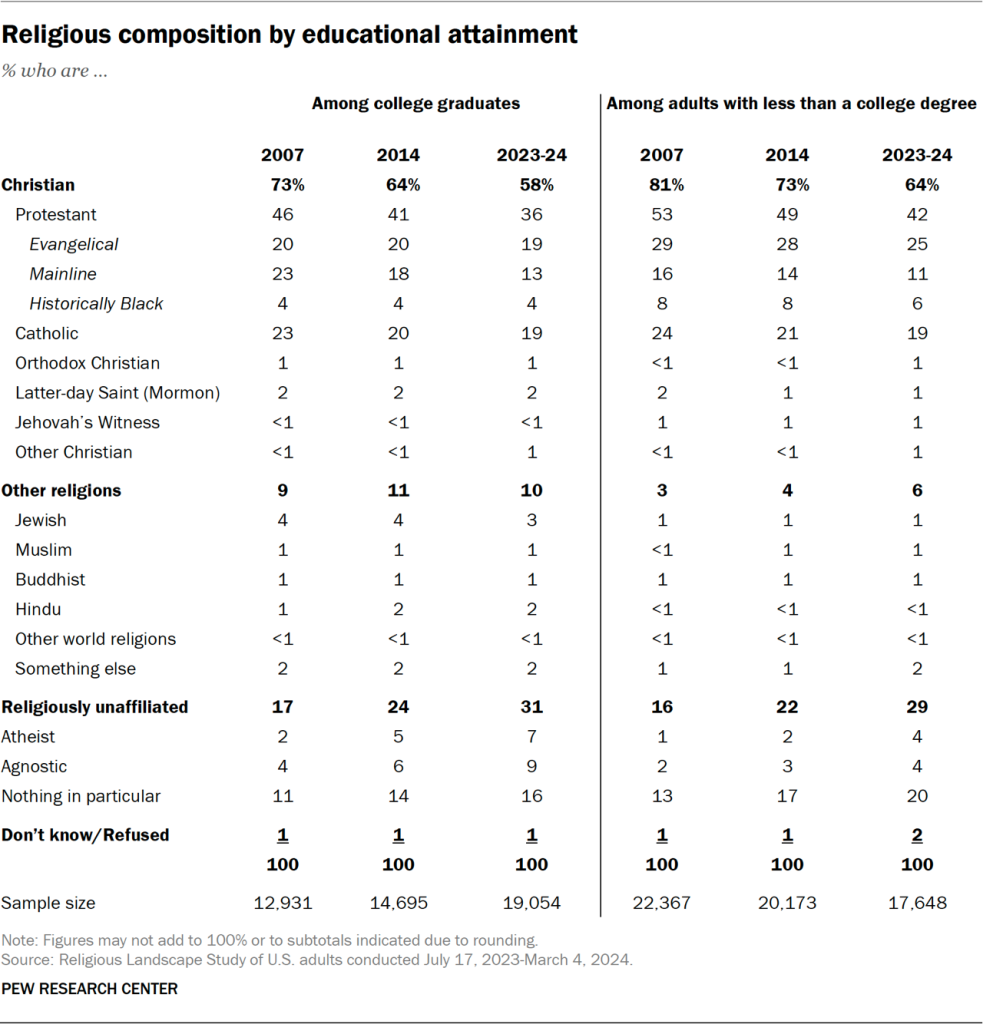
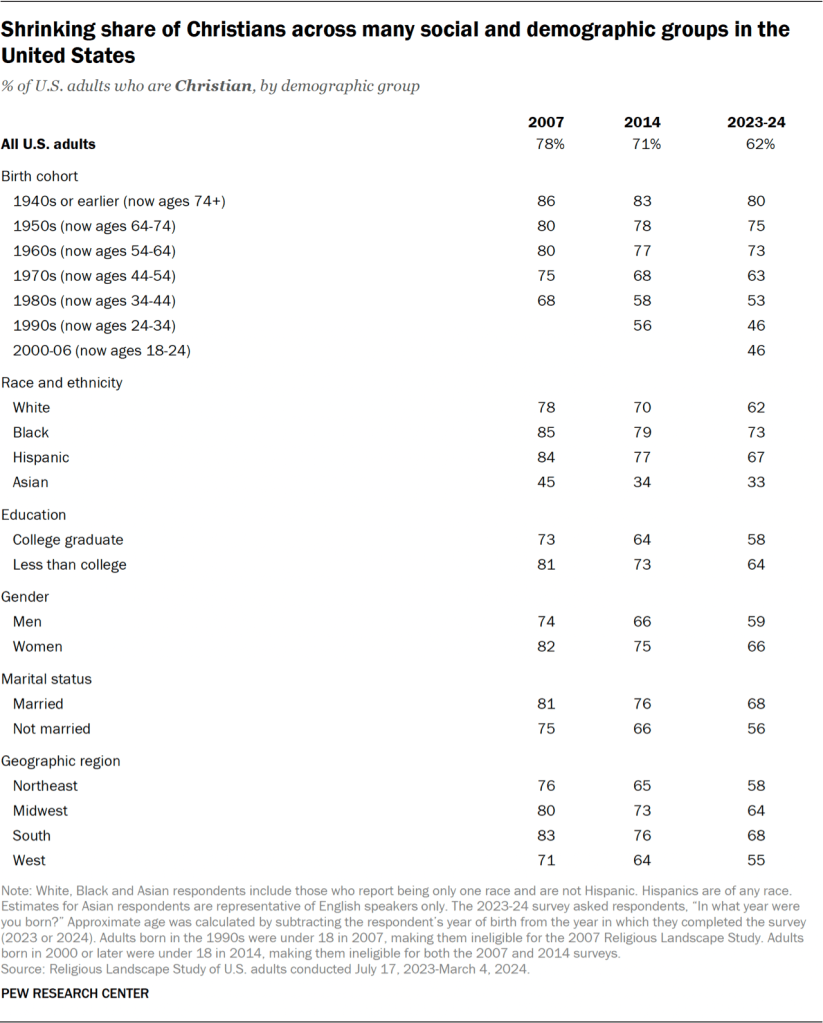
The data shows that the Christian share of the population has declined across many demographic groups. Compared with 2007, the percentage of people who describe themselves as Christians is lower among men and women; college graduates and those with less education; all racial and ethnic groups large enough to analyze; all age groups; and all geographic sectors of the country.
The picture is reversed for the religiously unaffiliated – a group sometimes referred to as religious “nones.” The “nones” are made up of U.S. adults who describe themselves as atheists, agnostics or “nothing in particular” when asked about their religion. The ranks of “nones” have grown among men and women, married and unmarried people; college graduates and people with less education; all large racial and ethnic groups; all age groups; and in all regions of the country.
This chapter includes sections on:
- Trends within Christianity
- A detailed look at the size of Protestant denominations
- Trends among religiously unaffiliated Americans
- Trends among religions other than Christianity
The chapter concludes with a set of detailed tables on the religious composition of key demographic groups.
Trends within Christianity
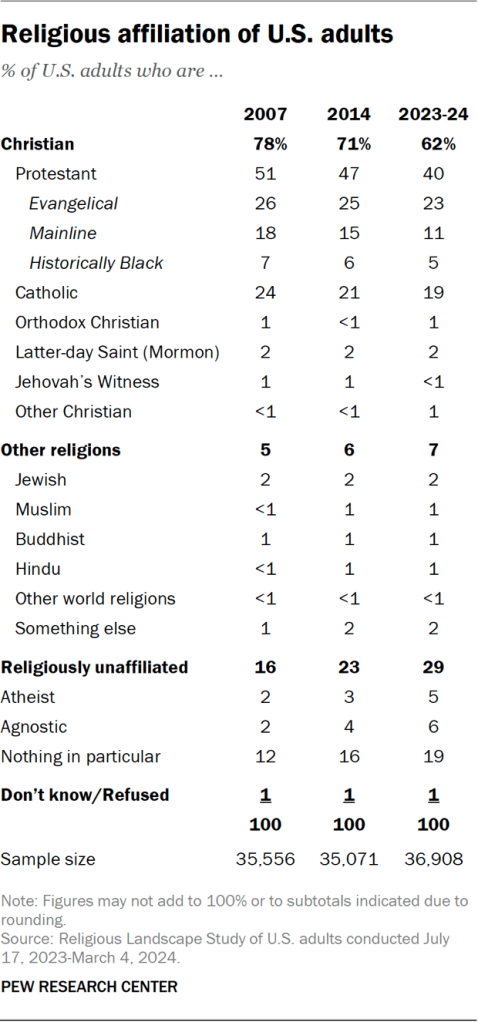
In the 2023-24 Religious Landscape Study (RLS), 62% of respondents identify as Christian, which is lower than the Christian shares measured in the 2007 (78%) and 2014 (71%) studies.
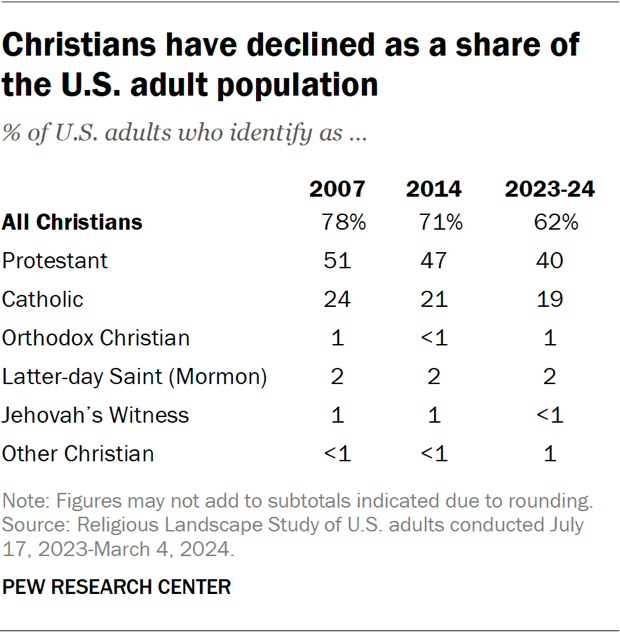
The Protestant share of the population declined from 51% in 2007 to 40% in 2023-24.
The Catholic share of the population, meanwhile, ticked down from 24% in 2007 to 21% in 2014. Since then, it has ranged between 18% and 21% in Center surveys, and it stands at 19% in the 2023-24 RLS.
Members of the Church of Jesus Christ of Latter-day Saints (widely known as Mormons) have accounted for 2% of respondents in all three religious landscape surveys. Orthodox Christians account for 1% of the population in the latest RLS.
Fewer than 1% of respondents in the new survey identify as Jehovah’s Witnesses, and 1% identify either with more than one Christian group (e.g., people who say they identify as both Protestant and Catholic) or with a variety of other, smaller Christian groups (including Messianic Jews, Christian Scientists, or offshoots of Catholicism that are not in communion with Rome).
Christian shares across social and demographic groups
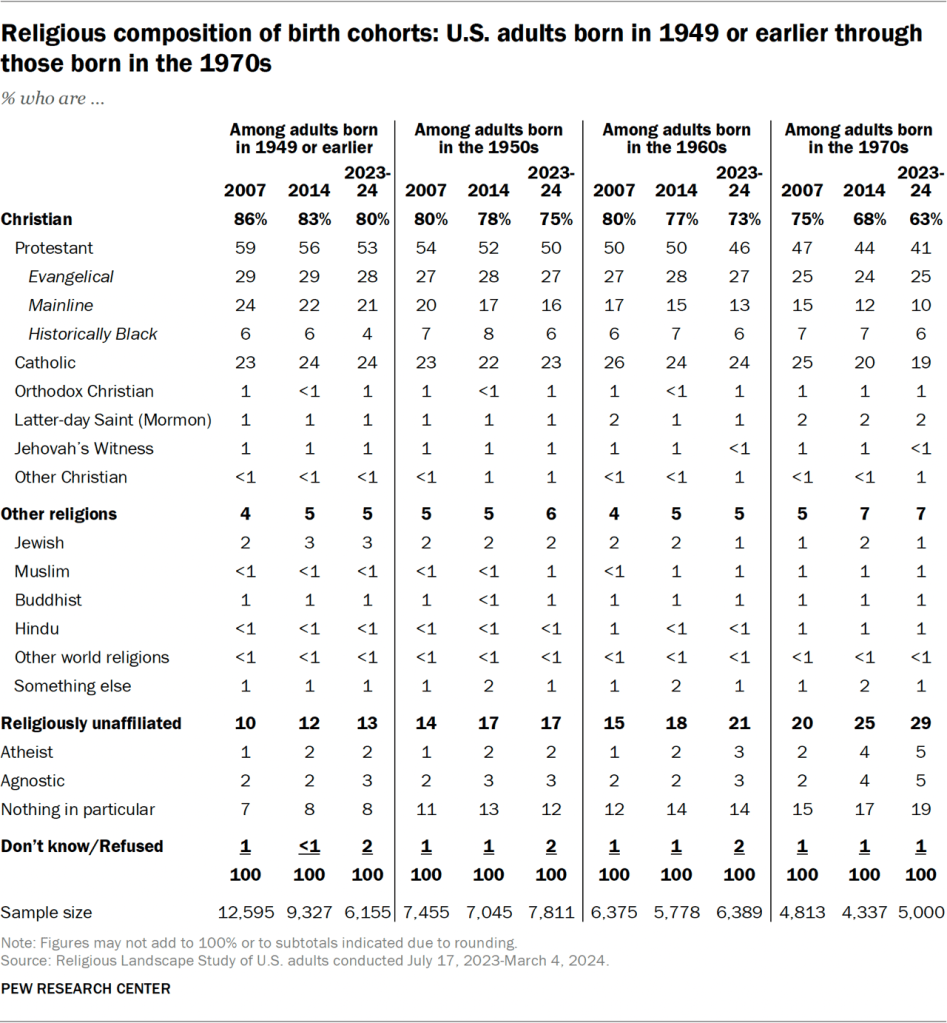
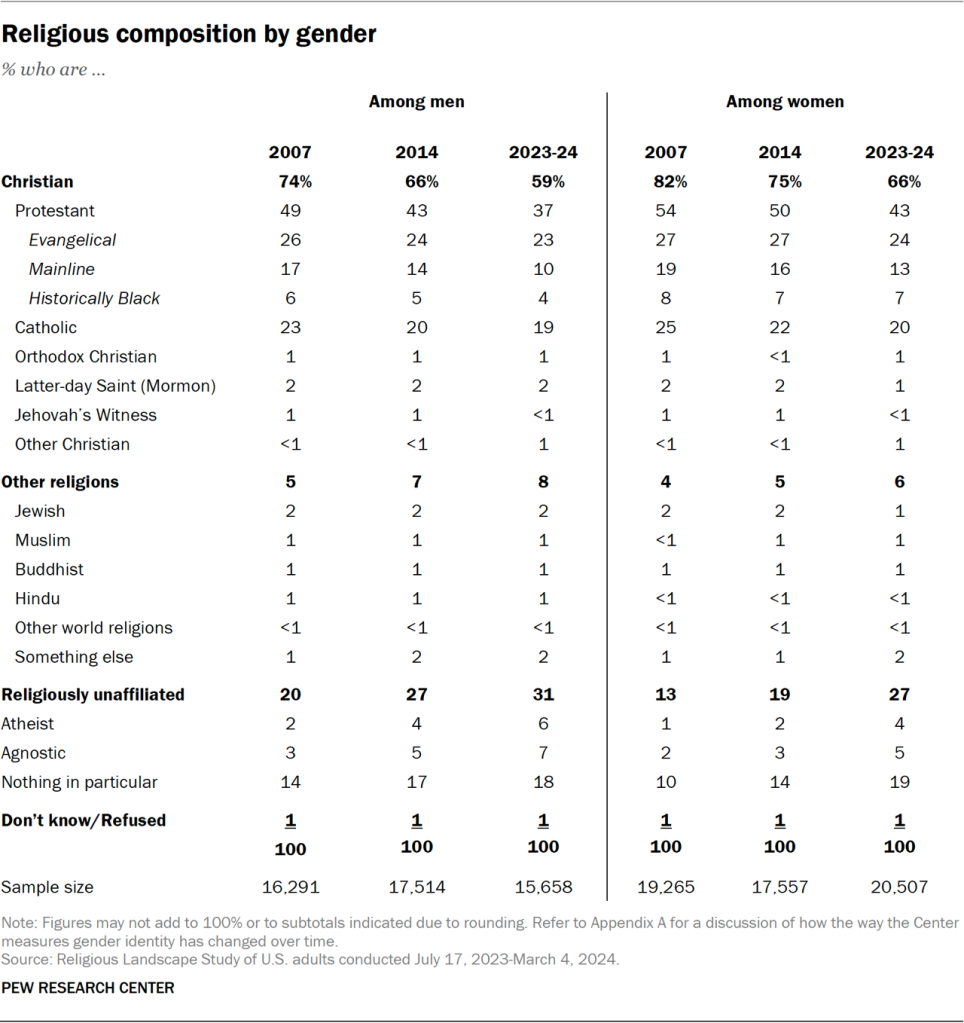
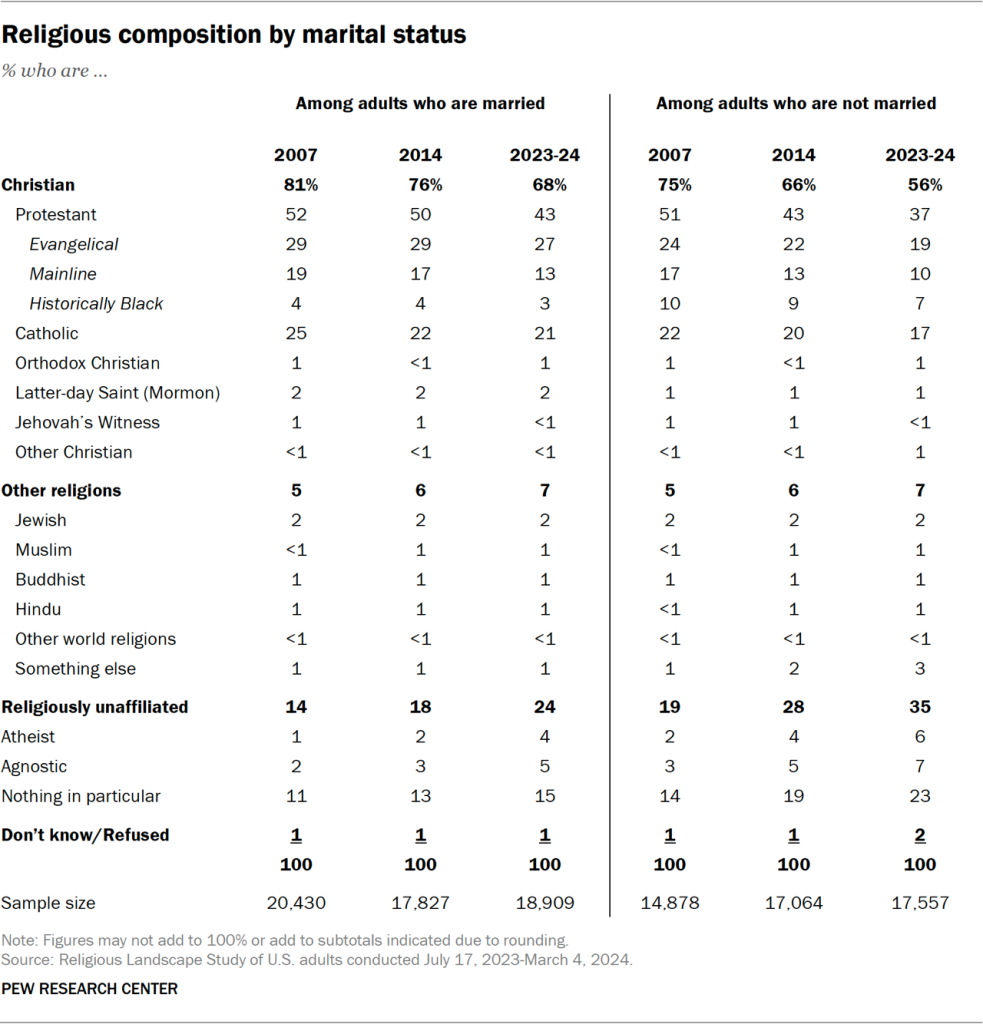
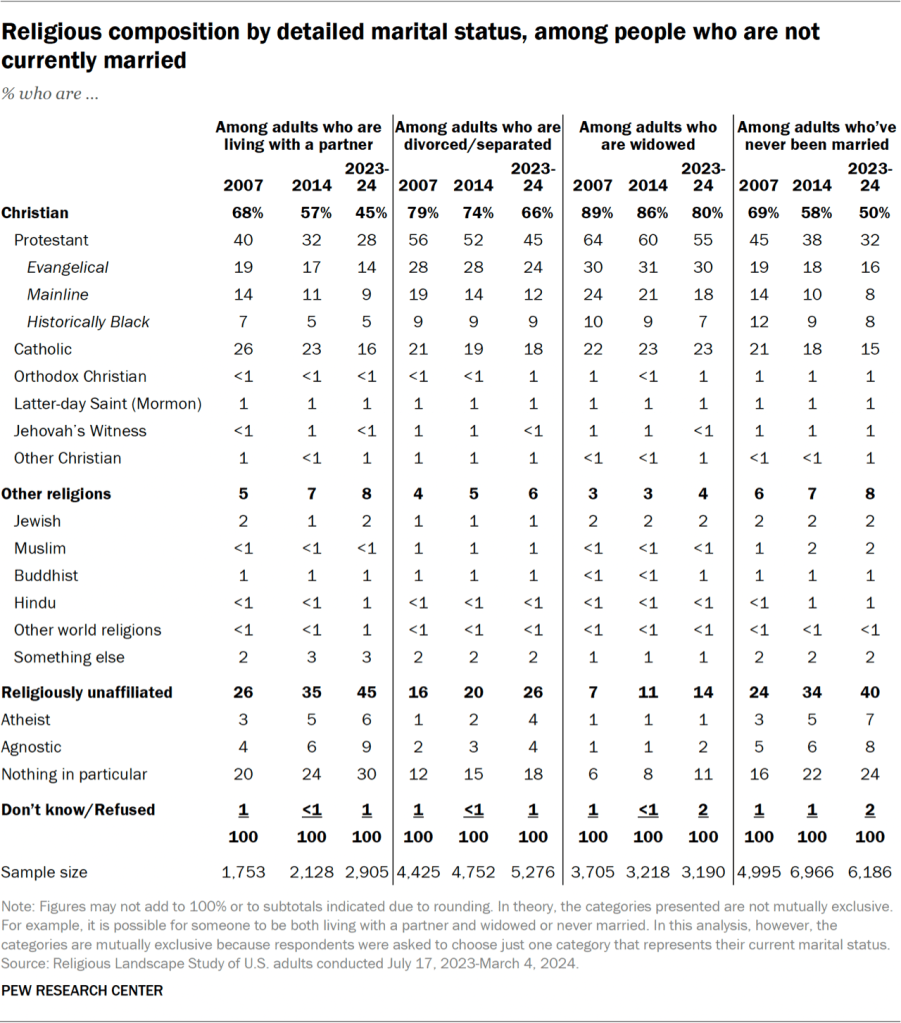
In all three of our landscape studies, younger Americans, men, unmarried people and college graduates have identified as Christians at lower rates than, respectively, older adults, women, married people and adults with less than a college degree.
But one thing all these demographic groups have in common is a long-term decline in the share who identify as Christians. For example, although women have identified as Christians at higher levels than men in all three landscape surveys, the share of women saying they are Christian has dropped from 82% in the first RLS (2007) to 66% in the most recent one (2023-24).
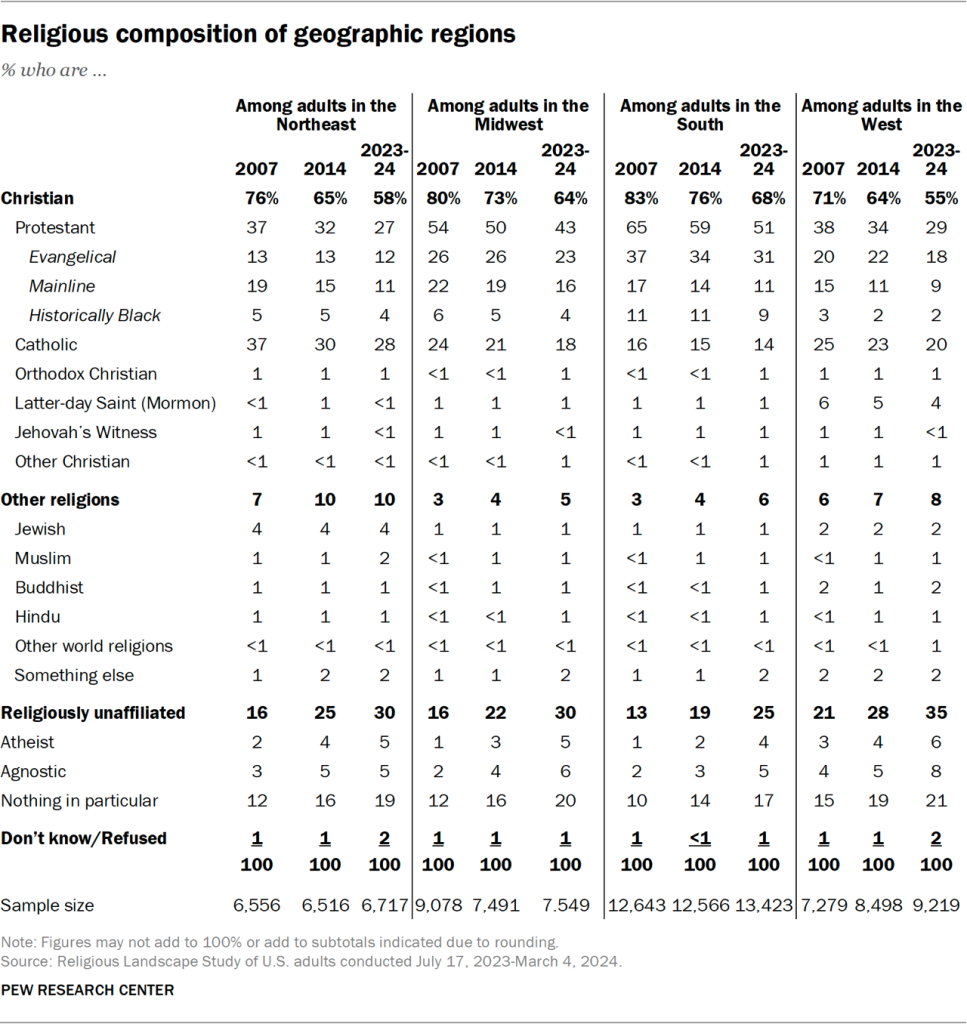
In addition, people of every racial and ethnic background that we measure are less likely to say they are Christian now than they were in 2007, as are people in every major region of the U.S.
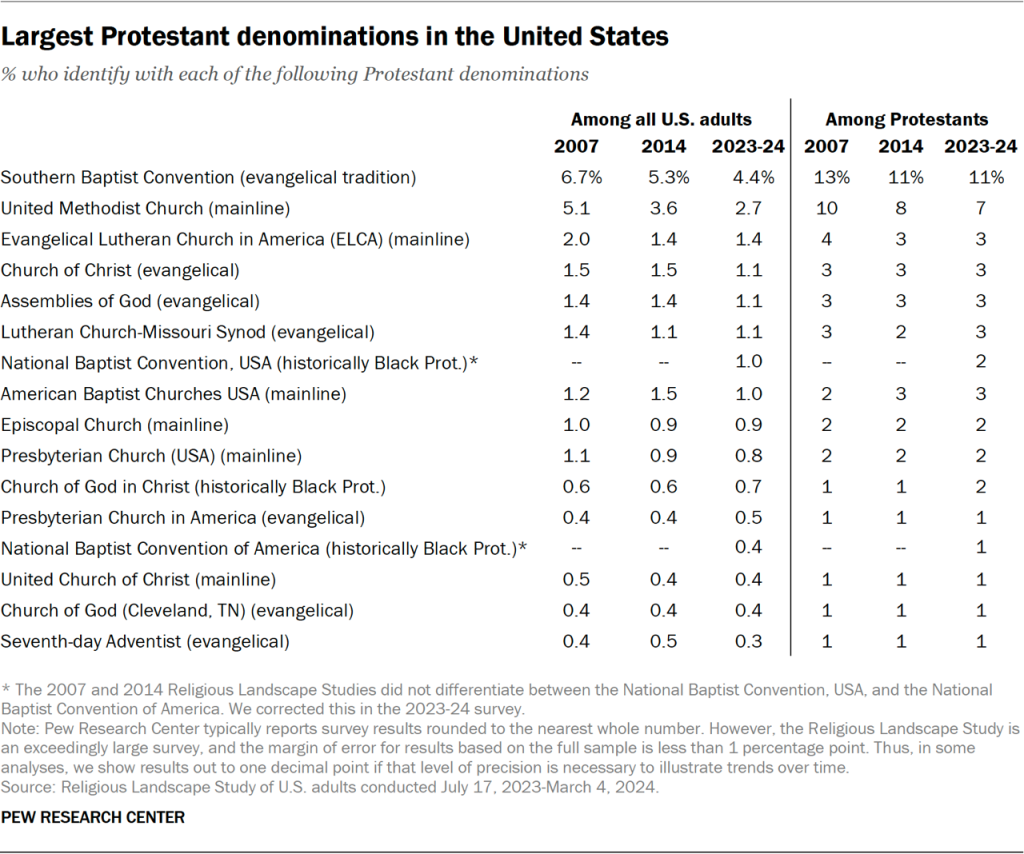
A detailed look at the size of Protestant denominations
One feature of the RLS is that it includes detailed, branching questions to gather information about specific types of Protestants.
The RLS seeks to learn not just whether someone is Protestant, but also what family of denominations (Baptist, Methodist, Lutheran, etc.) they may belong to.
In addition, the RLS goes a step further, seeking to learn which specific denomination within a Protestant family the respondent identifies with, if any. We ask Baptists, for instance, whether they identify with the Southern Baptist Convention; the American Baptist Churches USA; the National Baptist Convention, USA; or another Baptist church. We ask Methodists whether they identify with the United Methodist Church, the African Methodist Episcopal Church, the Global Methodist Church, or another kind of church.30
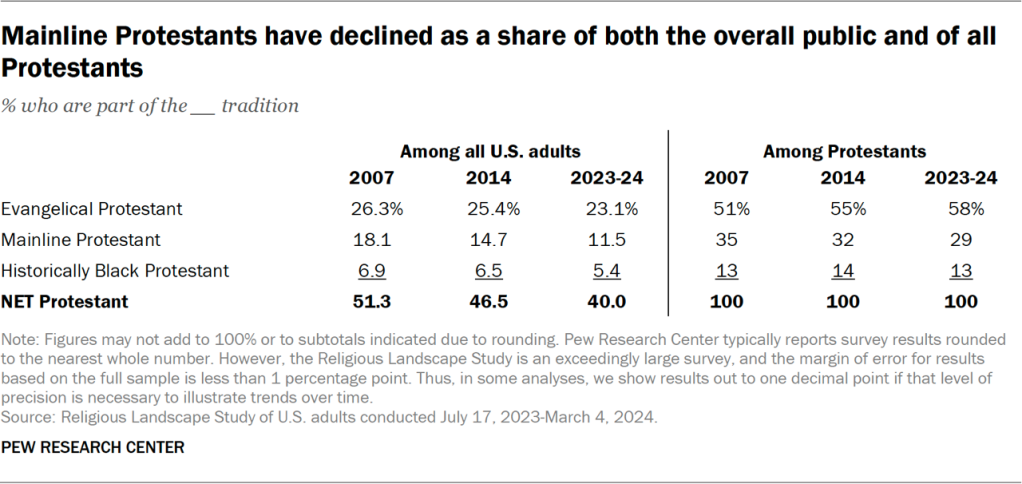
We take this information about which specific denomination respondents identify with and then we categorize Protestants into one of three major Protestant traditions – the evangelical tradition, the mainline tradition or the historically Black Protestant tradition. These divisions within Protestantism are important, because each has a distinctive combination of beliefs, practices and histories.31
Still, some respondents don’t identify with any specific denomination. For example, some describe themselves as “just Baptist,” “just Lutheran” or “just Christian” without providing additional details. In these cases, we use a question that asks respondents whether they think of themselves as “born-again or evangelical” Christians, along with information about their race and ethnicity, to help classify them into one of the three major Protestant traditions. (Refer to Appendix B for complete details about how Protestants are sorted into the evangelical, mainline and historically Black traditions.)
All three of these Protestant traditions have declined, at least a little, as shares of the U.S. adult population since the first RLS was conducted in 2007. The mainline Protestant category has exhibited the sharpest drop, declining from 18% of U.S. adults in 2007 to 11% in 2023-24. Evangelicalism remains the largest tradition within Protestantism, but the evangelical share of the adult population also has ticked down, going from 26% in 2007, to 25% in 2014, to 23% in 2023-24. Respondents in the historically Black Protestant tradition accounted for 7% of respondents in 2007 and 5% in 2023-24 (after rounding to the closest whole number).
Because of the steepness of the decline in mainline Protestantism, evangelicals have risen as a share of all Protestants (even as evangelicals have fallen as a percentage of the overall adult population).
Largest Protestant denominational families
Baptists have been the single largest family of U.S. Protestant denominations in all three religious landscape surveys. They make up 12% of U.S. adults as of 2023-24.
Nondenominational Protestants, the second-largest family of Protestant denominations, now account for 7% of the adult population. This is the only Protestant family of denominations that is larger as a share of the U.S. population in the new survey than it was in the first RLS.32
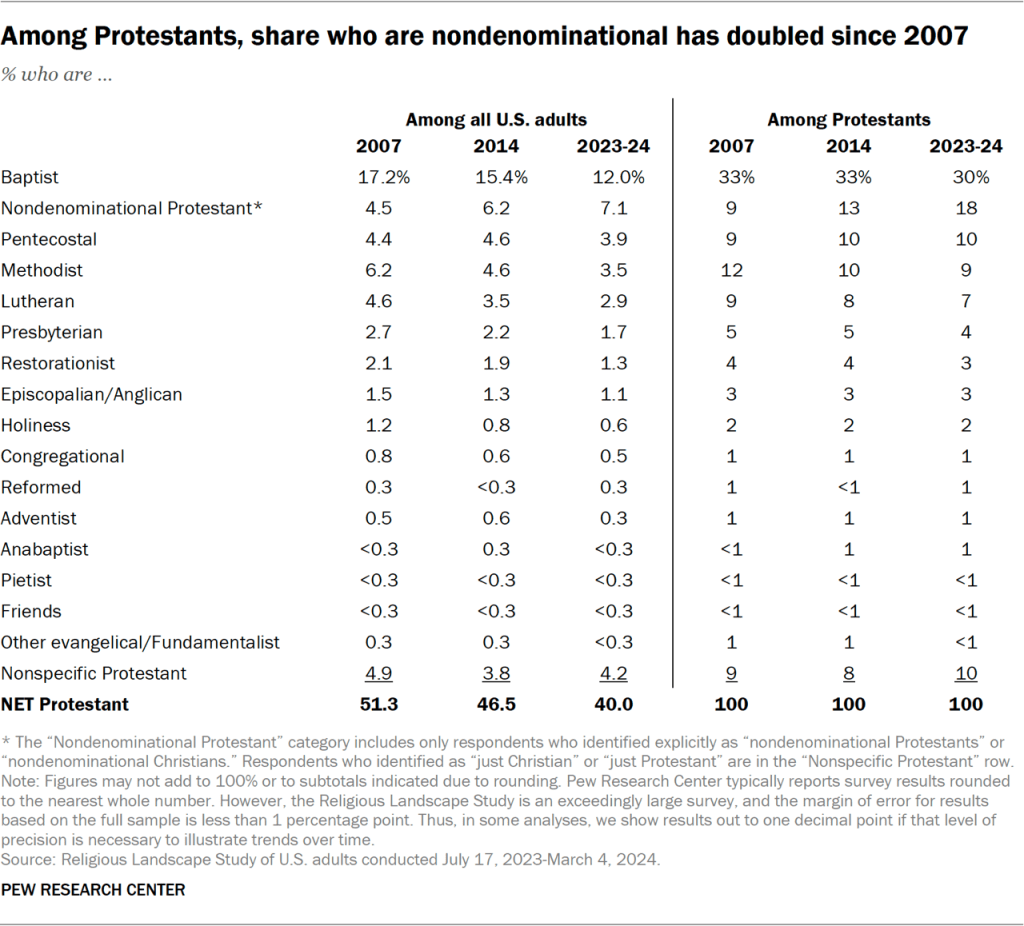
Most other denominational families have seen either a slight decline or relative stability in their share of the U.S. adult population since 2007.
In the new survey, 4% of respondents identify with the Southern Baptist Convention, the nation’s largest evangelical denomination in our categorization. And 3% of U.S. adults identify with the United Methodist Church, making it the largest mainline denomination in the new survey. Overall, 1% of respondents in the new survey say they identify with the National Baptist Convention, USA, and 1% affiliate with the Church of God in Christ – two of the largest denominations in the historically Black Protestant tradition.
Trends among religiously unaffiliated Americans
About three-in-ten Americans (29%) are religiously unaffiliated, according to the 2023-24 RLS. This includes 5% who identify as atheist, 6% who say they are agnostic, and 19% who describe their religion as “nothing in particular.”
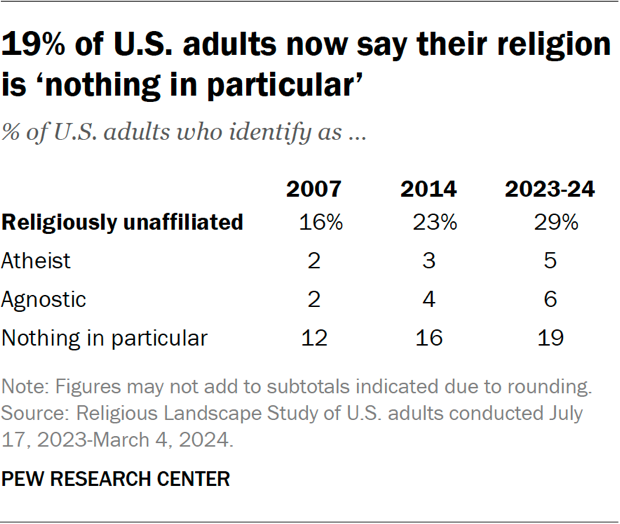
The share of Americans who are religiously unaffiliated – also known as religious “nones” – is markedly higher in the 2023-24 RLS than it was in 2007 (16%) and 2014 (23%). In the last several years, however, the growth of the “nones” seems to have slowed. (Refer to the Overview of this report for additional discussion of the short-term stability in the religiously unaffiliated population.)
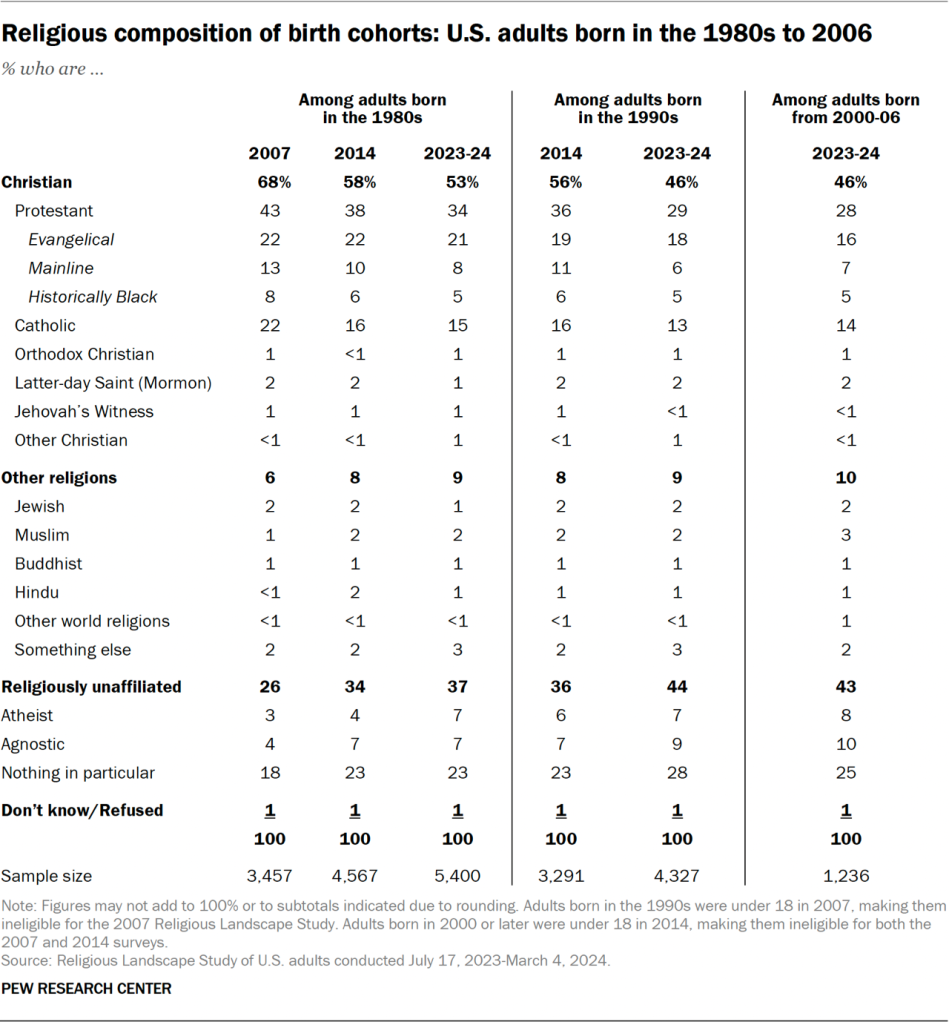
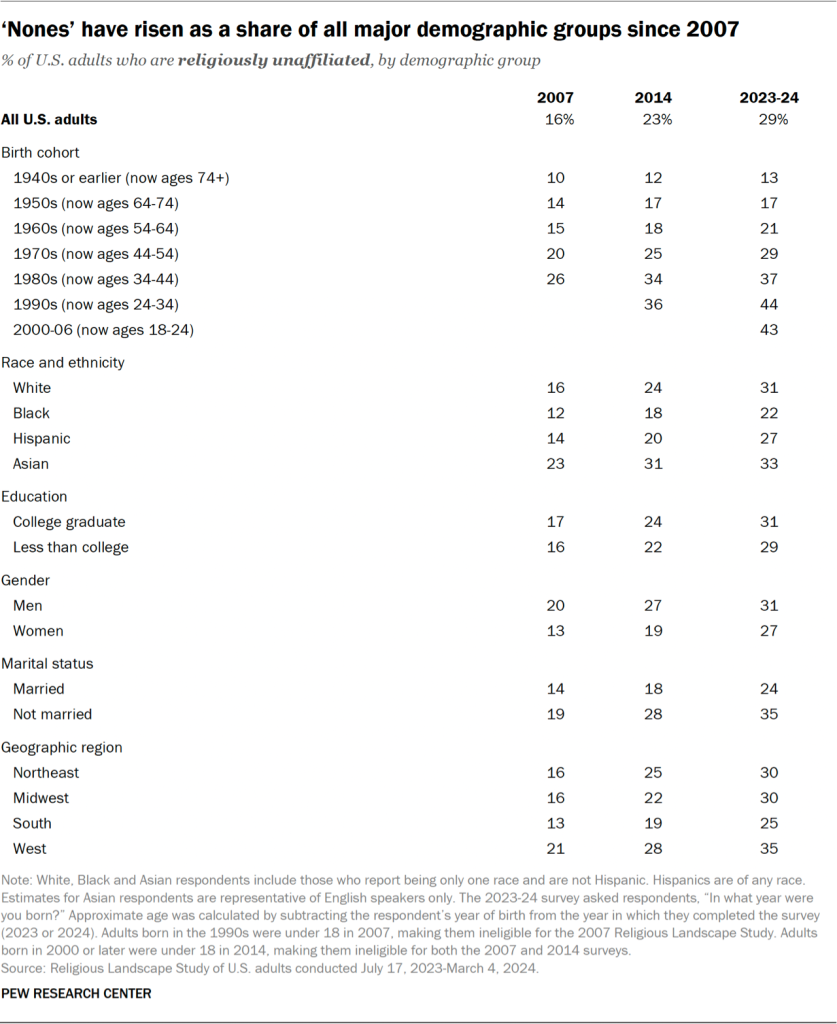
While the percentage of “nones” varies across social and demographic groups, the direction of the trend from 2007 to 2023-24 is the same across the board: It is up, at least marginally, in every category.
Among Americans born in the 1980s, for example, 26% were religiously unaffiliated in 2007. In 2023-24, that share stands at 37%. The percentage of “nones” also has grown among both men and women; among married and unmarried people; within all major racial and ethnic categories; and in all regions of the country.
Trends among religions other than Christianity
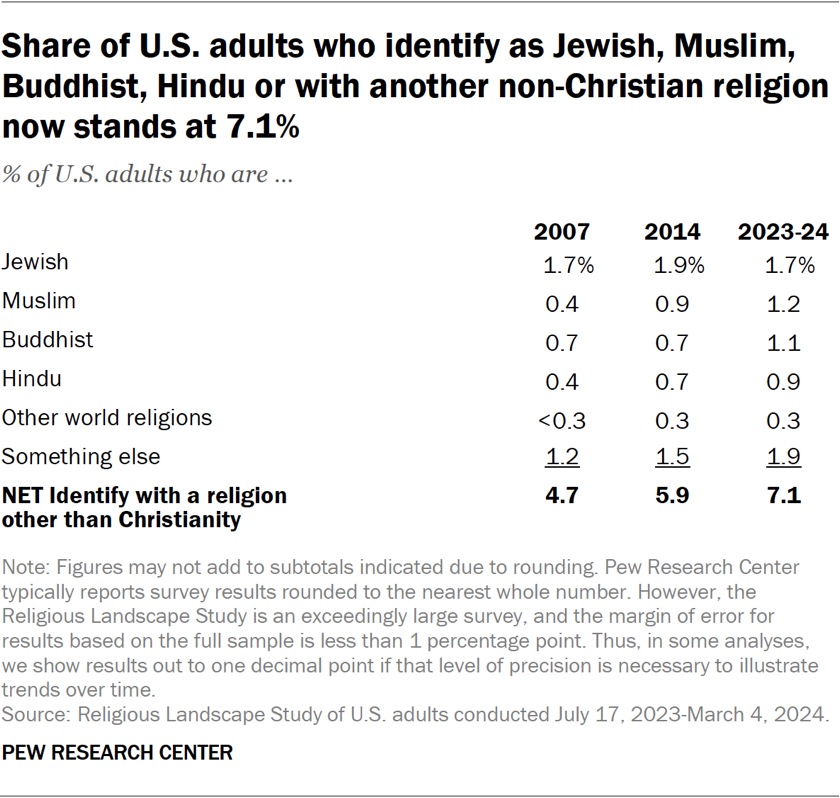
The share of Americans who identify with religions other than Christianity has increased – albeit from a small base – from 4.7% of U.S. adults in the 2007 RLS to 7.1% in the 2023-24 RLS.33
In the new survey, 1.7% of respondents identify as Jewish when asked about their religion, while 1.2% identify as Muslim, 1.1% as Buddhist, and 0.9% as Hindu. The new survey finds that less than 0.3% identify with other world religions (such as Sikhism, Daoism, Bahaism and Zoroastrianism) and 1.9% identify with something else, religiously speaking (such as Unitarian Universalism, Pantheism, Wicca, etc.).
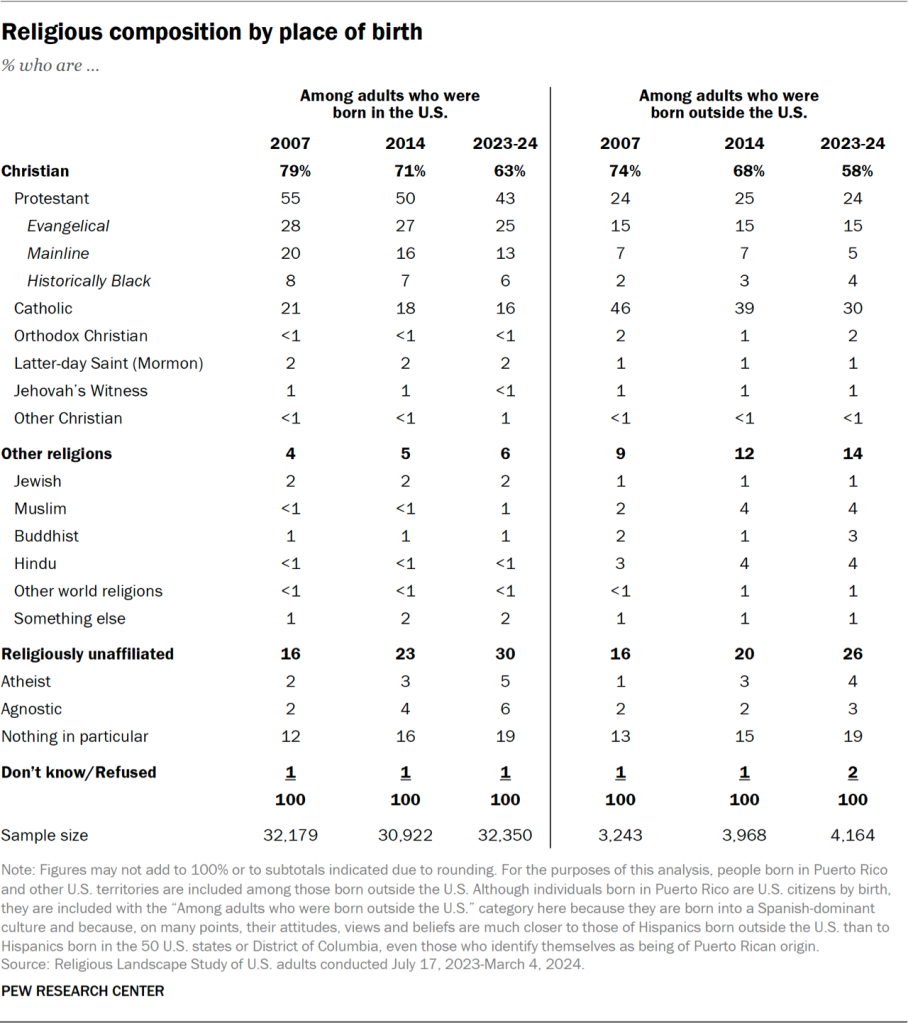
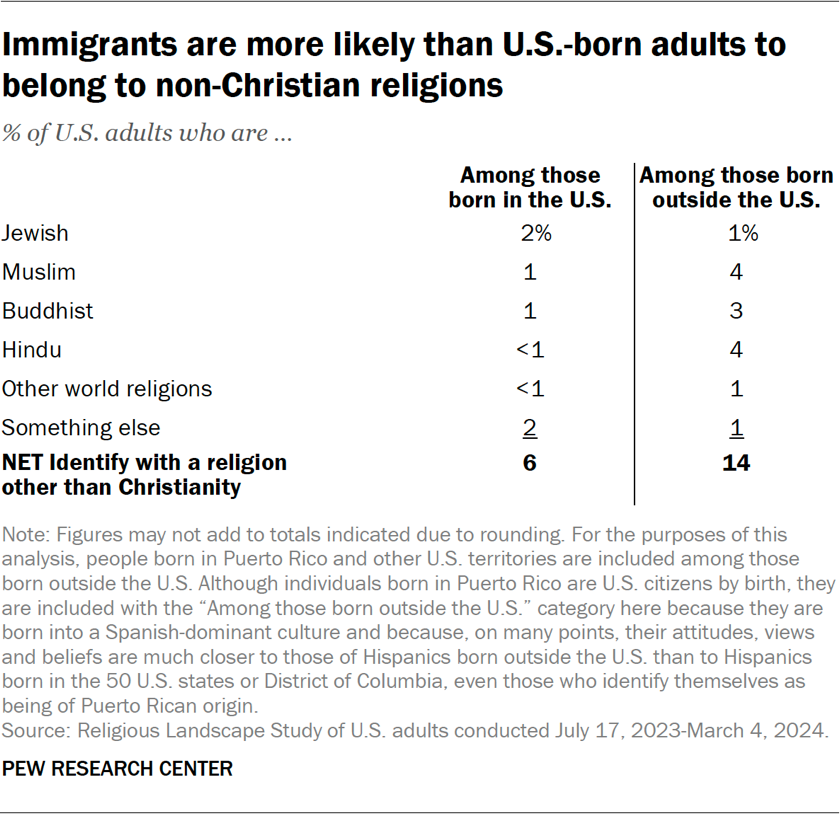
Immigrants in the United States are more likely than adults who were born in the U.S. to identify with a non-Christian religion. Among immigrants, 14% identify with a religion other than Christianity, compared with 6% of respondents born in the U.S.
Detailed tables