
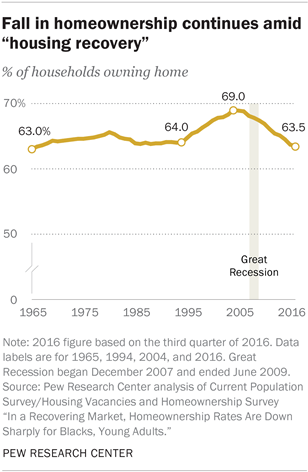
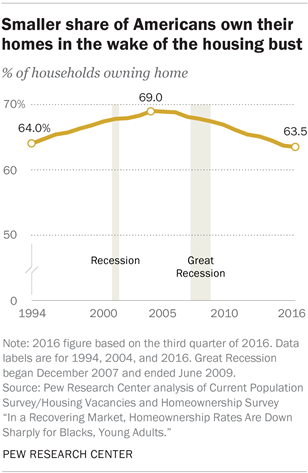
Even as home values climb back from the dramatic fall that helped set off the Great Recession, homeownership in the United States stands at its lowest level in at least 20 years. As of the third quarter of this year only 63.5% of households own their homes, down significantly from the modern peak of 69.0% reached in 2004.
A Pew Research Center analysis of Census Bureau and mortgage loan data indicates that the decline in ownership since 2004 has been more pronounced among households headed by young adults, blacks and those in the lower income tier. A substantial portion of the ongoing falloff in homeownership reflects fewer renter households transitioning to homeownership, rather than homeowners being forced out of the market through foreclosure or other financial difficulty.
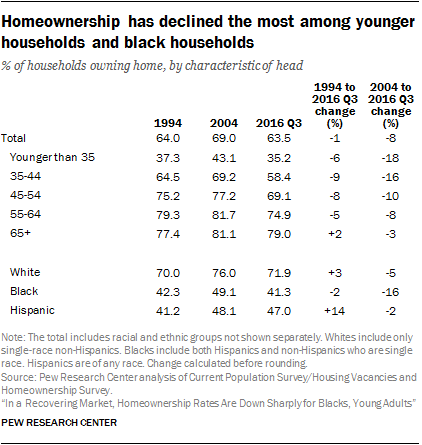
Though the overall homeownership rate has fallen to about its 1994 level (before home values started their sharp ascent), homeownership rates for several key demographic subgroups have sunk below their 1994 levels. For households headed by those under age 65, today’s homeownership levels are near the lowest on record since 1982 (the earliest year available). For example, in 1982, 41.2% of households headed by an adult younger than 35 were homeowners, a share that fell to 37.3% in 1994 and only stands at 35.2% today. Similarly, homeownership rates have fallen for black households: In 1994, 42.3% of these households owned their homes; in 2016, 41.3% were homeowners.1
And while a new Pew Research Center survey shows that a solid majority (72%) of renters say they would like to buy a home in the future, several noteworthy trends in residential housing markets have made becoming a homeowner a more challenging proposition for today’s renters than was the case during the housing run-up.
Lending standards are much more stringent today than they were as home values were climbing in the early 2000s. Researchers at the Urban Institute have quantified trends surrounding risk in the mortgage market. Their housing credit availability index measures the extent to which lenders are willing to tolerate mortgage defaults and relax credit standards (higher percentages indicate looser lending standards). What the researchers designated as “reasonable lending standards” in 2001-03 had an index level of 12.5%. The latest reading is at 5.1%.
For some potential home buyers, these tightening credit standards may be a deterrent to entering the market. While loan approval rates are up compared with 2004 levels, loan applications are down significantly, and the falloff has been most dramatic among black and Hispanic applicants. In addition, the types of loans many of these borrowers relied on prior to the crash have largely dried up. For example, in 2004, 32% of loans to black borrowers were higher priced or “subprime”; in 2015 only 7% were. To be sure, there is an upside to the changed lending environment. Mortgage defaults have declined and fewer homeowners are struggling to manage their home loans.
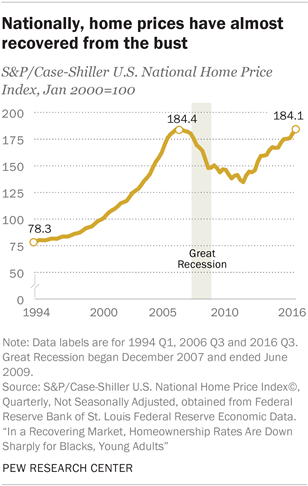
Beyond the tightening credit market, rebounding home values have made it more difficult for some renters to get into the market. Nationally, home prices have recovered nearly all of the ground lost during the housing bust. According to the S&P/Case-Shiller U.S. National Home Price Index, home prices peaked in mid-2006. Ten years later, prices are back near their peak (at least in nominal terms, not adjusting for price inflation). From the vantage point of renters, price appreciation puts homeownership further out of reach in two ways: It increases the amount they need to borrow, increasing the prospective monthly mortgage payment; and it increases the amount of the down payment needed to obtain a mortgage.2 The typical renter does not have large financial assets to tap in order to come up with a down payment.3 And an analysis of Federal Reserve data shows that the typical amount of financial assets owned has decreased over the past decade for younger and lower- and middle-income renters.
In addition, while it wasn’t uncommon for buyers of modest means to take out multiple loans during the housing bubble, enabling them to borrow the down payment, most borrowers today take out only one mortgage to finance their purchase and have to put some money down.
On the upside, low interest rates have provided a powerful incentive for many renters to enter the real estate market. The extent to which these competing factors have affected potential buyers varies widely across geographic areas.
The new Pew Research Center survey, conducted Nov. 3-6 and Nov. 17-20, 2016, among 2,000 adults nationwide, finds that roughly a third of today’s renters say they rent as a matter of choice, and about seven-in-ten would like to buy a home at some point in the future. The most prominent reasons that renters provide for renting rather than owning include financial obstacles, specifically the inability to afford a down payment on a house; not being able to afford to buy the home or buy in the neighborhood they seek; and the desire to pay down debts before taking on a mortgage. Financial obstacles to homeownership loom larger among nonwhite adults.4
This analysis explores trends in homeownership since its peak in 2004, as well as some reasons for its decline. It includes a look at the standard census data on homeownership, home loan application data collected in accordance with the Home Mortgage Disclosure Act (HMDA), and Federal Reserve data on the financial assets owned by renter households.
Declines in homeownership have been particularly steep among young, black and lower-income households
The share of Americans owning their homes has been on a downward trajectory since its 2004 peak during the housing boom in the mid-2000s.
Prior to the run-up in home buying, which began in 1994, homeownership rates had been stable for decades.5 And while today’s rate (63.5%) is comparable to where it was in 1994 (64.0%), the demographics of homeowning households have changed significantly. The typical household head is older now – age 51 today vs. 45 in 1994. Older households tend to be more likely to own their homes than younger households, and thus today’s homeownership rate is being propped up, in part, by an aging America.6
The decline in homeownership since 2004 has been most apparent among young adults as well as among black, lower-income and unmarried households, all groups that historically have had significantly lower rates of homeownership. In households headed by adults younger than 35, homeownership fell sharply from 43.1% in 2004 to 35.2% today – an 18% drop – and the decline has been nearly as large among households ages 35 to 44 (16%). In contrast, homeownership has fallen just 3% among households headed by those 65 and older, from 81.1% at its peak in 2004 to 79.0% today.
Across major racial and ethnic groups, households headed by a black person have seen the greatest decline in homeownership since its peak. Homeownership was at a record high7 in 2004 for both white (76.0%) and, albeit at a far lower level, black (49.1%) households. Today, only 41.3% of black households own their homes, a 16% decline compared with 2004. Among white households, 71.9% are homeowners, down 5% from 2004. For Hispanic households, peak homeownership occurred in 2007. Since then, homeownership among Hispanic households has seen a 5% decline, from 49.7% to 47.0% today.
The decline in homeownership has also been somewhat steeper among lower-income households than among their middle- and upper-income counterparts.8 In 2005, homeownership rates among those in the lower income tier peaked at 52.9%. Today, 47.1% of households in this income group (a household income below about $44,000 based on a three-person household) own their homes – a drop of 11%.
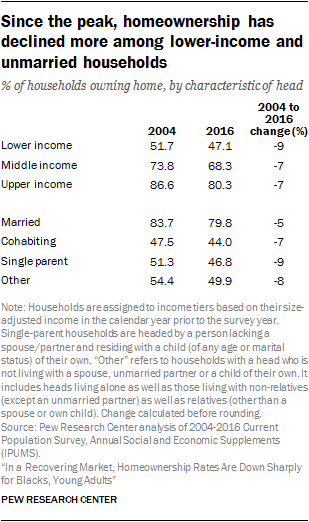
Households in the middle and upper income groups are more likely than lower-income households to own their homes, and the decline in ownership has been more modest among these groups. For example, 68.3% of those with incomes between $44,000 and $132,000 for a three-person household (the middle income tier) own their homes today, compared with 73.8% at its peak in 2004, representing a 7% decline. Households in the upper income tier (above about $132,000) have also seen a 7% drop in homeownership rates during this period.
Households headed by married couples tend to be economically better off and are more likely to be homeowners.9 Today about 80% of married households are homeowners, compared with 50% or less for other types of households.
Homeownership among married couples declined about 5% from 2004 (83.7%) to 2016 (79.8%). The decline in ownership has been steeper among non-married households. Among single-parent households, homeownership fell from 51.3% in 2004 to 46.8% in 2016, a 9% decline. Among households headed by a person not living with a spouse, unmarried partner or one of their own children, homeownership fell from 54.4% in 2004 to 49.9% in 2016 (an 8% decline).
Fewer potential homebuyers are applying for mortgages
The decline in homeownership since its peak in 2004 reflects two key trends: a drop in the number of renter households becoming owners, and a rise in the number of homeowners becoming renters, whether by choice or because of economic distress. Federal Reserve data indicate that the lack of movement into the housing market has been a larger factor in the overall decline in homeownership. These data show that, at least in terms of the dollar amount of outstanding mortgage debt, changes in outflows (households eliminating mortgage debt due to default or payoff) since 2005-07 have not been nearly as dramatic as the changes in inflows (households taking on new or increased mortgages). In addition, outflows peaked in 2009-11 and have since subsided as mortgage defaults have become less prevalent.
Loans for home purchase are down substantially
The scale of entry into homeownership is difficult to measure, but data on home purchase loans gathered in accordance with the Home Mortgage Disclosure Act (HMDA) provides a rough proxy. The HMDA data capture the annual volume of home mortgage applications and originations (originated loans make it through the application process and funds are dispersed to buy the home). It also includes information on “higher-priced loans,” a proxy for subprime borrowing. Although not exactly a census of all mortgage applications, most lending activity for the purpose of buying or refinancing a home is included in the HMDA records.
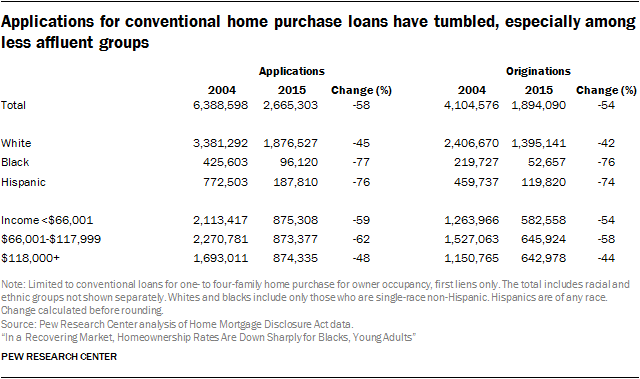
Focusing only on conventional home purchase loans for owner-occupied, one- to four-family dwellings (excluding manufactured homes), originations for conventional home loans fell 54%, from 4.1 million in 2004 to 1.9 million in 2015.10
The decline in mortgage volumes probably overstates the decline in home buying activity, as some buyers purchase their homes using cash and do not need financing. Data collected by the Census Bureau on residential moves circumvents the issue of how the home was bought. In 2004, 4.8 million homeowners lived somewhere else one year earlier. In 2016, 3.4 million homeowners lived at a different address, suggesting a 30% decline in home buying. The census data and the loan data both suggest a large decline in housing activity, though the precise size is unclear.
The mortgage loan data make clear why many fewer mortgages are originated now compared with 2004: Applications for conventional home loans fell 58%, from 6.4 million in 2004 to 2.7 million in 2015. Among blacks and Hispanics, loan applications saw a steep decline of 77% and 76%, respectively, compared with a 45% drop among whites. Similarly, during the same period, loan applications fell by 59% among those with incomes below $66,001 and by 62% among those with incomes between $66,001 and $117,999, compared with a 48% drop among those with incomes of $118,000 or more.11
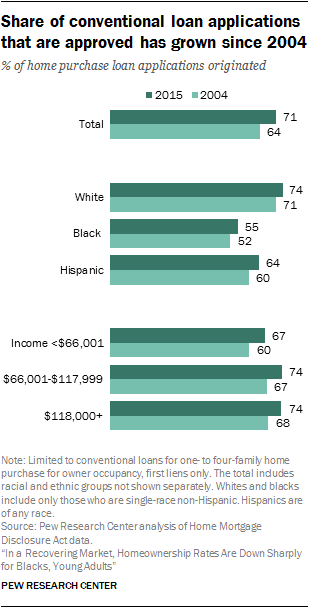
Yet, while home loan applications declined between 2004 and 2015, loan approval rates (the share of applications that are ultimately funded or originated) increased during the same period among all applicant groups. This is partly because fewer conventional loan applications are denied now compared with 2004. Among all applications, 71% were successful in 2015, compared with 64% in 2004. A higher share of blacks and Hispanics who applied for loans in 2015 were approved than was the case in 2004. Similarly, low-income loan applicants were more likely to have their loans approved in 2015 than in 2004. However, far fewer households were applying for loans in 2015, and the pullback in applications has been greater among black and Hispanic households and applicants with incomes under $118,000.
Since the housing crash, borrowers with excellent credit scores have increasingly dominated the market and lending to those with low credit scores has all but ceased. While it is difficult to match credit risk to demographic characteristics, black and Hispanic borrowers are more likely than their white counterparts to have low credit scores. In 2013, 22% of black and 16% of Hispanic borrowers, respectively, had lower credit scores (a FICO score below 660), compared with only 10% of white borrowers. Tightening lending standards have disproportionately reduced applications and originations among minority households since the housing peak.
Blacks, Hispanics and lower-income applicants relied heavily on subprime loans, which have largely dried up
Before the housing crash a non-trivial portion of conventional home loans were higher-priced or “subprime” loans. Higher-priced loans have an annual percentage rate (APR) at least 1.5 percentage points above the average prime offer rate. These types of loans provided applicants with checkered credit histories, lower incomes and smaller down payments the opportunity to finance their home purchase. In return for the higher risk of default on such loans, lenders were compensated with a higher APR.
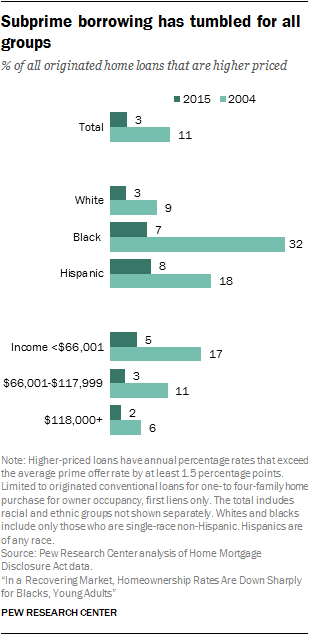
Higher-priced loans have been substantially scaled back. In 2015, only 3% of originated conventional home purchase loans were higher-priced. Back in 2004, 11% of mortgage originations were higher-priced. More disadvantaged borrowers are more likely to have subprime loans and were much more heavily dependent on them in 2004. For example, among borrowers with incomes below $66,001, 5% of loans were subprime in 2015 (down from 17% in 2004). By comparison, only 2% of borrowers with incomes of $118,000 or above relied on subprime loans in 2015 (down from 6% in 2004).
The falloff in subprime lending has been particularly dramatic among black and Hispanic borrowers. In 2004, 32% of loans to black borrowers were subprime; by 2015, that share had fallen to 7%. Similarly, the share of loans to Hispanic borrowers that were subprime fell from 18% in 2004 to 8% in 2015.
Since the subprime loan market facilitated entry into homeownership among less advantaged borrowers, its demise has also likely contributed to the differential pullback in mortgage applications since 2004.
Potential homebuyers may struggle to come up with a down payment
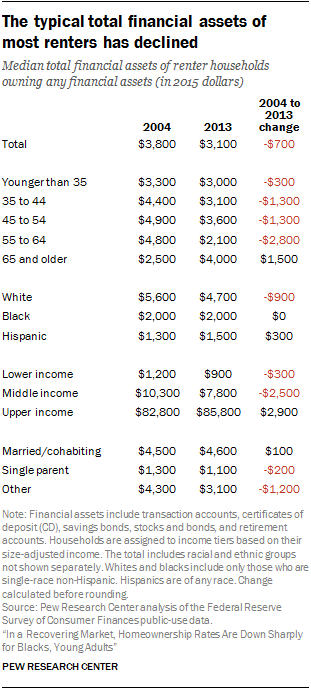
In addition to tightening credit conditions, down payment requirements are also higher than they were before the recession. This, combined with the fact that renters across most demographic groups have experienced a decline in the typical amount of financial assets owned from 2004 to 2013 (the most recent year for which data is available), has made it increasingly difficult for many potential homebuyers to join the ranks of homeowners.
Data from the Federal Reserve’s Survey of Consumer Finances, one of the nation’s most comprehensive sources of information on the financial assets of U.S. households, show that the typical renter has very modest financial assets. In 2013, 12% of renters reported owning no financial assets whatsoever. Financial assets include cash, checking and savings accounts, savings bonds, certificates of deposit (CD), and retirement accounts (such as a 401(k) or IRA).
While the share of renter households owning any financial assets modestly increased, from 85% in 2004 to 88% in 2013, the estimated median amount owned by renter households who had any assets declined from $3,800 to $3,100 during the same period. Across income groups, renters with middle incomes experienced the greatest decline in financial assets. In 2004, the median amount owned by this group was $10,300; by 2013, it was $7,800. In contrast, the median amount of financial assets owned by upper income renters increased from $82,800 to $85,800.
Given the modest amounts of financial assets owned by renters, how likely are they to have the required down payment to obtain home financing? Data from September 2016 show that the typical home in the bottom third of all U.S. homes was valued at $107,100. An optimistic estimate is that the mortgage lender for a conventional home loan requires a 3% down payment, or $3,213, to secure financing. The Federal Reserve data indicate that the typical renter would be hard-pressed to have the financial assets to obtain financing.
This assumption of a 3% down payment is an exceedingly optimistic one for a segment of buyers. Although lending standards have recently eased, higher down payments are more common than they were before the Great Recession. And, since 2008, low credit score borrowers have had to make larger down payments on average than higher-scored borrowers.
Newly collected survey data by the New York Federal Reserve Bank reveal that renters’ homebuying intentions are particularly sensitive to down payment requirements. Among renters in the survey, the likelihood of buying a home increased from 17%, when assuming a 20% down payment, to 58% if the down payment were 0%.
Additional evidence that down payment requirements are an important barrier to homeownership comes from homeownership trends after 2004. Nationally, homeownership peaked in 2004. From 2003 to 2007, lending standards eased considerably and house prices were driven up. Homeownership did not increase further beyond 2004 because the run-up in housing values increased the down payment amounts that prospective owners needed to obtain financing.
Another constraint on homeownership is that renters need to have sufficient household income to service their debts. The general rule of thumb is that the mortgage borrower’s total monthly debt payments (including mortgage payments) should not exceed 36% of household income. The Survey of Consumer Finances provides an estimate of the share of monthly income devoted to servicing debt, and by this measure, most renters do not appear to be in worse straits than in 2004. In 2013, the typical renter devoted 7% of monthly income to service debt, down only slightly from 8% in 2004. Although their household incomes are likely not greater today than in 2004, interest rates are generally lower and they may have lowered some of their debt. Therefore, debt service does not seem to be a greater barrier to homeownership than in 2004 for many renters.
Most renters would like to buy a home in the future, but many cite finances among major reasons for currently renting

In spite of roughly a decade of volatility in the housing market, most Americans still believe owning a home is a solid investment. According to the new Pew Research Center survey, roughly eight-in-ten adults (81%) agree that “buying a home is the best long-term investment in the U.S.” Some 39% say they strongly agree that this is the case, while 42% somewhat agree.
Adults who rent their homes are mostly renting as a result of their circumstances rather than as a matter of choice. And many see their financial situation, such as existing debts or their inability to afford a down payment, as a barrier to owning a home.12
About two-thirds of renters (65%) say they are currently renting more as a result of circumstances, such as not being able to afford to own a home right now, while 32% say renting is a matter of choice – they could buy a home, but they choose to rent instead.
Meanwhile, 72% of renters say they would like to buy a house at some point in the future, compared with 23% who say they would prefer to continue to rent. Even among those who are now renters by choice rather than by circumstance, 60% say they would like to buy a house in the future; 79% of those who are renters as a result of circumstances say the same.
Renters are more likely than they were five years ago to say they are renting as a matter of choice and less likely to say they would like to buy a house in the future. In 2011, about one-quarter of renters (24%) said they were renting as a matter of choice, compared with 32% today. And in the same survey, 81% said they wanted to buy a house at some point, compared with 72% today.
When asked more specifically about the reasons why they rent rather than own their home, renters most commonly cite financial reasons. For example, about half of renters (52%) say not being able to afford a down payment is a major reason, and an additional 19% say this is a minor reason. Some 42% of renters say not being able to afford the kind of house or neighborhood they would want is a major reason for currently renting their homes, the same share that says the desire to pay down debts is a major reason. About four-in-ten (38%) say a major reason for renting rather than owning their home is that they don’t think they can qualify for a loan.
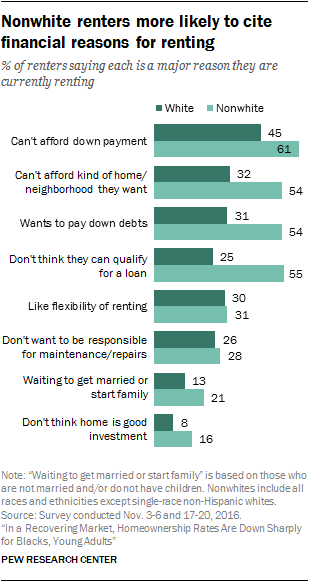
Many renters report other reasons for renting that aren’t directly linked to their financial situation. For example, 31% cite the fact that they like the flexibility of renting as a major reason, with an additional 27% citing this as a minor reason. About one-quarter (26%) say not wanting to be responsible for maintenance and repairs as a homeowner is a major reason for renting. Only 11% say that not thinking a home is a good investment is a major reason they are currently renting.
About one-in-five renters (18%) who are unmarried or childless say a major reason for renting is that they are waiting to get married or start a family.
Nonwhite renters are far more likely than white renters to cite financial reasons for not owning their home. For example, consistent with the falling numbers of loan applications from blacks and Hispanics, 55% of nonwhite renters say that one major reason they are currently renting is that they don’t think they can qualify for a loan, compared with 25% of whites who say the same. By double digits, nonwhites are also more likely than whites to say that not being able to afford a down payment, not being able to afford the kind of home or neighborhood they would want, and the desire to pay down debts are major reasons for currently renting.
There are also substantial differences on views of qualifying for a loan by educational attainment. Among renters with a high school degree or less education, 50% say that one major reason for renting is that they don’t think they can qualify for a loan. By contrast, 36% of those with some college experience or a two-year degree and 18% of college graduates say this. There are no clear patterns by education on the other items.
The general public views homeownership as unaffordable for young adults
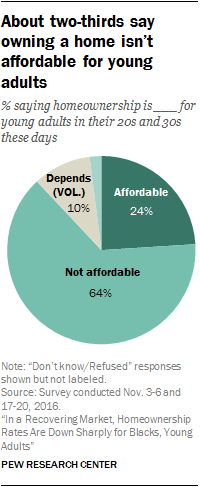
The majority of Americans (64%) – including similar shares across age groups – say homeownership is not affordable for young adults in their 20s and 30s these days. About half of the public (52%) says it is important to own a home in order to be considered part of the American middle class. This ranks lower than having a secure job (90%) and being able to save money for the future (82%), but above having a college education (27%).
Hispanics are notably more likely to say homeownership is a necessary part of being middle class. Some 64% of Hispanics say this, compared with about half of whites (49%) and blacks (51%). Americans who are less educated are also more likely to say owning a home is necessary to be in the middle class; 57% of those with a high school diploma or less education and 53% of those with some college experience say this, while 44% of college graduates share this view.
Definitions of racial/ethnic groups vary by data source. For Current Population Survey/Housing Vacancies and Homeownership Survey, references to whites include only those who are non-Hispanic and identify themselves as only one race. “Blacks” refers to those who identify themselves as only one race but include both Hispanic and non-Hispanic components. For Home Mortgage Disclosure Act data and Federal Reserve Survey of Consumer Finances data, whites and blacks include only those who are single-race non-Hispanic. For all secondary data, Hispanics are of any race and Asians are not analyzed separately due to small sample size. For survey data, whites include only those who are single-race non-Hispanic. Nonwhites include all other races and ethnicities.
Originated loans refers to loan applications that have been completely processed by the financial institution and the funds disbursed. Other loan dispositions include denying the application, the applicant withdrawing the application, or closing the application for incompleteness. In this report originated loans are also referred to as loans that have been approved or successful loan applications.
Higher-priced loans refers to home loans that have an annual percentage rate (APR) above a specific threshold. A first-lien loan is considered higher priced if the interest on it exceeds the average prime offer rate by at least 1.5 percentage points. Most subprime-rate loans are higher priced and most higher-priced loans are thought to originate in the subprime market. Higher-priced and subprime loans are not identical, but in this report “higher-priced loans” serves as a proxy for subprime loans and the terms are used interchangeably.
Financial assets are intangible assets whose value is derived from a contractual claim, as opposed to tangible assets such a home, vehicle, or commodities. Financial assets include cash, checking and savings accounts, savings bonds, certificates of deposit (CD), as well as retirement accounts (such as a 401(k) or IRA).


